ISSN: 2303-3703 32
Detection and Classification of three phase Power
Quality events using Wavelets Transforms and Soft
Computing Techniques
Abhijith Augustine1, Ruban Deva Prakash2, Rajy Xavier3 1
Research Scholar, PRIST University Thanjavur, India
2Principal, Heera College of Engineering & Technology, Thiruvanthapuram, India 3
Asst. Prof, Dept. of Electronics & Communication, METS School of Engg. Thrissur, India 1
[email protected], [email protected], [email protected]
Abstract
Analysis of power quality and its related problems is of very much important for both the utilities and end users. There are a large number of concerned authorities to monitor and mitigate the power quality problems. It requires a larger amount to deliver a poor power. So by considering the global economical losses, it is very much urgent to mitigate the various problems affecting the true power. Classification of problems is equally important to mitigation. The common power quality problems occurring are voltage sag, swell, harmonics, flickers etc. Good power determines the fitness of electric power to consumer devices and appliances. It is very important to maintain the detection accuracy of power quality events throughout the operation span. This paper deals with a study based on signal processing algorithms and soft computing techniques for the detection, classification and estimation of power quality events. The literature review points toward the application of wavelet transforms with different filters for achieving feature extraction. The power quality disturbance model is simulated using Simulink toolbox. It is observed that every power quality wavelet disturbance will show unique characteristics and it is generally used to provide an adoptable classification of power quality events. Because of the non-stationary and transitory behavior of the power quality events, the classification goes on challenging and demanding. Thus the feature extraction along with artificial neural network and fuzzy logic incorporated as a powerful tool.
Keywords: Power Quality (PQ), Wavelet Transform (WT), Feature Extraction, Artificial Neural
Networks, Artificial Intelligence (AI)
1. Introduction
The power supply (PQ) and its quality are very much important for all electrical utilities and the end user consumers. The lack of good power will reflect in the overall malfunction of the equipments and thereby reducing the operating efficiency and the device life span. The quality of electric power has become an important issue because, with the introduction and wide spread use of sensitive electronic equipments. In the present industrialized world, because of the continuous usage and increase in sources of disturbance, the electric power system suffers from unwanted variation in the voltage and current signals. The various power quality disturbances are sag, swell, harmonics, flickers etc. The after effects of these problems will vary according to the operating conditions and chances of occurrences. Here comes the importance of signal classification. Proper classification will help in applying accurate mitigation algorithms to these non linear sophisticated devices. The amount of faults will be considerably increased in the past years, because of the increased usage of non linear loads. It is also increased by the wide usage of modern electronic equipments like microprocessors, computers and sensitive equipments.
An operator must have a deep knowledge about the different sources of PQ disturbances, and then only the appropriate mitigation technique should be taken. Duration and type of disturbance is important in this classification. Manual observation approach and conventional averaging method is found inaccurate. There are many new and powerful tools for the analysis and operation of power systems, as well as for PQ diagnosis are currently available. Several automated methods for detection and classification is proposed in many
Title of manuscript is short and clear, implies research results (First Author)
recent papers. The involvement of Artificial Intelligence (AI) gives an additional boost to the classification algorithms. They include the combined operation of fuzzy logic systems with detailed rule base, artificial neural networks (ANN), support vector machines (SVM) etc. The AI techniques require a complex signal extracted features to complete its computation. The use of AI techniques in electric power has received extensive attention from researchers in the electric power area and the literature on these applications has become rather huge in volume.
Power quality is the critical issue in an electrical system. The proper rectification of these problems will increase the overall operating efficiency. This paper gives a brief survey on various classifications of general power quality events with the help of soft computing techniques. The paper points the importance of a powerful tool for power quality analysis. The wavelet analysis has been regarded as an effective signal processing tool for the detection and classification of power quality signals. Wavelets play an important role in the classification of discontinuous and fast varying disturbance signals. There are many research papers deals with the classification based on other algorithms like Fourier transforms, short-time Fourier transforms, S-transforms, rms methods, averaging methods etc. but these classification methods cannot easily recognize the time varying property of a non stationary signal. These defects can be overcome by wavelets based classification. But in case of stationary signals, the above mentioned techniques can be easily applied. The signal processing tools will continuously monitor the various power system quantities.
The classification and identification of each one of the disturbances is normally carried out from standards and recommendations depending on where the utilities operate (IEEE). The detection and classification of the different disturbances which cause power quality problems is a difficult task which requires a high level of engineering expertise. The main intelligent tools of interest include expert systems, fuzzy logic and artificial neural networks. The sudden events like voltage sag or swell needs to be detected immediately after the occurrence. A Dynamic Voltage Restorer (DVR) to be operated to compensate the disturbance. Thus rapid detection of disturbances with identification of types of events is essential for PQ enhancement.
2. Power Quality Events And Standards
The causes of power quality problems can be many. It is often difficult to point an exact cause for a faulty situation. Power quality monitoring equipments comes to aid in such situations.
Most of the causes of power quality problem can be divided into two categories internal causes and external causes. Detection of power quality events has become a major issue. According to International Electro technical Commission (IEC) impulsive and oscillatory transients, brief interruption, harmonic distortion, voltage swell or sag are considered as disturbances or an event. The major power quality events are described below according to IEEE Standard-1159, 1250.
•
ANSI C84.1 Electric Power Systems and Equipment•
ANSI MG-1 Motors and Generators•
ANSI C62.92.4-1991 IEEE Guide for the Application of Neutral Grounding in Electrical Utility Systems, Part IV-Distribution•
IEEE 141-1993 IEEE Recommended Practices For Electric Power Distribution For Industrial Plant Systems•
IEEE 519-1992 IEEE Recommended Practices And Requirements For Harmonic Control In Electrical Power Systems3. Power Quality Signal Processing Using Wavelets Transforms
The use of signal processing for power quality applications is not a new idea, as several researchers have used signal processing for more than a couple of decades. In the past few years, however, there has been a renewed interest in exploiting signal processing techniques for power quality measurements and analysis. The disturbance capturing techniques are usually based on detecting the power quality events when a certain threshold level is exceeded.
The Fourier transform consists of the decomposition of the signal into a sum of sinusoidal signals of different frequencies. The signal in the frequency domain is characterized by the angle and the module of each sinusoidal wave. So this analysis can be viewed as a mathematical transformation from the time domain to the frequency domain. Discrete Fourier transform (DFT) method is efficient for signal spectrum evaluation because of the simplicity and easy implementation. The use of the FFT can reduce the computational time required for DFT by several orders of magnitude. The implementation of the DFT by means of FFT algorithm forms the basis of the most modern spectral and harmonic analysis systems. DFT transforms a signal from the time domain to the frequency domain. This makes available the amplitude and phase of the fundamental and the harmonics present in the signal.
Fig: 1 Wavelet Transform
Wavelets are mathematical coefficients that divide sample set data into different frequency level of components, and then study the feature of each and every extracted component with a particular resolution matched to the signal sample size. The general concept behind wavelets transformation is to analyze signal according to their scale (sample size) of data, rather than its frequency of operation. The scale is defined as a frequency inverse. The scale based analysis reduces the sample size and hereby shortens the computation time. Different types of wavelets have been used as tools to solve problems in signal analysis, image analysis, medical diagnostics, geophysical signal processing, statistical analysis, pattern recognition, and many others; which describe the scope of wavelet analysis in time varying continuous signals. By using wavelet multi-resolution analysis, a signal can be represented by a finite sum of signal components at different resolution levels so that each component can be adaptively processed based on the objectives of the particular application point of view. This capability is regarded as the major strength of the wavelet analysis over other conventional signal analysis tools.
4. Discrete Wavelet Transform
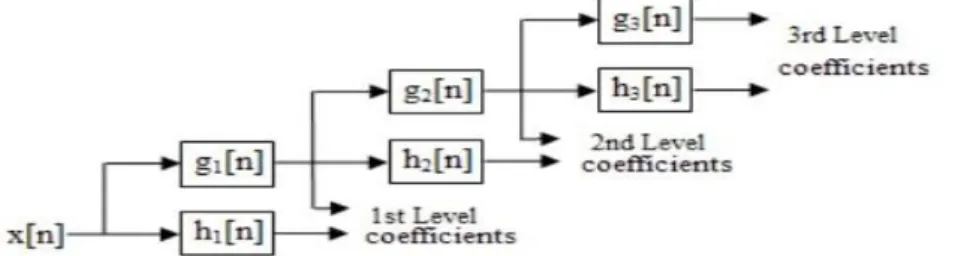
To further improve the disturbance detection rate by more effectively discriminating the signals from the noises after the DWT, a spatial-correlation-based noise-suppression algorithm is proposed, which can easily detect minor and shot duration faults. Discrete WT (DWT) can be viewed as a subset of Continuous WT (CWT), which is a sub form of ordinary wavelet transform. The CWT is not commonly used because of its computational complexity and lesser accuracy. Based on the characteristics of the band pass filters, the WT has been proposed to investigate the transient phenomena of the power signals from different scales of the WTCs. In practical applications, the DWT is commonly used. The DWT uses the low-pass h(k) and the high-pass g(k) filters to divide the frequency-band of the input signal f(k) in respective low- and high-frequency components into octave bands. The low-pass filter h(k) is determined from the scaling function. The high-pass filter g(k) is determined from both the wavelet and scaling functions. To extend the frequency resolution, decomposition of signal is done repeatedly and signal can be realized into two lower frequency ranges. This process is known as multi resolution analysis.
Title of manuscript is short and clear, implies research results (First Author)
Fig 2: Three level sub band wavelet packet decomposition
The DWT classifies the time domain discretized signal into the corresponding wavelet coefficients, and the process is known as “sub-band codification” and is achieved with the help of digital filters. The general DWT consists of two stages of operation. The first stage goes with the determination of various wavelet coefficients. These coefficients are a representation of the actual signal. The second stage deals the calculation with the approximated values, also known as reconstruction or simply “rebuilding”. Figure 1 shows the level of signal decomposition at the first stage.
5. Power Quality Monitoring System
The power Quality system is normally designed to monitor the set of survey data collected from the measuring system. Normally this survey is carried out after the happening of a live fault. In the past years there is little instrumentation available for power quality monitoring. These devices were found only in selected instrumentation fields. By the increase in market demand, the requirement is also increased considerably. The most ordinary method used for monitoring is limited to rms method only. The power quality monitoring is very important for industrial as well as commercial customers. The main steps in data monitoring are data collection, sampling, signal processing, report preparation, information sharing and customer satisfaction. The software based monitoring is very important in choosing a low cost, high efficient device. Monitoring section includes harmonics and inter-harmonics analysis also. FFT and Wavelets methods are mainly employed in monitoring, combined with soft computing techniques.
Fig 3: The FFT harmonic meter
The FFT harmonic meter is the commonly used experimental setup used for harmonics detection, evaluation and classification. The disturbance signal is applied to a low pass filter with regards to Shannon sampling theorem. The cut off frequency is limited with respect to applications. Normally it is limited to50th harmonic component. The PLL is used for sampling and storing. The sample size is chosen as 2K, where the sampling frequency is fs=2k /(NT0),
where T0 is the fundamental period of the signal and N is an integral.
6. Automatic Disturbance Recognition
Standard deviation curve method for classification is the conventional approach, but it fails to produce more accuracy indifferent signal categories. The automatic power quality
disturbance detection is an important and useful concept which combines the conventional signal processing techniques with the collaboration of artificial intelligence. In the test system different power quality disturbances for a frequency of 50Hz are observed and their wavelet coefficients are plotted, i.e. feature extraction and classification is done. The automatic system works on three phases, namely pre-processing, processing and post-processing phases. The determination of wavelet coefficients, wavelets classification, feature extraction etc is done on the pre-processing stage. A two level wavelet packet decomposition method for discrete wavelets are used. The processing state consists of a knowledge/data bank, where the information about the transformed coefficients is stored. Daubechies D4 wavelet is used. This bank of date can be further used for the training and adaptation of soft computing technologies. This helps the ANN or FLC to collect the accurate knowledge for processing state. The post-processing stage includes the classification of different disturbances. The training is required, so as to assign the most appropriate weight functions to the targets and inputs.
Fig 4: Proposed ANN Multilayered preceptron
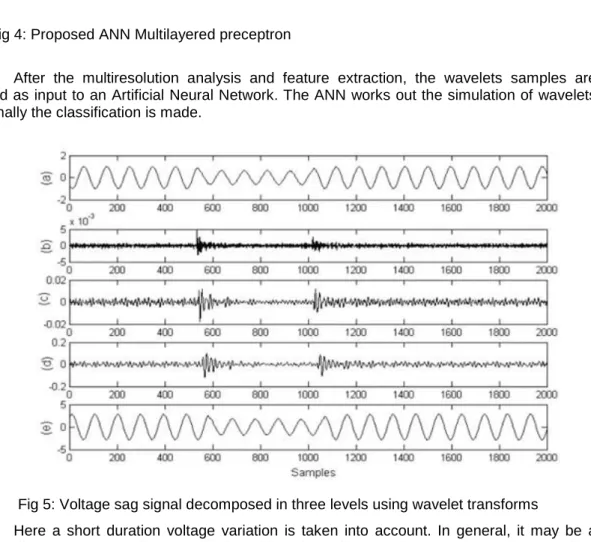
After the multiresolution analysis and feature extraction, the wavelets samples are applied as input to an Artificial Neural Network. The ANN works out the simulation of wavelets and finally the classification is made.
Fig 5: Voltage sag signal decomposed in three levels using wavelet transforms
Here a short duration voltage variation is taken into account. In general, it may be a sag, swell, transients etc. They are distributed into three different classes namely Class 1, Class 2 and Class 3 respectively. Separate training is done for each class for a set 15-20 set of examples. Supervised training algorithm is adopted here. This can be achieved by creating random set of disturbance voltages.ANN with a three layered feedforward structure is taken as
Title of manuscript is short and clear, implies research results (First Author)
the classifier. The inputs to the ANN are feature extracted samples. The output of the ANN the type of disturbance occurred. ANN is trained and its pattern recognition capabilities are well utilized. Weight adaptation ability is also observed.
5. Conclusion
Identification and classification of power quality disturbances is an important task in power systems. The classification will become tougher in the case of non stationary, time varying signals. For delivering true power, the sources of power quality disturbances must be well known. Several signal processing algorithms are discussed in this paper. The proposed method consists of the involvement of Artificial Intelligence in the signal classification, found to be a better solution for the detection and classification of different power quality disturbances. Software based simulation has been run on a test system to demonstrate the effectiveness of the proposed approach. The reduction in sample data size and increase in the computational speed are observed as the advantages of the test system. In future this approach could be utilized for achieving online, low cost PQ monitoring real time system with the help of data acquisition mechanisms. Hybrid systems like neuro-fuzzy can also be adopted in near future for better results.
References
[1] Haibo He, Janusz A. Starzyk, A Self-Organizing Learning Array System for Power Quality Classification Based on Wavelet Transform, IEEE TRANSACTIONS ON POWER DELIVERY, VOL. 21, NO. 1, JANUARY 2006.
[2] V. Kumar Chinnaiyan, Dr. Jovithajerome, J. Karpagam, “ Design and Realization of a Three Phase Cascaded Multilevel Inverter for Industrial Drives with Reduced Power Quality Issues”, International Review of Electrical Engineering(IREE), vol 5(issue 4): 1364-1369, JULY-AUGUST, 2010.
[3] M. H. J. Bollen, I. Y. H. Gu, Signal processing of power quality disturbances. Wiley-IEEE Press, 2006. [Online]. Available: http://dx.doi.org/10.1002/0471931314
[4] G. Rata, M. Rata, C. Filote, “Theoretical and experimental aspects concerning Fourier and wavelet analysis for deforming consumers in power network”, Elektronika ir Elektrotechnika (Electronics and Electrical Engineering), no. 1, pp. 62–66, 2010. [5] S. Chen, H. Y. Zhu, “Wavelet Transform for Processing Power Quality Disturbances”, EURASIP Journal on Advances in Signal Processing, 2007. [Online]. Available: http://dx.doi.org/10.1155/ 2007/47695
[5] O. Gencer, S. Ozturk, T. Erfidan, ―A new approach to voltage sag detection based on wavelet transform,‖ Electrical Power Energy System, vol. 32, pp. 133–140, 2010.
[6] D.Devaraj, P.Radhika, V.Subasri, R.Kanagavalli, ―Power Quality Monitoring using Wavelet Transform and Artificial Neural Networks,‖ Proceedings of India International Conference on Power Electronics, 2006.
[7] C.H. keow, P. Nallagownden, K.S. Rama Rao, ―A de-noising scheme for enhancing power quality problem classification system based on Wavelet Transform and Rule-Based Method,‖ International Conference on Electrical, Control and Computer Engineering, Pahang, Malaysia, pp. 201-206, June 2011.
[8] M. Uyar, S. Yildirim, M.T. Gencoglu, ―An expert system based on S-transform and neural network for automatic classification of power quality disturbances,‖ Expert System Application, vol. 36, pp. 5962–5975, 2009 [9] H. He and J. A. Starzyk, “A self-organizing learning array system for Power quality classification based on wavelet transform,” IEEE Trans.Power Del., vol. 21, no. 1, pp. 286– 295, Jan. 2006.
[10] Z.-L. Gaing, “Wavelet-based neural network forPower Quality disturbance Recognition and classification,” IEEE Trans. Power Del., vol. 19, no. 4, pp. 1560–1568, Oct. 2004. [11] B. Perunicic, M. Mallini, Z. Wang, and Y. Liu, “Power Quality Disturbance Detection and
Classification Using Wavelets and Artificial Neural Networks”, 8th International Conference On Harmonics and Quality of Power Proceedings, Vol.1, 1998, pp. 77–82. [12] I. Daubechies, “Ten Lectures on Wavelets”, SIAM, Philadelphia, 1992.
[13] F. Laurene, “Fundamentals of Neural Networks Architectures, Algorithms and Applications”, Prentice Hall, 1994
[14] A. K. Ghosh and D. L. Lubkeman, “The Classification of Power System Disturbance Waveforms Using a Neural Network Approach,” IEEE Transaction on Power Delivery, Vol. 10, No. 1, 1995, pp. 109-115.
[15] P. Janik and T. Lobos, “Automated Classification of Power Quality Disturbances Using SVM and RBF Networks,” IEEE Transaction on Power Delivery, Vol. 21, No. 3, 2006, pp. 1663-1669.
[16] B. Kosko, Neural Networks and Fuzzy Systems: A Dynamical System Approach to Machine Intelligence. Englewood Cliffs, NJ: Prentice- Hall, 1992, pp. 299–337.
[17] A. L. Dexter, “Fuzzy model based fault diagnosis,” Proc. Inst. Elect. Eng., vol. 146, no. 6, pp. 545–550, 1995. [18] A. Kawamura, N.Watanabe, H. Okada, and K. Asakawa, “A prototype of neuro-fuzzy cooperation system,” in Proc. IEEE Int. Conf. Fuzzy Systems, San Diego, CA, 1992, pp. 1275–1282.
[19] Mark McGranaghan, “Economic Evaluation of Power Quality”, IEEE Power Engg. review, Vol.22, issue 2, pages 8-12, Feb.