Wind Turbines and Health
A Critical Review of the Scientific Literature
Robert J. McCunney, MD, MPH, Kenneth A. Mundt, PhD, W. David Colby, MD, Robert Dobie, MD,
Kenneth Kaliski, BE, PE, and Mark Blais, PsyD
Objective:This review examines the literature related to health effects of wind turbines.Methods:We reviewed literature related to sound measure-ments near turbines, epidemiological and experimental studies, and factors associated with annoyance.Results:(1) Infrasound sound near wind tur-bines does not exceed audibility thresholds. (2) Epidemiological studies have shown associations between living near wind turbines and annoyance. (3) Infrasound and low-frequency sound do not present unique health risks. (4) Annoyance seems more strongly related to individual characteristics than noise from turbines.Discussion:Further areas of inquiry include enhanced noise characterization, analysis of predicted noise values contrasted with measured levels postinstallation, longitudinal assessments of health pre- and postinstallation, experimental studies in which subjects are “blinded” to the presence or absence of infrasound, and enhanced measurement techniques to evaluate annoyance.
T
he development of renewable energy, including wind, solar, and biomass, has been accompanied by attention to potential envi-ronmental health risks. Some people who live in proximity of wind turbines have raised health-related concerns about noise from their operations. The issue of wind turbines and human health has also now been explored and considered in a number of policy, regulatory, and legal proceedings.This review is intended to assess the peer-reviewed literature regarding evaluations of potential health effects among people living in the vicinity of wind turbines. It will include analysis and com-mentary of the scientific evidence regarding potential links to health effects, such as stress, annoyance, and sleep disturbance, among oth-ers, that have been raised in association with living in proximity to wind turbines. Efforts will also be directed to specific
compo-From the Department of Biological Engineering (Dr McCunney), Massachusetts Institute of Technology, Cambridge; Department of Epidemiology (Dr Mundt), Environ International, Amherst, Mass; Travel Immunization Clinic (Dr Colby), Middlesex-London Health Unit, London, Ontario, Canada; Dobie Associates (Dr Dobie), San Antonio, Tex; Environment, Energy and Acous-tics (Mr Kaliski), Resource Systems Group, White River Junction, Vt; and Psychological Evaluation and Research Laboratory (Dr Blais), Massachusetts General Hospital, Boston.
The Canadian Wind Energy Association (CanWEA) funded this project through a grant to the Department of Biological Engineering of the Massachusetts Institute of Technology (MIT). In accordance with MIT guidelines, members of the CanWEA did not take part in editorial decisions or reviews of the manuscript. Drs McCunney, Mundt, Colby, and Dobie and Mr Kaliski have provided testimony in environmental tribunal hearings in Canada and the USA. The Massachusetts Institute of Technology conducted an independent review of the final manuscript to ensure academic independence of the commentary and to eliminate any bias in the interpretation of the literature. All six coauthors also reviewed the entire manuscript and provided commentary to the lead author for inclusion in the final version.
The authors declare no conflicts of interest.
Supplemental digital contents are available for this article. Direct URL citation appears in the printed text and is provided in the HTML and PDF versions of this article on the journal’s Web site (www.joem.org).
Address correspondence to: Robert J. McCunney, MD, MPH, Department of Bio-logical Engineering, Massachusetts Institute of Technology, 77 Massachusetts Ave, 16-771, Cambridge, MA 02139 ([email protected]).
CopyrightC 2014 by American College of Occupational and Environmental Medicine
DOI: 10.1097/JOM.0000000000000313
nents of noise associated with wind turbines such as infrasound and low-frequency sound and their potential health effects.
We will attempt to address the following questions regarding wind turbines and health:
1. Is there sufficient scientific evidence to conclude that wind tur-bines adversely affect human health? If so, what are the circum-stances associated with such effects and how might they be pre-vented?
2. Is there sufficient scientific evidence to conclude that psycho-logical stress, annoyance, and sleep disturbance can occur as a result of living in proximity to wind turbines? Do these effects lead to adverse health effects? If so, what are the circumstances associated with such effects and how might they be prevented? 3. Is there evidence to suggest that specific aspects of wind turbine
sound such as infrasound and low-frequency sound have unique potential health effects not associated with other sources of envi-ronmental noise?
The coauthors represent professional experience and training in occupational and environmental medicine, acoustics, epidemiol-ogy, otolaryngolepidemiol-ogy, psycholepidemiol-ogy, and public health.
Earlier reviews of wind turbines and potential health implica-tions have been published in the peer-reviewed literature1–6by state
and provincial governments (Massachusetts, 2012, and Australia, 2014, among others) and trade associations.7
This review is divided into the following five sections: 1. Noise: The type associated with wind turbine operations, how it is
measured, and noise measurements associated with wind turbines. 2. Epidemiological studies of populations living in the vicinity of
wind turbines.
3. Potential otolaryngology implications of exposure to wind turbine sound.
4. Potential psychological issues associated with responses to wind turbine operations and a discussion of the health implications of continuous annoyance.
5. Governmental and nongovernmental reports that have addressed wind turbine operations.
METHODS
To identify published research related to wind turbines and health, the following activities were undertaken:
1. We attempted to identify and assess peer-reviewed literature re-lated to wind turbines and health by conducting a review of PubMed, the National Library of Medicines’ database that in-dexes more than 5500 peer-reviewed health and scientific journals with more than 21 million citations. Search terms were wind tur-bines, wind turbines and health effects, infrasound, infrasound and health effects, low-frequency sound, wind turbine syndrome, wind turbines and annoyance, and wind turbines and sleep disturbances. 2. We conducted a Google search for nongovernmental organiza-tion and government agency reports related to wind turbines and environmental noise exposure (see Supplemental Digital Content Appendix 1, available at: http://links.lww.com/JOM/A179).
3. After identifying articles obtained via these searches, they were categorized into five main areas that are noted below (section D) and referred to the respective authors of each section for their review and analysis. Each author then conducted their own addi-tional review, including a survey of pertinent references cited in the identified articles. Articles were selected for review and com-mentary if they addressed exposure and a health effect—whether epidemiological or experimental—or were primary exposure as-sessments.
4. Identified studies were categorized into the following areas: I. Sound, its components, and field measurements conducted in
the vicinity of wind turbines; II. Epidemiology;
III. Effects of sound components such as infrasound and low-frequency sound on health;
IV. Psychological factors associated with responses to wind turbines;
V. Governmental and nongovernmental reports.
5. The authors are aware of reports and commentaries that are not in the scientific or medical peer-reviewed literature that have raised concern about potential health implications for people who live near wind turbines. These reports describe relatively common symptoms with numerous causes, including headache, tinnitus, and sleep disturbance. Because of the difficulties in comprehen-sively identifying non–peer-reviewed reports such as these, and the inherent uncertainty in the quality of non–peer-reviewed re-ports, they were not included in our analysis, aside from some books and government reports that are readily identified. A simi-lar approach of excluding non–peer-reviewed literature in scien-tific reviews is used by the World Health Organization (WHO)’s International Agency for Research on Cancer (IARC) in its delib-erations regarding identification of human carcinogens.8
Interna-tional Agency for Research on Cancer, however, critically eval-uates exposure assessments not published in the peer-reviewed literature, if conducted with appropriate quality and in accor-dance with international standards and guidelines. International Agency for Research on Cancer uses this policy for exposure assessments because many of these efforts, although containing valuable data in evaluating health risks associated with an expo-sure to a hazard, are not routinely published. The USA National Toxicology Program also limits its critical analysis of potential carcinogens to the peer-reviewed literature. In our view, because of the critical effect of scientific studies on public policy, it is im-perative that peer-reviewed literature be used as the basis. Thus, in this review, only peer review studies are considered, aside from exposure-related assessments.
RESULTS
Characteristics of Wind Turbine Sound
In this portion of the review, we evaluate studies in which sound near wind turbines has been measured, discuss the use of mod-eled sound levels in dose–response studies, and review literature on measurements of low-frequency sound and infrasound from operat-ing wind turbines. We evaluate sound levels measured in areas, where symptoms have been reported in the context of proximity to wind tur-bines. We address methodologies used to measure wind turbine noise and low-frequency sound. We also address characteristics of wind turbine sound, sound levels measured near existing wind turbines, and the response of humans to different levels and characteristics of wind turbine sound. Special attention is given to challenges and methods of measuring wind turbine noise, as well as low-frequency sound (20 to 200 Hz) and Infrasound (less than 20 Hz).
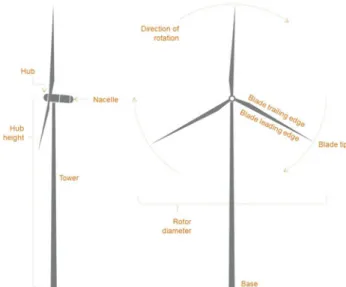
Wind turbines sound is made up from both moving com-ponents and interactions with nonmoving comcom-ponents of the wind turbine (Fig. 1). For example, mechanical components in the nacelle can generate noise and vibration, which can be radiated from the structure, including the tower. The blade has several components that create aerodynamic noise, such as the blade leading edge, which contacts the wind first in its rotation, the trailing edge, and the blade tip. Blade/tower interactions, especially where the blades are down-wind of the tower, can create infrasound and low-frequency sound. This tower orientation is no longer used in large wind turbines.9
Sound Level and Frequency
Sound is primarily characterized by its pitch or frequency as measured in Hertz (Hz) and its level as measured in decibels (dB). The frequency of a sound is the number of times in a second that the medium through which the sound energy is traveling (ie, air, in the case of wind turbine sound) goes through a compression cycle. Normal human hearing is generally in the range of 20 to 20,000 Hz. As an example, an 88-key piano ranges from about 27.5 to 4186 Hz with middle C at 261.6 Hz. As in music, ranges of frequencies can be described in “octaves,” where the center of each octave band has a frequency of twice that of the previous octave band (this is also written as a “1/1 octave band”). Smaller subdivisions can be used such as 1/3 and 1/12 octaves. The level of sound pressure for each frequency band is reported in decibel units.
To represent the overall sound level in a single value, the levels from each frequency band are logarithmically added. Because human hearing is relatively insensitive to very low- and high-frequency sounds, frequency-specific adjustments or weightings are added to the unweighted sound levels before summing to the overall level. The most common of these is the A-weighting, which simulates the human response to various frequencies at relatively low levels (40 phon or about 50 dB). Examples of A-weighted sound levels are shown in Fig. 2.
Other weightings are cited in the literature, such as the C-weighting, which is relatively flat at the audible spectrum; G-weighting, which simulates human perception and annoyance of sound that lie wholly or partly in the range from 1 to 20 Hz; and Z-weighting, which does not apply any weighting. The weighting of the sound is indicated after the dB label. For example, an A-weighted sound level of 45 dB would be written as 45 dBA or 45 dB(A). If no label is shown, the weighting is either implied or unweighted.
FIGURE 2. Sample A-weighted sound pressure levels.
Beyond the overall level, wind turbine noise may be amplitude modulated or have tonal components. Amplitude modulation is a regular cycling in the level of pure tone or broadband sound. A typical three-bladed wind turbine operating at 15 RPM would have a modulation period or cycle length of about 1.3 seconds. Tones are frequencies or narrow frequency bands that are much louder than the adjacent frequencies in sound spectra. Prominent tones can be identified through several standards, including ANSI S12.9 Part 4 and IEC 61400-11. Relative high-, mid-, and low-frequency content can also define how the sound is perceived, as well as many qualitative factors unique to the listener. Consequently, more than just the overall levels can be quantified, and studies have measured the existence of amplitude modulation, prominent tones, and spectral content in addition to the overall levels.
Wind Turbine Sound Power and Pressure Levels
The soundpowerlevel is the intrinsic sound energy radiated by a source. It is not dependent on the particular environment of the sound source and the location of the receiver relative to the source. The soundpressurelevel (SPL), which is measured by a sound-level meter at a location, is a function of the soundpoweremitted by neighboring sources and is highly dependent on the environment and the location of the receiver relative to the sound source(s).
Wind turbine sound is typically broadband in character with most of the sound energy at lower frequencies (less than 1000 Hz). Although wind turbines produce sound at frequencies less than the 25 Hz 1/3 octave band, sound power data are rarely published below that frequency. Most larger, utility-scale wind turbines have sound power levels between 104 and 107 dBA. Measured sound levels be-cause of wind turbines depend on several factors, including weather conditions, the number of turbines, turbine layout, local topogra-phy, the particular turbine used, distance between the turbines and the receiver, and local flora. Meteorological conditions alone can cause 7 to 14 dB variations in sound levels.10Examples of the SPLs
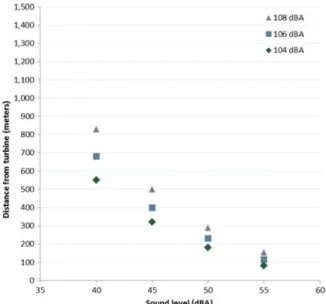
because of a single wind turbine with three different sound pow-ers, and at various distances, are shown in Fig. 3 as calculated with ISO 9613-2.11Measurement results of A-weighted, C-weighted, and
G-weighted sound levels have confirmed that wind turbine sound attenuates logarithmically with respect to distance.12
With respect to noise standards, Hessler and Hessler13found
an arithmetic average of 45 dBA daytime and 40 dBA nighttime for governments outside the United States, and a nighttime average of 47.7 dBA for US state noise regulation and siting standards. The metrics for those levels can vary. Common metrics are the day-evening-night level (Lden), day-night level (Ldn), equivalent average level (Leq), level exceeded 90% of the time (L90), and median (L50). The application of how these are measured and the time period over which they are measured varies, meaning that, from a practical
FIGURE 3. Sound levels at varying setbacks and turbine sound power levels—RSG Modeling, Using ISO 9613-2.
standpoint, sound-level limits are even more varied than the explicit numerical level. The Leq is one of the more commonly used metric. It is the logarithmic average of the squared relative pressure over a period of time. This results in a higher weighting of louder sounds.
Owing to large number of variables that contribute to SPLs because of wind turbines at receivers, measured levels can vary dramatically. At a wind farm in Texas, O’Neal et al14 measured
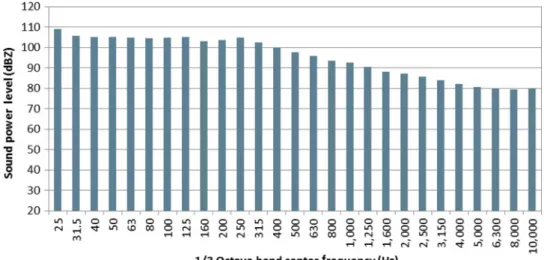
sound levels with the nearest turbine at 305 m (1000 feet) and with four turbines within 610 m (2000 feet) at 50 to 51 dBA and 63 dBC (10-minute Leq), with the turbines producing sufficient power to emit the maximum sound power. During the same test, sound levels were 27 dBA and 47 dBC (10-minute Leq) inside a home that was located 290 m (950 feet) from the nearest turbine and within 610 m (2000 feet) of four turbines15(see Fig. 4).
Bullmore et al16 measured wind turbine sound at distances
from 100 to 754 m (330 to 2470 feet), where they found sound levels ranging from 40 to 55 dBA over various wind conditions. At typical receiver distances (greater than 300 m or 1000 feet), sound was attenuated to below the threshold of hearing at frequencies above the 1.25 kHz 1/3 octave band. In studies mentioned here, measurements were made with the microphone between 1 and 1.6 m (3 and 5 feet) above ground.
Wind Turbine Emission Characteristics Low-Frequency Sound and Infrasound
Low-frequency sound is typically defined as sound from 20 to 200 Hz, and infrasound is sound less than 20 Hz. Low-frequency sound and infrasound measurement results at distances close to wind turbines (<500 meters) typically show infrasound because of wind farms, but not above audibility thresholds (such as ISO 226 or as published by the authors12,15,17–21,149). One study found sound levels
360 m and 200 m from a wind farm to be 61 dBG and 63 dBG, respec-tively. The threshold of audibility for G-weighted sound levels is 85 dBG. The same paper found infrasound levels of 69 dBG 250 m from a coastal cliff face and 76 dBG in downtown Adelaide, Australia.18One study found that, even at distances less than 450
feet (136 m), infrasound levels were 80 dBG or less. At more typical receiver distances (greater than 300 m or 1000 feet), infrasound lev-els were 72 dBG or less. This corresponded to A-weighted sound
FIGURE 4. Sound power of the Siemens SWT 2.3-93 (TX) wind turbine.15
levels of 56 and 49 dBA, respectively, higher than most existing regulatory noise limits.12
Farther away from wind farms (1.5 km) infrasound is no higher than what would be caused by localized wind conditions, reinforc-ing the necessity for adequate wind-caused pseudosound reduction measures for wind turbine sound-level measurements.22
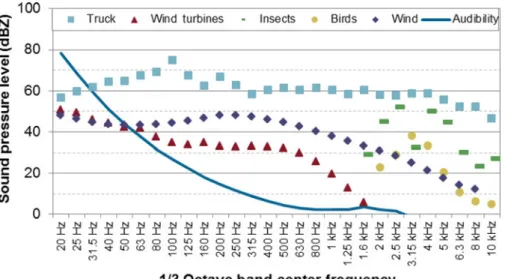
Low-frequency sound near wind farms is typically audible, with levels crossing the threshold of audibility between 25 and 125 Hz depending on the distance between the turbines and mea-surement location.12,15,19,20,23Figure 5 shows the frequency spectrum
of a wind farm measured at about 3500 feet compared with a truck at 50 feet, a field of insects and birds, wind moving through vegetation, and the threshold of audibility according to ISO 387-7.
Amplitude Modulation
Wind turbine sound emissions vary with blade velocity and are characterized in part by amplitude modulation, a broadband os-cillation in sound level, with a cycle time generally corresponding to the blade passage frequency. The modulation is typically located in the 1/1 octave bands from 125 Hz to 2 kHz. Fluctuation magnitudes are typically not uniform throughout the frequency range. These fluctuations are typically small (2 to 4 dB) but under more unusual circumstances can be as great as 10 dB for A-weighted levels and as much as 15 dB in individual 1/3 octave bands.19,24Stigwood et al24
found that, in groups of several turbines, the individual modulations can often synchronize causing periodic increases in the modulation magnitude for periods of 6 to 20 seconds with occasional periods where the individual turbine modulations average each other out, minimizing the modulation magnitude. This was not always the case though, with periods of turbine synchronization occasionally lasting for hours under consistent high wind shear, wind strength, and wind direction.
Amplitude modulation is caused by many factors, including blade passage in front of the tower (shadowing), sound emission directivity of the moving blade tips, yaw error of the turbine blades (where the turbine blades are not perpendicular to the wind), inflow turbulence, and high levels of wind shear.19,24,25Amplitude
modu-lation level is not correlated with wind speed. Most occurrences of “enhanced” amplitude modulation (a higher magnitude of modula-tion) are caused by anomalous meteorological conditions.19
Ampli-tude modulation varies by site. Some sites rarely exhibit ampliAmpli-tude modulation, whereas at others amplitude modulation has been mea-sured up to 30% of the time.10It has been suggested by some that
amplitude modulation may be the cause of “infrasound” complaints because of confusing of amplitude modulation, the modulation of a broadband sound, with actual infrasound.19
Tonality
Tones are specific frequencies or narrow bands of frequencies that are significantly louder than adjacent frequencies. Tonal sound is not typically generated by wind turbines but can be found in some cases.20,26In most cases, the tonal sound occurs at lower
frequen-cies (less than 200 Hz) and is due to mechanical noise originating from the nacelle, but has also been found to be due to structural vibrations originating from the tower, and anomalous aerodynamic characteristics of the blades27(see Fig. 5).
Sound Levels at Residences where Symptoms Have Been Reported
One recent research focus has been the sound levels at (and in) the residences of people who have complained about sound lev-els emitted by turbines as some have suggested that wind turbine noise may be a different type of environmental noise.28Few studies
have actually measured sound levels inside or outside the homes of people. Several hypotheses have been proposed about the charac-teristics of wind turbine noise complaints, including infrasound,28
low-frequency tones,20amplitude modulation,19,29and overall noise
levels.
Overall Noise Levels
Because of the large variability of noise sensitivity among people, sound levels associated with self-reported annoyance can vary considerably. (Noise sensitivity and annoyance are discussed in more detail later in this review.) People exposed to measured external sound levels from 38 to 53 dBA (10-minute or 1-hour Leq). Department of Trade and Industry,19Walker et al,28Gabriel et al,29
and van den Berg et al30,149have reported annoyance. Sound levels
have also been measured inside complainant residences at between 22 and 37 dBA (10-minute Leq).19
Low Frequency and Infrasonic Levels
Concerns have been raised in some settings that low-frequency sound and infrasound may be special features of wind turbine noise that lead to adverse health effects.31 As a result, noise
FIGURE 5. Comparison of frequency spectrum of a truck passby at 50 feet, wind turbines at 3500 feet, insects, birds, wind, and the threshold of au-dibility according to ISO 387-7.
on sound levels in the low-frequency range and occasionally the infrasonic range.
Infrasonic sound levels at residences are typically well below published audibility thresholds, even thresholds for those particularly sensitive to infrasound. Nevertheless, low-frequency sound typically exceeds audibility thresholds in a range starting between 25 and 125 Hz.19,20,23In some cases, harmonics of the blade passage frequency
(about 1 Hz, ie infrasound) have been measured at homes of people who have raised concerns about health implications of living near wind turbine with sound levels reaching 76 dB; however, these are well below published audibility thresholds.28
Amplitude Modulation
Amplitude modulation has been suggested as a major cause of complaints surrounding wind turbines, although little data have been collected to confirm this hypothesis. A recent study of resi-dents surrounding a wind farm that had received several complaints showed predicted sound levels at receiver distances to be 33 dBA or less. Residents were instructed to describe the turbine sound, when they found it annoying. Amplitude modulation was present in 68 of 95 complaints. Sound recorders distributed to the residents exhibited a high incidence of amplitude modulation.29
Limited studies have addressed the percentage of complaints surrounding utility-scale wind farms, with only one comparing the occurrence of complaints with sound levels at the homes. The com-plaint rate among residents within 2000 feet (610 m) of the perime-ter of five mid-wesperime-tern United States wind farms was approximately 4%. All except one of the complaints were made at residences, where wind farm sound levels exceeded 40 dBA.13The authors used the
LA90 metric to assess wind farm sound emissions. LA90 is the A-weighted sound level that is exceeded 90% of the time. This metric is used to eliminate wind-caused spikes and other short-term sound events that are not caused by the wind farm.
In Northern New England, 5% of households within 1000 m of turbines complained to regulatory agencies about wind turbine noise.32All complaints were included, even those that were related to
temporary issues that were resolved. Up to 48% of the complainants were at wind farms, where at least one noise violation was found or a variance from the noise standard. A third of the all complaints were due to a single wind farm.
Sound Measurement Methodology
Collection of accurate, comparable, and useful noise data de-pends on careful and consistent methodology. The general
method-ology for environmental sound level monitoring is found in ANSI 12.9 Part 2. This standard covers basic requirements that include the type of measurement equipment necessary, calibration proce-dures, windscreen specifications, microphone placement guidance, and suitable meteorological conditions. Nevertheless, there are no recommendations for mitigating the effects ofhighwinds (greater than 5 m/s) or measuring in the infrasonic frequency range (less than 20 Hz).33Another applicable standard is IEC 61400-11, which
provides a method for determining the sound power of individual wind turbines. The standard gives specifications for measurement positions, the type of data needed, data analysis methods, report content requirements, determination of tonality, determination of di-rectivity, and the definitions and descriptors of different acoustical parameters.34The standard specifies a microphone mounting method
to minimize wind-caused pseudosound, but some have found the setup to be insufficient under gusty wind conditions, and no recom-mendations are given for infrasound measurement.35 Because the
microphone is ground mounted, it is not suitable for long-term mea-surements.
Low-Frequency Sound and Infrasound Measurement
There are no standards currently in place for the measure-ment of wind turbine noise that includes the infrasonic range (ie, frequencies less than 20 Hz), although one is under develop-ment (ANSI/ASA S12.9 Part 7). Consequently, all current attempts to measure low-frequency sound and infrasound have either used an existing methodology, an adapted existing methodology, or proposed a new methodology.
The main problem with measuring low-frequency sound and infrasound in environmental conditions is wind-caused pseudosound due to air pressure fluctuation, because air flows over the microphone. With conventional sound-level monitoring, this effect is minimized with a wind screen and/or elimination of data measured during windy periods (less than 5 m/s [11 mph] at a 2-m [6.5 feet] height).36In the
case of wind turbines, where maximum sound levels may be coinci-dent with ground wind speeds greater than 5 m/s (11 mph), this is not the best solution. With infrasound in particular, wind-caused pseu-dosound can influence measurements, even at wind speeds down to 1 m/s.12In fact, many sound-level meters do not measure infrasonic
frequencies.
A common method of dealing with infrasound is using an additional wind screen to further insulate the microphone from air flow.18,35In some cases, this is simply a larger windscreen that
windscreen with a subterranean pit to shelter the microphone, and an-other used wind resistant cloth.35A compromise to an underground
microphone mounting is mounting the microphone close (20-cm height) to the ground, minimizing wind influence, or using a standard ground mounted microphone with mounting plate, as found in IEC 61400-11.35 Low-frequency sound and infrasound differences
be-tween measurements made with dedicated specialized windscreens and/or measurement setup and standard wind screens/measurements setups can be quite large.12,37Nevertheless, increased measurement
accuracy can come at the cost of reduced accuracy at higher frequen-cies using some methods.38
To further filter out wind-caused pseudosound, some authors have advocated a combination of microphone arrays and signal pro-cessing techniques. The purpose of the signal propro-cessing techniques is to detect elements of similarity in the sound field measured at the different microphones in the array.
Levels of infrasound from other environmental sources can be as high as infrasound from wind turbines. A study of infrasound measured at wind turbines and at other locations away from wind turbines in South Australia found that the infrasound level at houses near the wind turbines is no greater than that found in other urban and rural environments. The contribution of wind turbines to the infrasound levels is insignificant in comparison with the background level of infrasound in the environment.22
Conclusions
Wind turbine noise measurement can be challenging because of the necessity of measuring sound levels during high winds, and down to low frequencies. No widely accepted measurement method-ologies address all of these issues, meaning that methods used in published measurements can differ substantially, affecting the com-parability of results.
Measurements of low-frequency sound, infrasound, tonal sound emission, and amplitude-modulated sound show that infra-sound is emitted by wind turbines, but the levels at customary dis-tances to homes are typically well below audibility thresholds, even at residences where complaints have been raised. Low-frequency sound, often audible in wind turbine sound, typically crosses the au-dibility threshold between 25 and 125 Hz depending on the location and meteorological conditions.12,15,19,20,23Amplitude modulation, or
the rapid (once per second) and repetitive increase and decrease of broadband sound level, has been measured at wind farms. Amplitude modulation is typically 2 to 4 dB but can vary more than 6 dB in some cases (A-weighted sound levels).19,24
A Canadian report investigated the total number of noise-related complaints because of operating wind farms in Alberta, Canada, over its entire history of wind power. Wind power capacity exceeds 1100 MW; some of the turbines have been in operation for 20 years. Five noise-oriented complaints at utility-scale wind farms were reported over this period, none of which were repeated after the complaints were addressed. Complaints were more common during construction of the wind farms; other power generation methods (gas, oil, etc) received more complaints than wind power. Farmers and ranchers did not raise complaints because of effects on crops and cattle.41An Australian study found a complaint rate of less than
1% for residents living within 5 km of turbines greater than 1 MW. Complaints were concentrated among a few wind farms; many wind farms never received complaints.15
Reviewing complaints in the vicinity of wind farms can be effective in determining the level and extent of annoyance because of wind turbine noise, but there are limitations to this approach. A complaint may be because of higher levels of annoyance (rather annoyed or very annoyed), and the amount of annoyance required for an individual to complain may be dependent on the personality of the person and the corresponding attitude toward the visual effect of the turbines, their respective attitudes toward wind energy, and whether
they derive economic benefit from the turbines. (All of these factors are discussed in more detail later in this report.)
Few studies have addressed sound levels at the residents of people who have described symptoms they consider because of wind turbines. Limited available data show a wide range of levels (38 to 53 dBA [10-minute or 1-hour Leq] outside the residence and from 23 to 37 dBA [10-minute Leq] inside the residence).19,26,28,28The
rate of complaints surrounding wind farms is relatively low; 3% for residents within 1 mile of wind farms and 4% to 5% within 1 km.13,32,41
Epidemiological Studies of Wind Turbines
Key to understanding potential effects of wind turbine noise on human health is to consider relevant evidence from well-conducted epidemiological studies, which has the advantage of re-flecting risks of real-world exposures. Nevertheless, environmental epidemiology is an observational (vs experimental) science that de-pends on design and implementation characteristics that are subject to numerous inherent and methodological limitations. Nevertheless, evidence from epidemiological studies of reasonable quality may provide the best available indication of whether certain exposures— such as industrial wind turbine noise—may be harming human health. Critical review and synthesis of the epidemiological evi-dence, combined with consideration of evidence from other lines of inquiry (ie, animal studies and exposure assessments), provide a scientific basis for identifying causal relationships, managing risks, and protecting public health.
Methods
Studies of greatest value for validly identifying risk fac-tors for disease include well-designed and conducted cohort studies and case–control studies—provided that specific diseases could be identified—followed by cross-sectional studies (or surveys). Case reports and case series do not constitute epidemiological studies and were not considered because they lack an appropriate comparison group, which can obscure a relationship or even suggest one where none exists.39,40,42Such studies may be useful in generating
hypothe-ses that might be tested using epidemiological methods but are not considered capable of demonstrating causality, a position also taken by international agencies such as the WHO.8
Epidemiological studies selected for this review were identi-fied through searches of PubMed and Google Scholar using the fol-lowing key words individually and in various combinations: “wind,” “wind turbine,” “wind farm,” “windmill,” “noise,” “sleep,” “cardio-vascular,” “health,” “symptom,” “condition,” “disease,” “cohort,” “case–control,” “cross-sectional,” and “epidemiology.” In addition, general Web searches were performed, and references cited in all identified publications were reviewed. Approximately 65 documents were identified and obtained, and screened to determine whether (1) the paper described a primary epidemiological study (including ex-perimental or laboratory-based study) published in a peer-reviewed health, medical or relevant scientific journal; (2) the study focused on or at least included wind turbine noise as a risk factor; (3) the study measured at least one outcome of potential relevance to health; and (4) the study attempted to relate the wind turbine noise with the outcome.
Results
Of the approximately 80 articles initially identified in the search, only 20 met the screening criteria (14 observational and six controlled human exposure studies), and these were re-viewed in detail to determine the relative quality and valid-ity of reported findings. Other documents included several re-views and commentaries4,5,7,43–51; case reports, case studies, and
surveys23,52–54; and documents published in media other than
proceedings did not meet the peer-reviewed journal eligibility crite-rion but was included because it seemed to be the first epidemiolog-ical study on this topic and an impetus for subsequent studies.55
The 14 observational epidemiological studies were critically reviewed to assess their relative strengths and weaknesses on the basis of the study design and the general ability to avoid selection bias (eg, the selective volunteering of individuals with health complaints), information bias (eg, under- or overreporting of health complaints, possibly because of reliance on self-reporting), and confounding bias (the mixing of possible effects of other strong risk factors for the same disease because of correlation with the exposure).
Figure 6 depicts the 14 observational epidemiological studies published in peer-reviewed health or medical journals, all of which were determined to be cross-sectional studies or surveys. As can be seen from the figure, the 14 publications were based on analyses of data from only eight different study populations, that is, six publi-cations were based on analyses of a previously published study (eg, Pedersen et al56and Bakker et al57were based on the data from
Ped-ersen et al58) or on combined data from previously published studies
(eg, Pedersen and Larsman59and Pedersen and Waye60were based
on the combined data from Pedersen and Waye61,62; and Pedersen63
and Janssen et al64were based on the combined data from Pedersen
et al,58Pedersen and Waye,61and Pedersen and Waye62). Therefore,
in the short summaries of individual studies below, publications based on the same study population(s) are grouped.
Summary of Observational Epidemiological Studies
Possibly the first epidemiological study evaluating wind tur-bine sound and noise annoyance was published in the proceedings of the 1993 European Community Wind Energy Conference.55
In-vestigators surveyed 574 individuals (159 from the Netherlands, 216 from Germany, and 199 from Denmark). Up to 70% of the people
FIGURE 6. The 14 observational epidemiological studies published in peer-reviewed health or medical journals, all of which were determined to be cross-sectional studies or surveys.
resided near wind turbines for at least 5 years. No response rates were reported, so the potential for selection or participation bias cannot be evaluated. Wind turbine sound levels were calculated in 5 dBA intervals for each respondent, on the basis of site measurements and residential distance from turbines. The authors claimed that noise-related annoyance was weakly cornoise-related with objective sound levels but more strongly correlated with indicators of respondents’ attitudes and personality.55
In a cross-sectional study of 351 participants residing in prox-imity to wind turbines (power range 150 to 650 kW), Pederson (a coauthor of the Wolsink55study) and Persson and Waye61described
a statistically significant association between modeled wind turbine audible noise estimates and self-reported annoyance. In this section, “statistically significant” means that the likelihood that the results were because of chance is less than 5%. No respondents among the 12 exposed to wind turbine noise less than 30 dBA reported annoyance with the sound; however, the percentage reporting annoyance increased with noise exceeding 30 dBA. No differences in health or well-being outcomes (eg, tinnitus, cardiovascular disease, headaches, and irritability) were observed. With noise exposures greater than 35 dBA, 16% of respondents reported sleep disturbance, whereas no sleep disturbance was reported among those exposed to less than 35 dBA. Although the authors observed that the risk of annoyance from wind turbine noise exposure increased statistically significantly with each increase of 2.5 dBA, they also reported a statistically significant risk of reporting noise annoyance among those self-reporting a negative attitude toward the visual effect of the wind turbines on the landscape scenery (measured on a five-point scale ranging from “very positive” to “very negative” opinion). These results suggest that attitude toward visual effect is an important contributor to annoyance associated with wind turbine noise. In addition to its reliance on self-reported outcomes, this study is limited by selection or participation bias, suggested by the difference in response rate between the highest-exposed individuals (78%) versus lowest-exposed individuals (60%).
Pederson62examined the association between modeled wind
turbine sound pressures and self-reported annoyance, health, and well-being among 754 respondents in seven areas in Sweden with wind turbines and varying landscapes. A total of 1309 surveys were distributed, resulting in a response rate of 57.6%. Annoyance was sig-nificantly associated with SPLs from wind turbines as well as having a negative attitude toward wind turbines, living in a rural area, wind turbine visibility, and living in an area with rocky or hilly terrain. Those annoyed by wind turbine noise reported a higher prevalence of lowered sleep quality and negative emotions than those not an-noyed by noise. Because of the cross-sectional design, it cannot be determined whether wind turbine noise caused these complaints or if those who experienced disrupted sleep and negative emotions were more likely to notice and report annoyance from noise. Measured SPLs were not associated with any health effects studied. In the same year, Petersen et al reported on what they called a “grounded theory study” in which 15 informants were interviewed in depth regarding the reasons they were annoyed with wind turbines and as-sociated noise. Responses indicated that these individuals perceived the turbines to be an intrusion and associated with feelings of lack of control and influence.65Although not an epidemiological study,
this exercise was intended to elucidate the reasons underlying the reported annoyance with wind turbines.
Further analyses of the combined data from Pedersen and Waye61,62 (described above) were published in two additional
papers.59,60 The pooled data included 1095 participants exposed
to wind turbine noise of at least 30 dBA. As seen in the two orig-inal studies, a significant association between noise annoyance and SPL was observed. A total of 84 participants (7.7%) reported being fairly or very annoyed by wind turbine noise. Respondents reporting wind turbines as having a negative effect on the scenery were also
statistically significantly more likely to report annoyance to wind turbine noise, regardless of SPLs.59Self-reported stress was higher
among those who were fairly or very annoyed compared with those not annoyed; however, these associations could not be attributed specifically to wind turbine noise. No differences in self-reported health effects such as hearing impairment, diabetes, or cardiovascu-lar diseases were reported between the 84 (7.7%) respondents who were fairly or very annoyed by wind turbine noise compared with all other respondents.60The authors did not report the power of the study.
Pederson et al56–58 evaluated the data from 725 residents in
the Netherlands living within 2.5 km of a site containing at least two wind turbines of 500 kW or greater. Using geographic informa-tion systems methods, 3727 addresses were identified in the study target area, for which names and telephone numbers were found for 2056; after excluding businesses, 1948 were determined to be residences and contacted. Completed surveys were received from 725 for a response rate of 37%. Although the response rate was lower than in previous cross-sectional studies, nonresponse analy-ses indicated that similar proportions responded across all landscape types and sound pressure categories.57Calculated sound levels, other
sources of community noise, noise sensitivity, general attitude, and visual attitude toward wind turbines were evaluated. The authors reported an exposure–response relationship between calculated A-weighted SPLs and self-reported annoyance. Wind turbine noise was reported to be more annoying than transportation noise or industrial noise at comparable levels. Annoyance, however, was also correlated with a negative attitude toward the visual effect of wind turbines on the landscape. In addition, a statistically significantly decreased level of annoyance from wind turbine noise was observed among those who benefited economically from wind turbines, despite equal perception of noise and exposure to generally higher (greater than 40 dBA) sound levels.58 Annoyance was strongly correlated with
self-reporting a negative attitude toward the visual effect of wind turbines on the landscape scenery (measured on a five-point scale ranging from “very positive” to “very negative” opinion). The low response rate and reliance on self-reporting of noise annoyance limit the interpretation of these findings.
Results of further analyses of noise annoyance were reported in a separate report,56which indicated that road traffic noise had no
effect on annoyance to wind turbine noise and vice versa. Visibility of, and attitude toward, wind turbines and road traffic were signifi-cantly related to annoyance from their respective noise source; stress was significantly associated with both types of noise.56,157
Additional analyses of the same data were performed using a structural equation approach that indicated that, as with annoy-ance, sleep disturbance increased with increasing SPL because of wind turbines; however, this increase was statistically significant only at pressures of 45 dBA and higher. Results of analyses of the combined data from the two Swedish61,62 and the Dutch58
cross-sectional studies have been published in two additional papers. Us-ing the combined data from these three predecessor studies, Pedersen et al56,58identified 1755 (ie, 95.9%) of the 1830 total participants
for which complete data were available to explore the relationships between calculated A-weighted SPLs and a range of indicators of health and well-being. Specifically, they considered sleep interrup-tion; headache; undue tiredness; feeling tense, stressed, or irritable; diabetes; high blood pressure; cardiovascular disease; and tinnitus.63
As in the precursor studies, noise annoyance indoors and outdoors was correlated with A-weighted SPLs. Sleep interruption seemed at higher sound levels and was also related to annoyance. No other health or well-being variables were consistently related to SPLs. Stress was not directly associated with SPLs but was associated with noise-related annoyance.
Another report based on these data (in these analyses, 1820 of the 1830 total participants) modeled the relationship between wind turbine noise exposure and annoyance indoors and outdoors.64
The authors excluded respondents who benefited economically from wind turbines, then compared their modeled results with other modeled relationships for industrial and transportation noise; they claimed that annoyance from wind turbine noise at or higher than 45 dBA is associated with more annoyance than other noise sources.
Shepherd et al,66 who had conducted an earlier evaluation
of noise sensitivity and Health Related Quality of Life (HRQL),158
compared survey results from 39 residents located within 2 km of a wind turbine in the South Makara Valley in New Zealand with 139 geographically and socioeconomically matched individuals who resided at least 8 km from any wind farm. The response rates for both the proximal and more distant study groups were poor, that is, 34% and 32%, respectively, although efforts were made to blind respondents to the study hypotheses. No indicator of exposure to wind turbine noise was considered beyond the selection of individu-als based on the proximity of their residences from the nearest wind turbine. Health-related quality-of-life (HRQOL) scales were used to describe and compare the general well-being and well-being in the physical, psychological, and social domains of each group. The au-thors reported statistically significant differences between the groups in some HRQOL domain scores, with residents living within 2 km of a turbine installation reporting lower mean physical HRQOL domain score (including lower component scores for sleep quality and self-reported energy levels) and lower mean environmental quality-of-life (QOL) scores (including lower component scores for considering one’s environment to be less healthy and being less satisfied with the conditions of their living space). No differences were reported for social or psychological HRQOL domain scores. The group residing closer to a wind turbine also reported lower amenity but not related to traffic or neighborhood noise annoyance. Lack of actual wind tur-bine and other noise source measurements, comtur-bined with the poor response rate (both noted by the authors as limitations), limits the inferential value of these results because they may pertain to wind turbine emissions.66
Possibly the largest cross-sectional epidemiological study of wind turbine noise on QOL was conducted in an area of northern Poland with the most wind turbines.67Surveys were completed by a
total of 1277 adults (703 women and 574 men), aged 18 to 94 years, representing a 10% two-stage random sample of the selected com-munities. Although the response rate was not reported, participants were sequentially enrolled until a 10% sample was achieved, and the proportion of individuals invited to participate but unable or refus-ing to participate was estimated at 30% (B. Mroczek, dr hab n. zdr., e-mail communication, January 2, 2014). Proximity of residence was the exposure variable, with 220 (17.2%) respondents within 700 m; 279 (21.9%) between 700 and 1000 m; 221 (17.3%) between 1000 and 1500 m; and 424 (33.2%) residing more than 1500 m from the nearest wind turbine. Indicators of QOL and health were measured using the Short Form–36 Questionnaire (SF-36). The SF-36 con-sists of 36 questions specifically addressing physical functioning, role-functioning physical, bodily pain, general health, vitality, so-cial functioning, role-functioning emotional, and mental health. An additional question concerning health change was included, as well as the Visual Analogue Scale for health assessment. It is unclear whether age, sex, education, and occupation were controlled for in the statistical analyses. The authors report that, within all subscales, those living closest to wind farms reported the best QOL, and those living farther than 1500 m scored the worst. They concluded that liv-ing in close proximity of wind farms does not result in the worsenliv-ing of, and might improve, the QOL in this region.67
A small survey of residents of two communities in Maine with multiple industrial wind turbines compared sleep and general health outcomes among 38 participants residing 375 to 1400 m from the nearest turbine with another group of 41 individuals re-siding 3.3 to 6.6 km from the nearest wind turbine.68 Participants
health and attitudinal topics. Prevalence of self-reported health and other complaints was compared by distance from the wind turbines, statistically controlling for age, sex, site, and household cluster in some analyses. Participants living within 1.4 km of a wind turbines reported worse sleep, were sleepier during the day, and had worse SF-36 Mental Component Scores compared with those living farther than 3.3 km away. Statistically significant correlations were reported between Pittsburgh Sleep Quality Index, Epworth Sleepiness Scale, SF-36 Mental Component Score, and log-distance to the nearest wind turbine. The authors attributed the observed differences to the wind turbines68; methodological problems such as selection and reporting
biases were overlooked. This study has a number of methodological limitations, most notably that all of the “near” turbine groups were plaintiffs in a lawsuit against the wind turbine operators and had already been interviewed by the lead investigator prior to the study. None of the “far” group had been interviewed; they were “cold called” by an assistant. This differential treatment of the two groups introduces a bias in the integrity of the methods and corresponding results. Details of the far group, as well as participation rates, were not noted.68
In another study, the role of negative personality traits (de-fined by the authors using separate scales for assessing neuroticism, negative affectivity, and frustration intolerance) on possible associa-tions between actual and perceived wind turbine noise and medically unexplained nonspecific symptoms was investigated via a mailed survey.69Of the 1270 identified households within 500 m of eight
0.6 kW micro-turbine farms and within 1 km of four 5 kW small wind turbine farms in two cities in the United Kingdom, only 138 ques-tionnaires were returned, for a response rate of 10%. No association was noted between calculated and actual noise levels and nonspecific symptoms. A correlation between perceived noise and nonspecific symptoms was seen among respondents with negative personality traits. Despite the participant group’s reported representativeness of the target population, the low survey response rate precludes firm conclusions on the basis of these data.69
In a study of residents living near a “wind park” in Western New York State, surveys were administered to 62 individuals living in 52 homes.70The wind park included 84 turbines. No association
was noted between self-reported annoyance and short duration sound measurements. A correlation was noted between the measure of a person’s concern regarding health risks and reported measures of the prevalence of sleep disturbance and stress. While a cross-sectional study is based on self-reported annoyance and health indicators, and therefore limited in its interpretation, one of its strengths is that it is one of the few studies that performed actual sound measurements (indoors and outdoors).
A small but detailed study on response to the wind turbine noise was carried out in Poland.71 The study population consisted
of 156 people, age 15–82 years, living in the vicinity of 3 wind farms located in the central and northwestern parts of Poland. No exclusion criteria were applied, and each individual agreeing to par-ticipate was sent a questionnaire patterned after the one used in the Pederson 2004 and Pederson 2007 studies and including ques-tions on living condiques-tions, self-reported annoyance due to noise from wind turbines, and self-assessment of physical health and well-being (such as headaches, dizziness, fatigue, insomnia, and tinnitus). The response rate was 71%. Distance from the nearest wind turbine and modeled A-weighted SPLs were considered as exposure indicators. One third (33.3%) of the respondents found wind turbine noise an-noying outdoors, and one fifth (20.5%) found the noise anan-noying while indoors. Wind turbine noise was reported as being more an-noying than other environmental noises, and self-reported annoyance increased with increasing A-weighted SPLs. Factors such as attitude toward wind turbines and “landscape littering” (visual impact) in-fluenced the perceived annoyance from the wind turbine noise. This study, as with most others, is limited by the cross-sectional design
and reliance on self-reported health and well-being indicators; how-ever, analyses focused on predictors of self-reported annoyance, and found that wind turbine noise, attitude toward wind turbines, and attitude toward “landscape littering” explain most of the reported annoyance.
Other Possibly Relevant Studies
A publication based on the self-reporting of 109 individuals who “perceived adverse health effects occurring with the onset of an industrial wind turbine facility” indicated that 102 reported either “altered health or altered quality of life.” The authors appropriately noted that this was a survey of self-selected participants who chose to respond to a questionnaire specifically designed to attract those who had health complaints they attributed to wind turbines, with no comparison group. Nevertheless, the authors inappropriately draw the conclusion that “Results of this study suggest an underlying relationship between wind turbines and adverse health effects and support the need for additional studies.”48(p.336)Such a report cannot
provide valid evidence of any relationship for which there is no comparison and is of little if any inferential value.
Researchers at the School of Public Health, University of Syd-ney, in Australia conducted a study to explore psychogenic explana-tions for the increase around 2009 of wind farm noise and/or health complaints and the disproportionate corresponding geographic dis-tribution of those complaints.52They obtained records of complaints
about noise or health from residents living near all 51 wind farms (1634 turbines) operating between 1993 and 2012 from wind farm companies and corroborated with documents such as government public enquiries, news media records, and court affidavits. Of the 51 wind farms, 33 (64.7%) had no record of noise or health com-plaints, including all wind farms in Western Australia and Tas-mania. The researchers identified 129 individuals who had filed complaints, 94 (73%) of whom lived near six wind farms tar-geted by anti-wind advocacy groups. They observed that 90% of complaints were registered after anti-wind farm groups included health concerns as part of their advocacy in 2009. The authors con-cluded that their findings were consistent with their psychogenic hypotheses.
Discussion
No cohort or case–control studies were located in this up-dated review of the peer-reviewed literature. The lack of pub-lished case–control studies is less surprising and less critical be-cause there has been no discrete disease or constellation of diseases identified that likely or might be explained by wind turbine noise. Anecdotal reports of symptoms associated with wind turbines in-clude a broad array of nonspecific symptoms, such as headache, stress, and sleep disturbance, that afflict large proportions of the general population and have many recognized risk factors. Retro-spectively associating such symptoms with wind turbines or even measured wind turbine noise—as would be necessary in case– control studies—does not prevent recall bias from influencing the results.
Although cross-sectional studies and surveys have the advan-tage of being relatively simple and inexpensive to conduct, they are susceptible to a number of influential biases. Most importantly, however, is the fact that, because of the simultaneous ascertain-ment of both exposure (eg, wind turbine noise) and health outcomes or complaints, the temporal sequence of exposure–outcome rela-tionship cannot be demonstrated. If the exposure cannot be estab-lished to precede the incidence of the outcome—and not the reverse, that is, the health complaint leads to increased perception of or an-noyance with the exposure, as with insomnia headaches or feeling tense/stressed/irritable—the association cannot be evaluated for a possible causal nature.
Conclusions
A critical review and synthesis of the evidence available from the eight study populations studied to date (and reported in 14 publi-cations) provides some insights into the hypothesis that wind turbine noise harms human health in those living in proximity to wind tur-bines. These include the following:
r No clear or consistent association is seen between noise from wind turbines and any reported disease or other indicator of harm to human health.
r In most surveyed populations, some individuals (generally a small proportion) report some degree of annoyance with wind turbines; however, further evaluation has demonstrated:
•Certain characteristics of wind turbine sound such as its in-termittence or rhythmicity may enhance reported perceptibility and annoyance;
•The context in which wind turbine noise is emitted also influ-ences perceptibility and annoyance, including urban versus rural setting, topography, and landscape features, as well as visibility of the wind turbines;
•Factors such as attitude toward visual effect of wind turbines on the scenery, attitude toward wind turbines in general, per-sonality characteristics, whether individuals benefit financially from the presence of wind turbines, and duration of time wind turbines have been in operation all have been correlated with self-reported annoyance; and
•Annoyance does not correlate well or at all with objective sound measurements or calculated sound pressures.
r Complaints such as sleep disturbance have been associated with A-weighted wind turbine sound pressures of higher than 40 to 45 dB but not any other measure of health or well-being. Stress was associated with annoyance but not with calculated sound pressures.63
r Studies of QOL including physical and mental health scales and residential proximity to wind turbines report conflicting findings– one study (with only 38 participants living within 2.0 km of the nearest wind turbine) reported lower HRQOL among those living closer to wind turbines than respondents living farther away,66whereas the largest of all studies (with 853 living within
1500 m of the nearest wind turbine)67found that those living closer
to wind turbines reported higher QOL and health than those living farther away.67
Because these statistical correlations arise from cross-sectional studies and surveys in which the temporal sequence of the exposure and outcome cannot be evaluated, and where the effect of various forms of bias (especially selection/volunteer bias and re-call bias) may be considerable, the extent to which they reflect causal relationships cannot be determined. For example, the claims such as “We conclude that the noise emissions of wind turbines disturbed the sleep and caused daytime sleepiness and impaired mental health in residents living within 1.4 km of the two wind turbines installations studied” cannot be substantiated on the basis of the actual study design used and some of the likely biases present.70
Notwithstanding the limitations inherent to cross-sectional studies and surveys—which alone may provide adequate explanation for some of the reported correlations—several possible explanations have been suggested for the wind turbines–associated annoyance reported in many of these studies, including attitudinal and even personality characteristics of the survey participants.69Pedersen and
colleague,59 who have been involved in the majority of
publica-tions on this topic, noted “The enhanced negative response [toward wind turbines] could be linked to aesthetical response, rather than to multi-modal effects of simultaneous auditory and visual stimulation, and a risk of hindrance to psycho-physiological restoration could not be excluded.”(p.389) They also found that wind turbines might
be more likely to elicit annoyance because some perceive them to be “intrusive” visually and with respect to their noise.65
Alterna-tive explanations on the basis of evaluation of all health complaints filed between 1993 and 2012 with wind turbine operators across Australia include the influence of anti-wind power activism and the surrounding publicity on the likelihood of health complaints, calling the complaints “communicated diseases.”52
As noted earlier, the 14 papers meeting the selection criteria for critical review and synthesis were based on only eight indepen-dent study groups—three publications were based on the same study group from the Netherlands58and four additional publications were
based on the combined data from the two Swedish surveys61,62or
from the combined data from all three. The findings across studies based on analyses of the same data are not independent observa-tions, and therefore the body of available evidence may seem to be larger and more consistent than it should. This observation does not necessarily mean that the relationships observed (or the lack of associations between calculated wind turbines sound pressures and disease or other indicators of health) are invalid, but that consistency across reports based on the same data should not be overinterpreted as independent confirmation of findings. Perhaps more important is that all eight were cross-sectional studies or surveys, and therefore inherently limited in their ability to demonstrate the presence or absence of true health effects.
Recent controlled exposure laboratory evaluations lend sup-port to the notion that resup-ports of annoyance and other complaints may reflect, at least in part, preconceptions about the ability of wind turbine noise to harm health52,71,72or even the color of the turbine73
more than the actual noise emission.
Sixty years ago, Sir Austin Bradford Hill delivered a lecture entitled “Observations and Experiment” to the Royal College of Occupational Medicine. In his lecture, Hill stated that “The observer may well have to be more patient than the experimenter—awaiting the occurrence of the natural succession of events he desires to study; he may well have to be more imaginative—sensing the correlations that lie below the surface of his observations; and he may well have to be more logical and less dogmatic—avoiding as the evil eye the fallacy of ‘post hoc ergo propter hoc,’ the mistaking of correlation for causation.”74(p.1000)
Although it is typical and appropriate to point out the obvious need for additional research, it may be worth emphasizing that more research of a similar nature—that is, using cross-sectional or survey approaches—is unlikely to be informative, most notably for public policy decisions. Large, well-conducted prospective cohort studies that document baseline health status and can objectively measure the incidence of new disease or health conditions over time with the introduction would be the most informative. On the contrary, the phenomena that constitute wind turbine exposures—primarily noise and visual effect—are not dissimilar to many other environ-mental (eg, noise of waves along shorelines) and anthropogenic (eg, noise from indoor Heating Ventilation and Air Conditioning or road traffic) stimuli, for which research and practical experience indicate no direct harm to human health.
Sound Components and Health: Infrasound, Low-Frequency Sound, and Potential Health Effects
Introduction
This section addresses potential health implications of infra-sound and low-frequency infra-sound because claims have been made that the frequency of wind turbine sound has special characteristics that may present unique health risks in comparison with other sources of environmental sound.
Wind turbines produce two kinds of sound. Gears and gener-ators can make mechanical noise, but this is less prominent than the
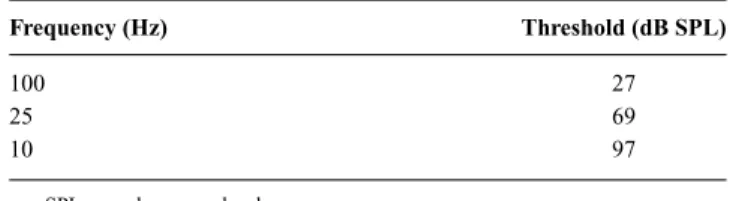
TABLE 1. Human Thresholds for Different Frequencies
Frequency (Hz) Threshold (dB SPL)
100 27
25 69
10 97
SPL, sound pressure level.
aerodynamic noise of the blades, whose tips may have velocities in excess of 200 mph. Three-bladed turbines often rotate about once every 3 seconds; their “blade-pass” frequency is thus about 1 Hz (Hz: cycle per second). For this reason, the aerodynamic noise often rises and falls about once per second, and some have described the sounds as “whooshing” or “pulsing.”
Several studies44,75,76have shown that at distances of 300 m
or more, wind turbine sounds are below human detection thresholds for frequencies less than 50 Hz. The most audible frequencies (those whose acoustic energies exceed human thresholds the most) are in 500 to 2000 Hz range. At this distance from a single wind turbine, overall levels are typically 35 to 45 dBA.77,78These levels can be
audible in a typical residence with ambient noise of 30 dBA and windows open (a room with an ambient level of 30 dBA would be considered by most people to be quiet or very quiet). In outdoor environments, sound levels drop about 6 dB for every doubling of the distance from the source, so one would predict levels of 23 to 33 dBA, that is, below typical ambient noise levels in homes, at a distance of 1200 m. For a wind farm of 12 large turbines, Møller and Pedersen79predicted a level of 35 dBA at a distance of 453 m.
As noted earlier in this report, sound intensity is usually mea-sured in decibels (dB), with 0 dB SPL corresponding to the softest sounds young humans can hear. Nevertheless, humans hear well only within the frequency range that includes the frequencies most im-portant for speech understanding—about 500 to 5000 Hz. At lower frequencies, hearing thresholds are much higher.75 Although
fre-quencies lower than 20 Hz are conventionally referred to as “infra-sound,” sounds in this range can in fact be heard, but only when they are extremely intense (a sound of 97 dB SPL has 10 million times as much energy as a sound of 27 dB; see Table 1).
Complex sounds like those produced by wind turbines contain energy at multiple frequencies. The most complete descriptions of such sounds include dB levels for each of several frequency bands (eg, 22 to 45 Hz, 45 to 90 Hz, 90 to 180 Hz, . . . , 11,200 to 22,400 Hz). It is simpler, and appropriate in most circumstances, to specify over-all sound intensity using meters that give full weight to the frequen-cies people hear well, and less weight to frequenfrequen-cies less than 500 Hz and higher than 5000 Hz. The resulting metric is “A-weighted” decibels or dBA. Levels in dBA correlate well with audibility; in a very quiet place, healthy young people can usually detect sounds less than 20 dBA.
Low-Frequency Sound and Infrasound
Low-frequency noise (LFN) is generally considered frequen-cies from 20 to 250 Hz, as described earlier in more detail in subsec-tion “Low Frequency and Infrasonic Levels.” The potential health implications of low-frequency sound from wind turbines have been investigated in a study of four large turbines and 44 smaller turbines in the Netherlands.17In close proximity to the turbines, infrasound
levels were below audibility. The authors suggested that LFN could be an important aspect of wind turbine noise; however, they did not link measured or modeled noise levels with any health outcome measure, such as annoyance.
A literature review of infrasound and low-frequency sound concluded that low-frequency sound from wind turbines at resi-dences did not exceed levels from other common noise sources, such as traffic.44The authors concluded that a “statistically significant
as-sociation between noise levels and self-reported sleep disturbance was found in two of the three [epidemiology] studies.”(p.1). It has
been suggested that LFN from wind turbines causes other and more serious health problems, but empirical support for these claims is lacking.44
Sounds with frequencies lower than 20 Hz (ie, infrasound) may be audible at very high levels. At even higher levels, subjects may experience symptoms from very low-frequency sounds—ear pressure (at levels as low as 127 dB SPL), ear pain (at levels higher than 145 dB), chest and abdominal movement, a choking sensa-tion, coughing, and nausea (at levels higher than 150 dB).80,81The
National Aeronautics and Space Administration considered that in-frasound exposures lower than 140 dB SPL would be safe for astro-nauts; American Conference of Governmental Industrial Hygienists recommends a threshold limit value of 145 dB SPL for third-octave band levels between 1 and 80 Hz.81As noted earlier, infrasound from
wind turbines has been measured at residential distances and noted to be many orders of magnitude below these levels.
Whenever wind turbine sounds are audible, some people may find the sounds annoying, as discussed elsewhere in this review. Some authors, however, have hypothesized that even inaudible sounds, especially at very low frequencies, could affect people by activating several types of receptors, including the following:
1. Outer hair cells of the cochlea82;
2. Hair cells of the normal vestibular system,83especially the otolith
organs84;
3. Hair cells of the vestibular system after its fluid dynamics have been disrupted by infrasound82;
4. Visceral graviceptors acting as vibration sensors.83
To evaluate these hypotheses, it is useful to review selected aspects of the anatomy and physiology of the inner ear (focusing on the differences between the cochlea and the vestibular organs), vibrotactile sensitivity to airborne sound, and the types of evidence that, while absent at present, could in theory support one or more of these hypotheses.
How the Inner Ear Works
The inner ear contains the cochlea (the organ of hearing) and five vestibular organs (three semicircular canals and two otolith or-gans, transmitting information about head position and movement). The cochlea and the vestibular organs have one important feature in common—they both use hair cells to convert sound or head move-ment into nerve impulses that can then be transmitted to the brain. Hair cells are mechanoreceptors that can elicit nerve impulses only when their stereocilia (or sensory hairs) are bent.
The anatomy of the cochlea ensures that its hair cells respond well to airborne sound and poorly to head movement, whereas the anatomy of the vestibular organs optimizes hair cell response to head movement and minimizes response to airborne sound. Specifically, the cochlear hair cells are not attached to the bony otic capsule, and the round window permits the cochlear fluids to move more freely when air-conducted sound causes the stapes to move back and forth in the oval window. Conversely, the vestibular hair cells are attached to the bony otic capsule, and the fluids surrounding them are not positioned between the two windows and thus cannot move as freely in response to air-conducted sound. At the most basic level, this makes it unlikely that inaudible sound from wind turbines can affect the vestibular system.