Manuscript version: Author’s Accepted Manuscript
The version presented in WRAP is the author’s accepted manuscript and may differ from the published version or Version of Record.
Persistent WRAP URL:
http://wrap.warwick.ac.uk/107977 How to cite:
Please refer to published version for the most recent bibliographic citation information. If a published version is known of, the repository item page linked to above, will contain details on accessing it.
Copyright and reuse:
The Warwick Research Archive Portal (WRAP) makes this work by researchers of the University of Warwick available open access under the following conditions.
Copyright © and all moral rights to the version of the paper presented here belong to the individual author(s) and/or other copyright owners. To the extent reasonable and
practicable the material made available in WRAP has been checked for eligibility before being made available.
Copies of full items can be used for personal research or study, educational, or not-for-profit purposes without prior permission or charge. Provided that the authors, title and full
bibliographic details are credited, a hyperlink and/or URL is given for the original metadata page and the content is not changed in any way.
Publisher’s statement:
Please refer to the repository item page, publisher’s statement section, for further information.
For Peer Review
Source Method Biases as Implicit Personality Theory at the Domain and Facet Levels
Journal: Journal of Personality Manuscript ID JOPY-18-0089.R2 Manuscript Type: Original Manuscript Date Submitted by the Author: 28-Aug-2018
Complete List of Authors: McCrae, Robert
Mõttus, René; University of Edinburgh, Department of Psychology; University of Tartu, Institute of Psychology
Hrebickova, Martina; Czech Academy of Sciences, Institute of Psychology Realo, Anu; University of Tartu, Psychology; University of Warwick, Psychology
Allik, Jüri; University of Tartu, Institute of Psychology; Estonian Academy of Sciences
Keywords: measurement error, personality structure, cross-cultural, multi-method assessment
For Peer Review
Source Method Biases as Implicit Personality Theory at the Domain and Facet Levels
Robert R. McCrae,1 René Mõttus,2, 3 Martina Hřebíčková,4 Anu Realo,3, 5 and Jüri Allik3, 6
1
Gloucester, Massachusetts
2
Department of Psychology, University of Edinburgh
3
Institute of Psychology, University of Tartu
4
Institute of Psychology, Czech Academy of Sciences
5
Department of Psychology, University of Warwick
6
Estonian Academy of Sciences
Correspondence concerning this article should be addressed to Robert R. McCrae, 90 Magnolia Avenue, Gloucester, MA 01930 USA. Email: [email protected]
3 4 5 6 7 8 9 10 11 12 13 14 15 16 17 18 19 20 21 22 23 24 25 26 27 28 29 30 31 32 33 34 35 36 37 38 39 40 41 42 43 44 45 46 47 48 49 50 51 52 53 54
For Peer Review
AbstractObjectives
We tested predictions about the structure and magnitude of method biases in single-source personality trait assessments. We expected a large number of distinct biases that would parallel the observed structure of traits, at both facet and item levels.
Method
We analyzed multi-method ratings on the Estonian NEO Personality Inventory-3 in a sample of 3,214 adults. By subtracting informant ratings from self-reports we eliminated true score variance and analyzed the size and structure of the residual method biases. We replicated analyses using data (N = 709) from the Czech Revised NEO Personality Inventory.
Results
The magnitude of method biases was consistent with predictions by McCrae (2018). Factor analyses at the facet level showed a clear replication of the normative Five-Factor Model structure in both samples. Item factor analyses within domains showed that facet-level method biases mimicked the facet structure of the instrument.
Conclusions
Method biases apparently reflect Implicit Personality Theory (IPT)—beliefs about how traits and trait indicators covary. We discuss the (collective) accuracy and possible origins of IPT. Because method biases limit the accuracy of single-source assessments, we recommend assessments that combine information from two or more informants.
3 4 5 6 7 8 9 10 11 12 13 14 15 16 17 18 19 20 21 22 23 24 25 26 27 28 29 30 31 32 33 34 35 36 37 38 39 40 41 42 43 44 45 46 47 48 49 50 51 52 53 54
For Peer Review
Keywords: Measurement error, personality structure, cross-cultural, multi-method assessment
Source Method Biases as Implicit Personality Theory at the Domain and Facet Levels Personality traits are hierarchically organized, with broad domains, narrower facets, and, at the item level, very specific nuances (McCrae, 2015). McCrae (2018) has argued that the same hierarchical structure is found for method biases: In a single-source personality assessment (e.g., a self-report or an observer rating) the observed score is due not only to trait level and random error of measurement, but also to systematic biases on the domain, facet, and (perhaps) nuance level. The domain-level method biases, MD, affect all the facets in a single domain; the
facet-level method biases, M, affect all the items in a facet scale.
Method biases refer to any systematic sources of error associated with the measurement of a trait. In this article, the term is used specifically to refer to consistent and enduring over- or underestimates of trait level made by a single respondent when rating a single target. If Mary believes Mark is highly anxious, it will be reflected in her responses to all items in an anxiety scale whenever she is asked to rate him. If in truth Mark is only moderately anxious, Mary’s ratings are biased. Biases contribute to internal consistency and retest reliability estimates, but not to agreement between independent raters. Some biases, such as social desirability, might affect a wide range of traits; in this article we are concerned with biases that are specific to a single domain or facet.
Evidence for the existence of MD is provided by a long history of research on Implicit
Personality Theory (IPT; Borkenau, 1992). Passini and Norman (1966) asked judges to rate the personality traits of complete strangers; factor analysis of these ratings yielded a version of what would come to be known as the Five-Factor Model (FFM). Apparently people must have some idea of which traits covary.1 If they imagine a target is high in anxiety, they will also tend to 3 4 5 6 7 8 9 10 11 12 13 14 15 16 17 18 19 20 21 22 23 24 25 26 27 28 29 30 31 32 33 34 35 36 37 38 39 40 41 42 43 44 45 46 47 48 49 50 51 52 53 54
For Peer Review
believe the target must be high in self-consciousness and depression; they have an implicit notion of the Neuroticism domain. Different implicit assumptions contribute to separate factors for imagined Extraversion, Openness, Agreeableness, and Conscientiousness.
McCrae, Jang, Livesley, Riemann, and Angleitner (2001) demonstrated the existence of MD in real personality assessments. They examined two intercorrelation matrices for the 30
facets of the Revised NEO Personality Inventory (NEO-PI-R; Costa & McCrae, 1992a). The first was a mono-method matrix based on self-reports from one sample; the second was a hetero-method matrix in which self-reports were correlated with spouse ratings in a different sample. Mono-method correlations were larger than hetero-method correlations, because the former reflected the influence of both true scores and method biases, whereas the latter reflected only the influence of true scores (assuming that targets and their raters did not share method biases). Subtracting the hetero-method matrix from the mono-method matrix left a residual matrix, ∆R, which represented pure method bias.2 When ∆R was factored, clear Neuroticism, Agreeableness, and Conscientiousness factors were found, and weak Extraversion and Openness factors. Method biases in these data correspond to what is termed MD in the present article.
In the present paper we first replicate this finding, using a stronger research design. In McCrae, Jang, and colleagues (2001), mono- and hetero-method intercorrelation matrices were based on different samples, because observer ratings were not available for the sample of chief interest. In the present study, both self-reports and observer ratings are available for the same sample. This means that there are two different ways of estimating MD. The first way is to factor
the difference between intercorrelation matrices, ∆R (as in McCrae, Jang, et al., 2001). (In these analyses, the mono-method matrix is the mean of self-report and informant rating matrices; the hetero-method matrix is the mean of self-by-informant and informant-by-self matrices). The 3 4 5 6 7 8 9 10 11 12 13 14 15 16 17 18 19 20 21 22 23 24 25 26 27 28 29 30 31 32 33 34 35 36 37 38 39 40 41 42 43 44 45 46 47 48 49 50 51 52 53 54
For Peer Review
second is to subtract the observer rating from the self-report for each individual, and factor these difference scores.3 We will designate the matrix of intercorrelations of facet difference scores (self-reports minus observer ratings) as R∆. The second approach should be a more accurate indicator of the structure of MD, much as a paired test is more powerful than an independent
t-test with the same N.
To our knowledge, no one has reported an analysis of the structure of facet-level method bias, which might be considered an investigation of IPT at the facet level. Each domain in the NEO Inventories is composed of six related but distinct facets, and each facet is assessed by eight items. The mono-method correlations among items from a single facet (say, the eight N1: Anxiety items) result from three sources of variance: The anxiety true score, the facet-specific method bias, MFi, unique to the 8 anxiety items, and the domain-level method bias, MD, which is
common to all 48 Neuroticism items. Together, the two method biases constitute the total method bias for the facet: M = MD + MFi, as discussed in McCrae (2018).
As with MD, the structure of M can be estimated either by subtracting the hetero-method
item correlations from the mono-method correlations to generate ∆RI matrices for each of the
five domains, or by creating item difference scores (self-reports minus informant ratings) and intercorrelating them to yield five RI∆ matrices. We will focus on the structure of method biases
in the items within each domain by factoring RI∆s.
The primary analyses for this article are based on data from an Estonian sample; as a check on replicability and generalizability across cultures, we also examine Czech data. Assumptions, Predictions, and Analyses
Assumptions. The analyses of multi-method empirical data reported in McCrae (2018) used a model of the components of variance in personality trait scales and a set of simplifying 3 4 5 6 7 8 9 10 11 12 13 14 15 16 17 18 19 20 21 22 23 24 25 26 27 28 29 30 31 32 33 34 35 36 37 38 39 40 41 42 43 44 45 46 47 48 49 50 51 52 53 54
For Peer Review
assumptions. The components considered were the true score, systematic bias unique to an individual source, and random error. Those analyses divided true score into components at different levels of the trait hierarchy, but for the present purpose we will combine them. We define the true score as variance that is common to assessments from two independent but well-informed observers (e.g., a self-report and a rating by a spouse, close friend, parent, or child). This presumes that, across a range of traits, different single sources are equally valid. (Ratings aggregated across multiple raters should be more valid than single ratings.)
This assumption is central to some aspects of the present article, because it implies that self-reports and informant ratings contain the same quantity of true score variance. ∆R will consist solely of systematic bias and random error—if this assumption is true. There are data consistent with this claim: Peer/peer correlations are comparable in magnitude to peer/self
correlations (Funder, Kolar, & Blackman, 1995; McCrae & Costa, 2010); single peer ratings tend to show comparable validities to self-reports in the prediction of behavioral criteria (Kolar, Funder, & Colvin, 1996; Vazire & Mehl, 2008); and self-reports and spouse ratings have similar longitudinal stability (Costa & McCrae, 1988).
We also assume that both self-reports and informant ratings have similarly structured and quantitatively equal method bias components; this implies also that they have equal amounts of random error. Further, we assume that the same proportion of the different components of variance is found in all items, in all facets, and in all domains. Although in fact there are systematic differences (see McCrae, Kurtz, Yamagata, & Terracciano, 2011, for differences on the facet level), they are relatively small and should not affect the general conclusions drawn here.
If the proportion of true score variance in self-reports and informant ratings is identical, 3 4 5 6 7 8 9 10 11 12 13 14 15 16 17 18 19 20 21 22 23 24 25 26 27 28 29 30 31 32 33 34 35 36 37 38 39 40 41 42 43 44 45 46 47 48 49 50 51 52 53 54
For Peer Review
then subtracting informant ratings from self-reports should eliminate true score variance and yield difference scores that consist only of method bias and random error. However, this will only be true if the total variance is the same for both sources. We therefore standardize all facet scales and items as z-scores prior to calculating the difference scores on which R∆ and RI∆ are
based.
As a reviewer noted, even if self-reports and informant ratings in general have equal quantities of true score variance, this will not necessarily be the case for individual targets. An observer rating may be based on insufficient information about the target; a self-report may be compromised by a lack of insight. Whenever the two sources differ in the validity of their scores, subtracting will not totally eliminate the true score component, and R∆ and RI∆ will be
“contaminated” to some degree by true score variance. This in turn implies that the factor structures of R∆ and RI∆ is not determined entirely by method variance.
However, given that most of the informants used in the present study are family members or partners who know the target well, it seems plausible that their ratings will be accurate and the difference between the validity of observer ratings and self-reports will probably be quite small for the great majority of targets. This suggests that the factor structures of R∆ and RI∆ will be
determined primarily by method biases.
Note also that this problem does not affect analyses of ∆R and ∆RI (where a
hetero-method matrix is subtracted from a mono-hetero-method matrix), because these depend only on the variance in the sample as a whole. To the extent that the structures of R∆ and RI∆ resemble those
of ∆R and ∆RI, we can conclude that both represent the same structure of method biases.
Predictions. We offer both qualitative and quantitative predictions. The qualitative predictions are straightforward: When we factor the 30 facet differences, we expect to find the 3 4 5 6 7 8 9 10 11 12 13 14 15 16 17 18 19 20 21 22 23 24 25 26 27 28 29 30 31 32 33 34 35 36 37 38 39 40 41 42 43 44 45 46 47 48 49 50 51 52 53 54
For Peer Review
standard FFM structure of the NEO Inventories (McCrae & Costa, 2010); when we factor the 48 item differences within each domain, we expect the factors will correspond to the a priori facet scales. If these hypotheses are confirmed, they will support the view that method biases mimic the hierarchical structure of traits.
However, previous research has also suggested that method bias can be quantified. McCrae (2018) used American data on the mono-method correlations among personality traits within a domain and on cross-observer agreement on domains and facets to estimate the value of MD at .17 (that is, 17% of facet score variance). It is possible to test that prediction using an
entirely different method of analysis in the present dataset. Consider the intra-domain cross-facet correlations (e.g., N1: Anxiety with N2: Angry Hostility). Within each of the five domains there are 15 pairs of facets, so we are concerned with the values for 75 correlations. In mono-method data, these are due to shared domain-level true score variance (e.g., Neuroticism) as well as shared domain-level method bias, MD. In hetero-method data (e.g., self-reported N1: Anxiety
with observer rated N2: Angry Hostility) they are due only to domain-level true score variance. The mean of the differences between mono-method and hetero-method intra-domain, cross-facet correlations in ∆R is an estimate of MD. If the model holds, and if American findings generalize to the present Estonian and Czech data, we would expect the mean value of the 75 relevant entries in ∆R to be about .17.
When analyses are conducted at the individual level (examining the correlations among difference scores for individual targets), a different value is predicted for the observed
correlations. Each facet is composed of true score, MD, and error (both random and systematic at
the item level). McCrae (2018) estimated that these three account for 41%, 17%, and 42% of the variance, respectively. Because, ex hypothesi, the same amount of true score is found in self-3 4 5 6 7 8 9 10 11 12 13 14 15 16 17 18 19 20 21 22 23 24 25 26 27 28 29 30 31 32 33 34 35 36 37 38 39 40 41 42 43 44 45 46 47 48 49 50 51 52 53 54
For Peer Review
reports and observer ratings, (almost) all true score variance is removed when the scores are subtracted, and the difference scores consist solely of MD and error. The value of the 75 relevant
entries in R∆ should thus be MD / (MD + error) = .17 / (.17 + .42) = .29. Because .29 is
substantially larger than .17, factoring R∆ is likely to yield a clearer structure than factoring ∆R. It is also possible to test quantitative predictions about facet-level method bias, M, by examining individual items. McCrae (2015) used a meta-analysis of American and international data on the internal consistency, retest reliability, and cross-observer agreement for facets to estimate mean M at .13 for individual items. Here we assess M with a different approach: by analyzing intra-facet, cross-item correlations (e.g. N1: Anxiety Item 1 with N1: Anxiety Item 2).
Within each of the 30 facets there are 28 pairs of items, so we are concerned with the values for 840 correlations. In mono-method data, these are due to shared facet-level true score variance (e.g., Anxiety) as well as shared facet-level method bias, M. In hetero-method data they are due only to facet-level true score variance. The mean of the 840 relevant entries in the five ∆RI
matrices thus is an estimate of M. If the model holds and if findings generalize to the present samples, we would expect a mean value of about .13.
Each individual item score is composed of true score, M, and error. McCrae (2015) estimated that these three account for 36%, 13%, and 51% of the item variance, respectively. The difference scores consist almost entirely of M and error, and the value of the 840 relevant entries in RI∆ should thus be M / (M + error) = .13 / (.13 + .51) = .20.
The assumption that source method bias is shaped by IPT does not rule out the possibility that higher-order biases, such as social desirability, may also influence observed structure. We consider this possibility by examining the relative magnitude of the first eigenvalue in different matrices. Evaluative bias would tend to inflate the first unrotated factor relative to the other 3 4 5 6 7 8 9 10 11 12 13 14 15 16 17 18 19 20 21 22 23 24 25 26 27 28 29 30 31 32 33 34 35 36 37 38 39 40 41 42 43 44 45 46 47 48 49 50 51 52 53 54
For Peer Review
factors.Analyses. ∆R and ∆RIs are calculated as the mean of the two mono-method correlation
matrices (self-reports and informant ratings) minus the mean of the two hetero-method correlation matrices (self-reports × informant ratings and informant ratings × self-reports). Diagonal values are fixed at 1.0.
To examine the structure of domain-level method bias,4 we extract five principal components from ∆R and R∆. We examine varimax-rotated factors and their congruence with the normative NEO-PI-R structure (Costa & McCrae, 1992a). As is customary with replications of the NEO Inventory structure (e.g., McCrae, Terracciano, & 78 Members, 2005), we then perform a Procrustes rotation to maximize alignment of the factors with the normative target; we report congruence coefficients of these re-rotated factors with the normative structure.
To examine the structure of facet-level method bias, we extract six principal components from RI∆ for each domain. No normative item-level structure has been published for the NEO
Inventories, so a different method must be used to evaluate the optimal fit of the observed factors to the a priori facet structure (cf. McCrae & Costa, 2008). Using data from individual
respondents, we calculate method facet scores by subtracting standardized informant facet scores from the corresponding self-report scores (as for the creation of R∆). We then calculate method item factor scores for each varimax-rotated factor from RI∆ and correlate these with the method
facet scores; this allows us to determine the convergent and discriminant validity of the varimax factors in relation to the a priori facets.
But item analyses are often distorted by acquiescent responding, which inflates
correlations between like-keyed items and attenuates correlations between unlike-keyed items (McCrae, Herbst, & Costa, 2001). This in turn can distort the factor structure, because factors 3 4 5 6 7 8 9 10 11 12 13 14 15 16 17 18 19 20 21 22 23 24 25 26 27 28 29 30 31 32 33 34 35 36 37 38 39 40 41 42 43 44 45 46 47 48 49 50 51 52 53 54
For Peer Review
will tend to be defined, at least in part, by items keyed in the same direction, regardless of content. To minimize these effects, we rotate the method item factors to maximize their convergent and discriminant validity with the a priori method facets (McCrae & Costa, 1989). Because the facets are balanced to control for the effects of acquiescence, the item factors that maximally correlate with them will also be relatively free from acquiescence effects.
As noted above, analyses of RI∆ may be influenced to some degree by residual true score
variance, whereas analyses of ∆RI should not be. We therefore also calculated the convergent
and discriminant validity of method item factors using factor scores based on the factor structure of ∆RI. Strong convergent correlations will demonstrate that method item factors replicate the
item structure of NEO Inventory domains.
Targeted rotations are a form of confirmatory factor analysis, and because orthogonal rotations are used, there is little opportunity to capitalize on chance (McCrae, Zonderman, Costa, Bond, & Paunonen, 1996). Because they yield the optimal fit within the data, they are
particularly useful as a way to falsify hypotheses.
Method Samples
Estonian participants constituted a subset of the Estonian Biobank cohort study, a volunteer-based sample of the Estonian resident adult population, recruited by general practitioners and hospital staff and using other means (for details see Leitsalu et al., 2014; personality data were integrated only into the last phase of the study). Each participant signed an informed consent form. This study uses data from 3,214 cohort members (aged 18-91 yrs., M = 46.48, SD = 17.00; 1,895 women) for whom both personality self-reports and informant-ratings 3 4 5 6 7 8 9 10 11 12 13 14 15 16 17 18 19 20 21 22 23 24 25 26 27 28 29 30 31 32 33 34 35 36 37 38 39 40 41 42 43 44 45 46 47 48 49 50 51 52 53 54
For Peer Review
were available and complete.5 Most informants were a spouse/partner (45%), family member (29%) or friend (15%).
The Czech sample, described in McCrae and colleagues (2004), comprised 709
participants (aged 15 to 81, M = 36.03, SD= 14.02, age unknown for 9 participants; 294 men) for whom both complete self- and informant-ratings were available. The informants were often the participants’ partners (also aged between 15 and 81 with a mean of 36.10 years; 298 of the informants were men).
Measure
In the Estonian data, participants and their knowledgeable informants completed the Estonian version of the NEO Personality Inventory-3 (NEO-PI-3; McCrae & Costa, 2010). The NEO-PI-3 has 240 items that measure 30 personality facets, which are then grouped into the five FFM domains, each including six facets consisting of eight items. The items were answered on a five-point Likert scale (0 = false/strongly disagree to 4 = true/strongly agree). For cross-rater correlations, see Mõttus and colleagues (2014). In the Czech data, self- and informant-ratings were provided using the self- and informant-report version of the Czech translation of the NEO-PI-R (Hřebíčková, 2004).
Results and Discussion Point Predictions
We estimated that domain-level method variance in facet scales, MD, should account for
about 17% of the total facet variance. In the present data we calculated this as the mean intra-domain cross-facet correlation in ∆R. In the Estonian sample, observed values ranged from .11 for Openness to .24 for Conscientiousness, with a mean of .18 (.17 in the Czech sample), close to 3 4 5 6 7 8 9 10 11 12 13 14 15 16 17 18 19 20 21 22 23 24 25 26 27 28 29 30 31 32 33 34 35 36 37 38 39 40 41 42 43 44 45 46 47 48 49 50 51 52 53 54
For Peer Review
the predicted value of .17. The corresponding value in R∆ was predicted to be .29; that value represents the ratio of domain-level method variance to method variance plus error. The
observed values ranged from .22 for Openness to .45 for Conscientiousness, with a mean of .35 (.33 in the Czech sample). The observed mean value of .35 is appreciably larger than the
predicted value of .29, but the difference can readily be accounted for. The prediction was based on calculations by McCrae (2018) that estimated cross-observer agreement on facets from data that included both peers (friends and co-workers) and family members (spouses and siblings). Peers show substantially less agreement with self-reports than do family members, yielding an overall average agreement of .41. In the present sample, most informants were spouses or other family members, and the mean cross-observer agreement was .49—exactly the figure found for self/spouse correlations in the American data (McCrae, 2018). Subtracting this true score component leaves .51, and the predicted mean value in R∆ becomes .18 / .51 = .35, the value observed.
We estimated that method variance in individual items, M, should account for about 13% of the total item variance. In the present data we calculated this as the mean intra-facet cross-item correlation difference in ∆RI. Observed values ranged from .08 for E5: Excitement Seeking
to .20 for A5: Modesty, with a mean of .13 (.12 in the Czech data), as predicted. The corresponding value in RI∆ was predicted to be .20; that value represents the ratio of facet
method variance to method variance plus error. The observed means ranged from .13 for A4: Compliance to .27 for A5: Modesty, with a mean of .18 (.17 in the Czech data). Predictions about the quantity of method bias were largely supported.
3 4 5 6 7 8 9 10 11 12 13 14 15 16 17 18 19 20 21 22 23 24 25 26 27 28 29 30 31 32 33 34 35 36 37 38 39 40 41 42 43 44 45 46 47 48 49 50 51 52 53 54
For Peer Review
All cross-method cross-facet and cross-item correlations (the true structure of facet and item correlations) as well as ∆R, R∆, ∆RI, and RI∆ for both Estonian and Czech data are
available at the Open Science Framework repository (https://osf.io/xdjpw). The Structure of Domain-Level Method Biases
We examined the structure of method biases at the domain level by factoring ∆R and R∆, matrices from which the covariation due to true score had been removed. In the Estonian data, we considered both varimax and targeted rotations of factors from the two matrices. The four sets of factor loadings were almost identical (all factor congruences > .97; all total congruence coefficients = .99), except that loadings from the analysis of ∆R were smaller in absolute magnitude: The five factors accounted for 35.6% of the variance in ∆R, but 53.1% in R∆. The fact that the factor structure of R∆ parallels that of ∆R suggests that the structure is not due solely to residual true score variance in R∆.
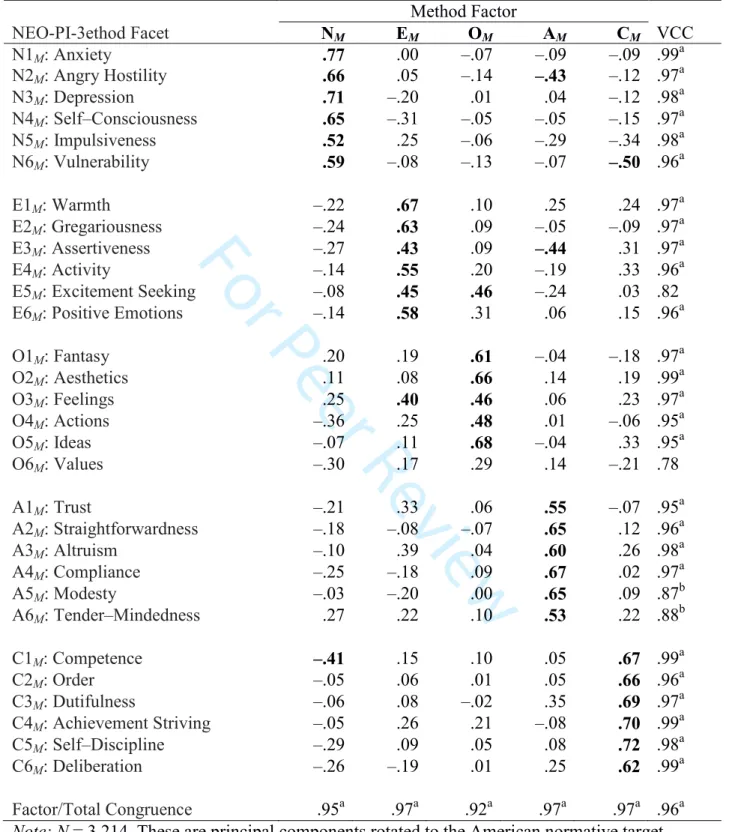
When compared to the American normative structure, all four solutions showed factor congruences > .92 and total congruences > .95. We illustrate results in Table 1, which provides the factor structure of R∆ rotated to the American normative structure. Factor and total
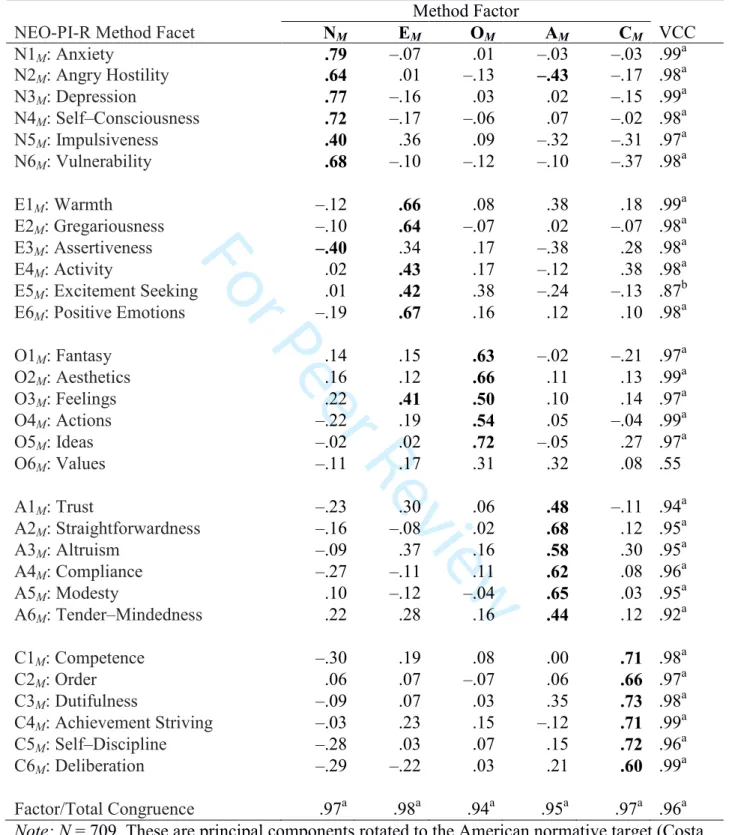
congruence coefficients are all > .92, supporting the hypothesis that the structure of method biases mimics the structure of personality traits. Table 2 reports the corresponding analysis in the Czech sample; here all factor congruences are > .94.
Although the results reported in Tables 1 and 2 closely resemble the usual factor structure of the NEO Inventories, it is essential to recall that they are the structure of biases, not
substantive traits. To highlight that difference, variable and factor labels include a subscripted M. Most of the facets in Table 1 show large variable congruence coefficients (VCCs;
McCrae et al., 1996), all but two exceeding chance. Nevertheless, it is instructive to consider the 3 4 5 6 7 8 9 10 11 12 13 14 15 16 17 18 19 20 21 22 23 24 25 26 27 28 29 30 31 32 33 34 35 36 37 38 39 40 41 42 43 44 45 46 47 48 49 50 51 52 53 54
For Peer Review
two worst fitting items, E5M: Excitement Seeking and O6M: Values. E5M: Excitement Seeking
has a much larger loading on OM (λ = .46; .38 in the Czech sample) than it does in the American
target matrix (λ = .11), and O6M: Values is a poor definer of the OM factor (λ =.29; .31 in the
Czech data) in this analysis. Does this imply that, for some reason, method bias structure
deviates from the true score factor structure for these two traits, or does it mean that these scales operate somewhat differently in an Estonian sample and translation? With respect to E5:
Excitement Seeking, an examination of the varimax structure of the mono-method matrices favors the latter interpretation. In Estonian data, Excitement Seeking has a substantial loading on the O factor in both self-reports (λ =.39; .28 in Czech data) and informant ratings (λ =.38; .30 in Czech data). These facts suggest that Estonian method biases faithfully mimic the structure of the Estonian NEO-PI-3, which in turn replicates the American structure well, though not perfectly.
The case is different with Openness to Values. It is a reasonably good definer of the Openness factor in both self-reports (λ =.63; .47 in Czech data), and informant ratings (λ =.44; .53 in Czech data). Yet the variable congruence coefficient of the associated method facet scale, VCC = .78, is not beyond chance in Estonian data, and an even worse fit to the target in the Czech data (VCC = .55). Further, there is little agreement between the Estonian and Czech factor loadings for this variable, VCC = .70. In Estonian data, O6M: Values shows a strong negative
secondary loading on the NM factor; in Czech data, it loads most strongly on AM. In truth, O6:
Values is a clear definer of Openness, but this is apparently not reflected in the implicit understanding of the trait.
We had anticipated that the structure of R∆ would be appreciably clearer than the structure of ∆R, when in fact they were equally clear replications of the normative structure. 3 4 5 6 7 8 9 10 11 12 13 14 15 16 17 18 19 20 21 22 23 24 25 26 27 28 29 30 31 32 33 34 35 36 37 38 39 40 41 42 43 44 45 46 47 48 49 50 51 52 53 54
For Peer Review
Presumably this is a function of the large sample size: With data from over 6,000 respondents, even small correlations will yield a robust structure.
We have said that domain-level method biases mimic the structure of personality traits, but what we have in fact demonstrated is that they mimic the structure of observed data—in this case, self-reports of Americans—which is shaped by both true scores and method biases. Is it possible that the true score structure is itself different from the observed structure? It could not be greatly different; if it were, the combination of true score and method biases would yield an observed structure that differed from the method structure. In the present data, the true score structure can be estimated directly from an analysis of the hetero-method correlation matrix, and congruences between varimax factors of that matrix and the normative structure all exceed .95 (.94 to .97 in the Czech data). The structures of true scores, method biases, and observed scores are all essentially the same at the domain level.
Although the structure of method biases is the same as the structure of true scores, the biases themselves are of course completely different. The biases in self-reports are statistically as well as conceptually independent of true scores, but also of the biases in informant ratings. Two raters of a target agree just to the extent they share true score variance; they differ because of both source method bias and random error. Summing two ratings of a target aggregates and enhances true score, but not bias.
Evaluative Bias
A general evaluative bias contrasting unfavorable with favorable traits might be expected to contribute to the first unrotated factor (contrasting Neuroticism with the other four domains). A reviewer suggested that we examine the magnitude of the first eigenvalue as a proportion of the total variance explained by the five factors. If evaluative bias contributes to method variance, 3 4 5 6 7 8 9 10 11 12 13 14 15 16 17 18 19 20 21 22 23 24 25 26 27 28 29 30 31 32 33 34 35 36 37 38 39 40 41 42 43 44 45 46 47 48 49 50 51 52 53 54
For Peer Review
the first factor should be largest in R∆, which contains only method bias and error; smaller in the two mono-method matrices, where the structure is determined by both true score and method bias; and smallest in the hetero-method matrix, which excludes method bias. For all these matrices, parallel analysis suggested five factors (eigenvalues are reported in the Open Science Framework repository). As predicted, in the Estonian data the first unrotated factor accounted for 43% of the explained variance in R∆; 37% and 38% in the self-report and informant rating matrices, respectively; and 33% in the hetero-method matrix. The corresponding values in the Czech data were 40%, 33%, 31%, and 29%. These data are consistent with the hypothesis that, in addition to IPT, a general evaluative bias contributes to the domain-level structure.
The Structure of Facet-level Method Biases
For each of the five domains, we factored RI∆ and calculated factor scores for six
varimax-rotated factors. We then correlated these factor scores with the six a priori method facet scores. Of these 180 correlations, 170 (94%) were positive, reflecting the effect of MD on all 48
items in a domain. Yet facet-specific method biases, MFi, were demonstrated by the convergent
and discriminant validity of method item factors within each domain. Using a correlation of .70 as a criterion, we found that 22 of the 30 method item factors (19 in the Czech data) showed a one-to-one correspondence with one of the a priori method facets.
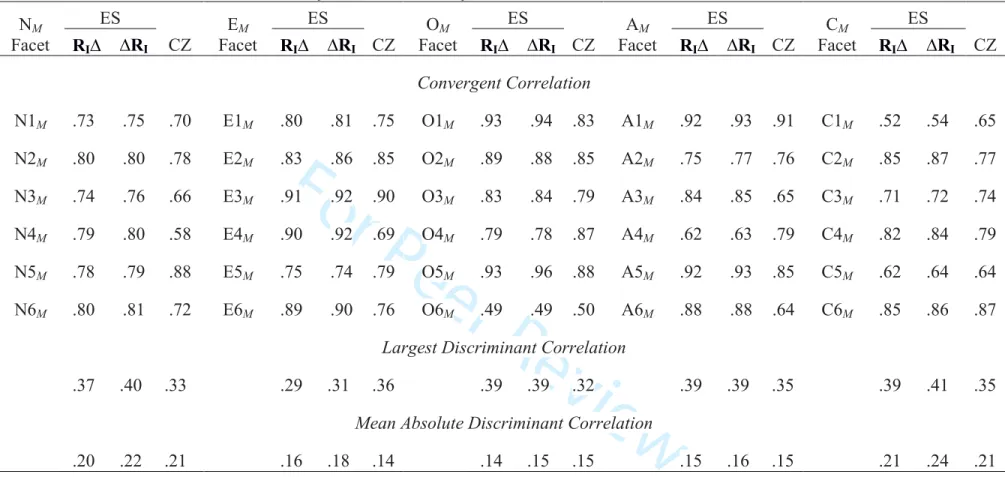
We then rotated the item factors to maximally correlate with the method facet scores, and again examined their convergent and discriminant validity. In this solution, 178 of the 180 correlations (99%) were positive (170 [94%] in the Czech data). The first column for each domain in Table 3 reports convergent correlations in the Estonian data. For example, the correlation of the first re-rotated factor with N1M: Anxiety is .73; the correlation of the second
factor with N2M: Angry Hostility is .80. Convergent correlations ranged from .49 for the
3 4 5 6 7 8 9 10 11 12 13 14 15 16 17 18 19 20 21 22 23 24 25 26 27 28 29 30 31 32 33 34 35 36 37 38 39 40 41 42 43 44 45 46 47 48 49 50 51 52 53 54
For Peer Review
problematic O6M: Values to .93 for O1M: Fantasy and O5M: Ideas. The mean convergent
correlation was .80; by comparison, the mean convergent correlation in analyses of observed item data was .81 (McCrae & Costa, 2008). No discriminant correlation exceeded .39, and the mean absolute discriminant correlation was .17.
It is possible that these results are attributable, at least in part, to the true score variance that remains in RI∆ when a self-report and an observer rating have different quantities of the true
score component. We therefore factored ∆RI, which avoids this potential problem. We generated
a factor scoring matrix and applied it to the item differences to create method item factor scores. After re-rotating factors to maximize convergent and discriminant validity, we correlated them with method facet scales, as shown in the second column for each domain in Table 3. These values are very similar to those derived from the factor analysis of RI∆, and suggests that the
item structure is indeed determined by facet-level method biases.
Table 3 also reports corresponding analyses for RI∆ in Czech data, again with very
similar results. Clearly, the structure of facet-level method biases closely resembles the a priori (and the observed) item structure.
Sources of Structure in Method Biases
Most directly, this study is a replication in a much larger sample of earlier findings by McCrae, Jang, and colleagues (2001), which showed that domain-level method biases have the structure of the FFM. Beyond generalizing that finding to other languages and cultures (and a revised version of the instrument), the present research also demonstrated that facet-level method biases parallel the empirical structure of items in each domain. People apparently have an IPT at the facet level.
From one perspective there is nothing remarkable about this. The items in each facet 3 4 5 6 7 8 9 10 11 12 13 14 15 16 17 18 19 20 21 22 23 24 25 26 27 28 29 30 31 32 33 34 35 36 37 38 39 40 41 42 43 44 45 46 47 48 49 50 51 52 53 54
For Peer Review
scale—say N1: Anxiety—were selected to represent different manifestations of a single trait. If Mary attributes a high level of anxiety to Mark, it is not surprising that she describes him as very nervous, and very fearful, and very worried about the future. What this means is only that Mary has some conception of anxiety as a trait and some knowledge of how it is expressed. Such knowledge is likely to have come from personal experience in dealing with anxious people, from books or films that depict anxious characters, and from an acquired knowledge of the English (or Estonian, or Czech) language, in which words such as anxious, fearful, and nervous are
synonyms.
The same argument can be made at the domain level. There are semantic similarities between different facets in a domain: A thesaurus (http://www.thesaurus.com/browse/distressed) lists anxious, peeved, and saddened—corresponding to the first three NEO-PI-3 Neuroticism facets—as synonyms for distressed. Just as the lexical hypothesis holds that every trait will have been encoded in a natural language trait name, one might propose a semantic hypothesis, which posits that the associations between different traits will be reflected in the network of semantic similarities of trait terms. In this sense, IPT is internalized with language learning.
What does seem remarkable—even incredible—is that people should have such a comprehensive and detailed conception of human traits that they can make all the fine-grained distinctions that are attested to in the discriminant validities in Table 3, while at the same time recognizing the broader resemblance of facets that constitute a domain. Indeed, Table 1 suggests that they even understand cross-domain associations, such as the secondary loading of E3: Assertiveness on the (low) Agreeableness factor which is consistently found in observed data (McCrae & Costa, 1997). This appears to be a remarkable feat of human cognition, even if it is only implicit. 3 4 5 6 7 8 9 10 11 12 13 14 15 16 17 18 19 20 21 22 23 24 25 26 27 28 29 30 31 32 33 34 35 36 37 38 39 40 41 42 43 44 45 46 47 48 49 50 51 52 53 54
For Peer Review
But the truth is likely somewhat different. Many individuals probably have only a rough idea of how traits covary (Sneed, McCrae, & Funder, 1998). But the factor structure seen in Table 1 draws on the collective knowledge of thousands of individuals, which is surely sufficient to account for its accuracy. The same wisdom of the crowd (Galton, 1907) was seen in a study of stereotypes of age and personality (Chan et al., 2012): When empirical profiles of traits for young, middle-aged, and older adults were correlated with personal age stereotypes from over 3,000 individuals, the mean correlation was a modest .34. But the correlation with the consensual stereotype, in which judgments were averaged across all respondents, was .74. People—
collectively, at least—have a good deal of accurate information about personality traits (cf. Löckenhoff et al., 2013).
It is more difficult from the present data to assess the accuracy of the average individual’s knowledge. We can, however, get some notion by considering sample size, because larger
samples will be needed when individual accuracy is lower. A crowd of thousands is clearly not necessary, because the results of the Czech data, with a sample of hundreds, are almost identical. We conducted further analyses to investigate this issue. From the Estonian sample of 3,124 we created 100 random subsamples, each with 100 cases; factored their R∆s; rotated five factors to the normative structure; and calculated the total congruence coefficients—in other words, we replicated Table 1 with a set of subsamples each of N = 100. We repeated this process with Ns of 200, 300, . . . 1,000. The mean total congruence coefficient increased monotonically with
increasing sample size from .89 for N = 100 to .95 for N = 600, and thereafter remained unchanged. Similarly, we factored RI∆s for 100 random subsamples of N = 100 to N = 1,000
cases, rotated the method item factors to maximize convergent validity with the a priori method facet scales, and calculated the mean of the 30 convergent correlations. These increased from .72 3 4 5 6 7 8 9 10 11 12 13 14 15 16 17 18 19 20 21 22 23 24 25 26 27 28 29 30 31 32 33 34 35 36 37 38 39 40 41 42 43 44 45 46 47 48 49 50 51 52 53 54
For Peer Review
to .79 as N increased (the mean value in Table 3 is .80), and the largest discriminant correlation tended not to exceed .45 even with N = 100.
These analyses demonstrate that accuracy increases with sample size, but they also show that the basic findings of the present paper might have been discovered in much smaller samples; even N = 100 might have sufficed. That in turn implies that the average individual must have a relatively accurate, albeit imperfect, conception of the structure of traits and their indicators. Perhaps this should not be surprising. As long ago as 1975 Jackson showed that undergraduates given a conceptual definition of a trait could write items that validly assessed it. People are serviceable lay trait psychologists.
Sources of Bias
IPT—at the domain and facet levels—can account for the covariation of biases, but it does not account for their origin. We know that if Mary overestimates Mark’s anxiety, she will also tend to overestimate his depression and self-consciousness; but why does she overestimate his anxiety? There are several possibilities. Perhaps she met him at a time when he was worried about an upcoming medical procedure, and her first impression stuck. Perhaps she knows him only from a class in public speaking, a situation that Mark finds particularly threatening. These possibilities show that biases may have some basis in fact, but be overgeneralized across
occasions or situations. In other cases, there may be no empirical basis for the bias at all. Perhaps Mary holds the mistaken belief that ectomorphs like Mark are usually fearful, or perhaps she is an amateur psychologist who attributes hidden anxiety to almost everyone.
Implications for Assessment
The fact that method biases accurately reflect the true structure of personality (at least in aggregated data) should not blind us to the fact that they contribute nothing but error to the
3 4 5 6 7 8 9 10 11 12 13 14 15 16 17 18 19 20 21 22 23 24 25 26 27 28 29 30 31 32 33 34 35 36 37 38 39 40 41 42 43 44 45 46 47 48 49 50 51 52 53 54
For Peer Review
assessment of individuals. The general accuracy of the point predictions in this study lends support to the quantitative estimates of method bias in earlier articles (McCrae, 2015, 2018), suggesting that perhaps 40% of facet variance is attributable to systematic error, so the problem is certainly not trivial. Single-source personality assessments, such as the ubiquitous self-report scales, work as well as they do (Ozer & Benet-Martínez, 2006) because about 40-50% of their variance is due to true score—but they would work much better if we could rid them of method biases.
Psychometricians have known for decades that there are systematic errors in personality assessments, but almost all their efforts have been to assess and control only a handful of biases, especially acquiescence and social desirability (Paulhus & Vazire, 2007). We did find evidence of an effect of evaluative bias (social desirability) in the relative magnitude of eigenvalues in different matrices. But the present study reinforces the conclusion of McCrae (2018) that there are a multitude of other independent biases in every assessment—for the NEO-PI-R there are at least five at the domain level and 30 at the facet level. Even if validity scales worked as a way to control bias (but see Piedmont, McCrae, Riemann, & Angleitner, 2000), it would be necessary to have as many different validity scales as there are substantive scales in an inventory.
Perhaps the only practical way to improve imperfect single-source assessments is to obtain multiple informants and combine their information. Although aggregated ratings do not eliminate method biases, they attenuate their effect, increasing the ratio of true score variance to error, and thus the accuracy of the assessment. The value of aggregating raters has been
demonstrated empirically (e.g., Kolar et al., 1996). Many contemporary personality inventories (see Ashton, de Vries, & Lee, 2017; Soto & John, 2009) offer both self-report and informant rating formats; obtaining and integrating multiple perspectives on a target’s personality can 3 4 5 6 7 8 9 10 11 12 13 14 15 16 17 18 19 20 21 22 23 24 25 26 27 28 29 30 31 32 33 34 35 36 37 38 39 40 41 42 43 44 45 46 47 48 49 50 51 52 53 54
For Peer Review
benefit both clinical assessment (McCrae, 2018) and research (Costa, McCrae, & Löckenhoff, 2018).
Implicit Personality Theory Revisited
We have provided new evidence that single-source personality scale scores include true score, method biases, and random error, and that method biases mimic the hierarchical structure of traits. But is it possible that other models of variance components are also consistent with the observed facts? Consider these possibilities:
• Traits and their structure are illusory (IPT1)
• Traits are real but independent; their higher-order structure is illusory (IPT2)
• Traits are real and lead to shared biases about structure (IPT3)
• In addition to shared biases, there are independent biases with the same structure (IPT4)
When originally proposed, IPT1 was believed to provide a radical alternative to trait
theory: Instead of Allport’s neuropsychic structures, it was argued that traits were mere attributions, and their structure was imposed by processes of person perception in the form of IPT1 (Shweder, 1975). Such an interpretation was consistent with Passini and Norman’s (1966)
data on ratings of strangers, but it was quickly ruled out when Norman and Goldberg (1966) showed consensual validation of trait ratings across informants.
That finding—subsequently replicated hundreds of times—implies that traits must have a true score component, but in itself it does not preclude the possibility that the observed FFM structure is an artifact of IPT2. Perhaps all the true score in each facet scale is unique, unrelated
to the true score of any other trait.6 In this scenario, anxiety and depression are both real, consensually valid traits, but they are unrelated. The observed covariation of anxiety and 3 4 5 6 7 8 9 10 11 12 13 14 15 16 17 18 19 20 21 22 23 24 25 26 27 28 29 30 31 32 33 34 35 36 37 38 39 40 41 42 43 44 45 46 47 48 49 50 51 52 53 54
For Peer Review
depression as definers of a hypothetical Neuroticism factor might be entirely accounted for by method biases shaped by IPT2. This view is compatible with the observed factor structure in both
self-reports and informant ratings, and with the observed cross-observer correlations for individual facets.
But IPT2 would also imply that intra-domain, hetero-method, cross-facet correlations
(e.g., self-reported N1: Anxiety with informant rated N2: Angry Hostility) must be zero, because they share neither method bias nor domain-level true score. This is clearly not the case. Costa and McCrae (1992b) showed that the mean value of these semi-convergent correlations was approximately .20, and, in the present study, they were .18 and .17 in Estonian and Czech data, respectively. When we factored the hetero-method matrix we replicated the normative FFM structure.
We could also have ruled out the hypothesis that IPT2 alone produces the FFM structure
using data comparing properties of facets and domains. Method bias alone might explain why domain scales have higher internal consistency and retest reliability than facet scales—the common method variance is aggregated across a larger number of items. But if all true score variance were unique to facets, summing facets into a domain would not lead to any substantive aggregation, and we would expect the cross-observer agreement and heritability of domains (which depend only on true score) to be the same as that of facets. In fact, they are substantially larger (McCrae, 2018; McCrae & Sutin, 2018), because domain-level true score variance is aggregated.
But there is another possibility. Suppose the true scores of facets are unrelated, but that the human mind perceives them grouped into domains, just as a succession of spots of light is automatically perceived as a moving object. Observers can detect with some accuracy the true 3 4 5 6 7 8 9 10 11 12 13 14 15 16 17 18 19 20 21 22 23 24 25 26 27 28 29 30 31 32 33 34 35 36 37 38 39 40 41 42 43 44 45 46 47 48 49 50 51 52 53 54
For Peer Review
score of each facet; suppose that from these data they construct what might be called pseudo-domain (DPSEUDO) scores as the average of facets grouped by IPT3. For example, a target with
true T-scores of 58, 26, 35, 55, 40 and 50 for the six facets of Neuroticism might be perceived as having a DPSEUDO T-score of (58 + 26 + 35 + 55 + 40 + 50) / 6 = 44. Observers might then take
this value into account in formulating a final estimate of facet scores, which would be a weighted combination of the facet true score (Fi) and DPSEUDO, plus error: Observed facet score = aFi +
bDPSEUDO + cE.
This formula for the components of variance in a single-source rating could account for the mono-method correlations among facets within a domain, which is attributable to the shared component, DPSEUDO. Because different observers of the same target agree on the facet true
scores, they would also agree on DPSEUDO, which might thus be interpreted as a shared bias. This
would imply that the hetero-method, cross-facet correlations (due to shared DPSEUDO across
raters) would be non-zero, which solves the problem that prompted IPT3.
But the pseudo-domain model of IPT3 in turn has a different problem: Not only are
hetero-method cross-facet correlations non-zero; they are identical to the mono-method correlations, because both depend solely on DPSEUDO. We know that the mono-method
correlations are substantially higher, which must be due to a component that differs across observers—the domain-level method bias, MD. IPT4 proposes a better formula for observed facet
scores as aFi + bDPSEUDO + cMD + dE. This formula is almost identical to that used by McCrae
(2018), except that a pseudo-domain term has replaced the true domain term. Both terms are eliminated when informant ratings are subtracted from self-reports, so the substitution does not affect the basic conclusion of this article: Method biases mimic the observed structure of traits. Although both pseudo- and real domain models fit the data examined here, there are at 3 4 5 6 7 8 9 10 11 12 13 14 15 16 17 18 19 20 21 22 23 24 25 26 27 28 29 30 31 32 33 34 35 36 37 38 39 40 41 42 43 44 45 46 47 48 49 50 51 52 53 54
For Peer Review
least two reasons to prefer the real model. First, facets in a single domain tend to have similar patterns of objective correlates, which cannot be explained by IPT4. Worldwide, women score
higher than men on all six facets of Neuroticism (Costa, Terracciano, & McCrae, 2001). Adults score higher than adolescents on all six facets of Agreeableness (McCrae et al., 1999).
Individuals who have used heroin or cocaine are lower on five of the six Conscientiousness facets (Terracciano, Löckenhoff, Crum, Bienvenu, & Costa, 2008). Divergent thinking scores are related only to the Openness domain, and within that domain they are positively related to all six facets (McCrae, 1987). These would be extraordinary coincidences if the facets in a domain were actually unrelated.7 Second, it is easy to account for IPT by assuming that it has been learned (at least collectively) from observation of real associations; on the other hand, it is difficult to imagine why wholly fictitious associations would be shared by people with many different languages and cultures.
One final possibility should be examined. IPT was first proposed to account for the structure of ratings of strangers, which must be created in the mind of the rater. But when people rate themselves or a target whom they know quite well, why not hypothesize that they simply respond to the content of each item, without any reference to assumed patterns of covariation? This model proposes that observed score is composed solely of true score and random error—as in classical theories of test reliability (Lord & Novick, 1968). However, this model would predict that cross-rater agreement would be limited only by unreliability, so cross-rater correlations should equal retest reliability. In fact, a meta-analysis (McCrae et al., 2011) showed that the median cross-observer agreement for NEO Inventory facets was .44, whereas median retest reliability was .82. The substantial difference between these values must be accounted for by stable method biases.
3 4 5 6 7 8 9 10 11 12 13 14 15 16 17 18 19 20 21 22 23 24 25 26 27 28 29 30 31 32 33 34 35 36 37 38 39 40 41 42 43 44 45 46 47 48 49 50 51 52 53 54
For Peer Review
Of course, stable biases might arise from misperceptions of the target. Mary’s first impression of Mark as highly anxious might crystallize into an enduring view of him. Mary might also misperceive Mark’s other traits because of the occasions or contexts in which she formed opinions about these traits. But if these errors were solely a result of occasion or context, they would probably be unrelated to each other, and the factor structure of difference scores would be uninterpretable. Instead, it clearly mimics the FFM. IPT itself does not create biased perceptions, but it structures and guides them. Once Mary has decided that Mark is highly anxious, she automatically tends to view him as high on other facets of Neuroticism.
It is beginning to appear that, given what is known about the properties of traits, the hierarchical model proposed here of true scores, method biases, and error in relatively fixed proportions must be essentially correct. However, many refinements are possible. The
assumption that all traits and all sources show quantitatively equal components of variance is obviously inaccurate; even different categories of informants (e.g., family members vs. peers) show somewhat different amounts of true score variance. Quantifying and explaining the
differences would be useful. There are hints that there are method biases unique to nuances; that hypothesis should be directly investigated. It should be possible to estimate what might be called personal IPTs by analyzing ratings of a series of strangers by a single rater; how closely do such personal IPTs resemble the consensual IPT seen here? Are biases consistent properties of informants across a wide range of targets—what Kenny (1994) called a perceiver effect—or are they unique to each particular combination of rater and target? Single-source method biases are ubiquitous, enduring, and problematic for personality assessment, and merit greater attention than they have yet received.
3 4 5 6 7 8 9 10 11 12 13 14 15 16 17 18 19 20 21 22 23 24 25 26 27 28 29 30 31 32 33 34 35 36 37 38 39 40 41 42 43 44 45 46 47 48 49 50 51 52 53 54
For Peer Review
Declaration of Conflicting InterestsRobert R. McCrae receives royalties on the NEO Inventories.
Funding
The author(s) disclosed receipt of the following financial support for the research, authorship, and/or publication of this article: Martina Hřebíčková was supported by institutional funding (RVO: 68081740) from the Czech Academy of Sciences and by grants 17-14387S and
406/01/1507 from the Czech Science Foundation. Jüri Allik and Anu Realo were supported by institutional research funding (IUT2-13) from the Estonian Ministry of Education and Science. 3 4 5 6 7 8 9 10 11 12 13 14 15 16 17 18 19 20 21 22 23 24 25 26 27 28 29 30 31 32 33 34 35 36 37 38 39 40 41 42 43 44 45 46 47 48 49 50 51 52 53 54
For Peer Review
References
Allik, J., Hřebíčková, M., & Realo, A. (2018). Unusual configurations of personality traits indicate multiple patterns of their coalescence. Frontiers in Psychology, 9(187). doi:10.3389/fpsyg.2018.00187
Ashton, M. C., de Vries, R. E., & Lee, K. (2017). Trait variance and response style variance in the scales of the Personality Inventory for DSM-5 (PID-5). Journal of Personality Assessment, 99, 192-203.
Borkenau, P. (1992). Implicit personality theory and the Five-Factor Model. Journal of Personality, 60, 295-327.
Chan, W., McCrae, R. R., De Fruyt, F., Jussim, L., Löckenhoff, C. E., De Bolle, M., . . .
Terracciano, A. (2012). Stereotypes of age differences in personality traits: Universal and accurate? Journal of Personality and Social Psychology, 103, 1050-1066.
Costa, P. T., Jr., & McCrae, R. R. (1988). Personality in adulthood: A six-year longitudinal study of self-reports and spouse ratings on the NEO Personality Inventory. Journal of
Personality and Social Psychology, 54, 853-863.
Costa, P. T., Jr., & McCrae, R. R. (1992a). Revised NEO Personality Inventory (NEO-PI-R) and NEO Five-Factor Inventory (NEO-FFI) professional manual. Odessa, FL: Psychological Assessment Resources.
Costa, P. T., Jr., & McCrae, R. R. (1992b). Trait psychology comes of age. In T. B. Sonderegger (Ed.), Nebraska Symposium on Motivation: Psychology and aging (pp. 169-204).
Lincoln, NE: University of Nebraska Press.
Costa, P. T., Jr., & McCrae, R. R., & Löckenhoff, C. E. (2018). Personality across the lifespan. Annual Review of Psychology.
3 4 5 6 7 8 9 10 11 12 13 14 15 16 17 18 19 20 21 22 23 24 25 26 27 28 29 30 31 32 33 34 35 36 37 38 39 40 41 42 43 44 45 46 47 48 49 50 51 52 53 54
For Peer Review
Costa, P. T., Jr., Terracciano, A., & McCrae, R. R. (2001). Gender differences in personality traits across cultures: Robust and surprising findings. Journal of Personality and Social Psychology, 81, 322-331.
de Vries, R. E., Realo, A., & Allik, J. (2016). Using personality item characteristics to predict single-item internal reliability, retest reliability, and self-other agreement. European Journal of Personality, 30, 618-636.
Funder, D. C., Kolar, D. W., & Blackman, M. C. (1995). Agreement among judges of personality: Interpersonal relations, similarity, and acquaintanceship. Journal of Personality and Social Psychology, 69, 656-672.
Galton, F. (1907). Vox populi. Nature, 75, 450–451.
Hřebíčková, M. (2004). NEO-PI-R: NEO osobnostní inventář [NEO-PI-R: NEO personality inventory]. Prague: Testcentrum.
Jackson, D. N. (1975). The relative validity of scales prepared by naive item writers and those based on empirical methods of personality scale construction. Educational and
Psychological Measurement, 35, 361-370.
Kenny, D. A. (1994). Interpersonal perception: A social relations analysis. Guilford Press.
Kolar, D. W., Funder, D. C., & Colvin, C. R. (1996). Comparing the accuracy of personality judgments by the self and knowledgeable others. Journal of Personality, 64, 311-337.
Leitsalu, L., Haller, T., Esko, T., Tammesoo, M.-L., Alavere, H., Snieder, H., … Metspalu, A. (2014). Cohort Profile: Estonian Biobank of the Estonian Genome Center, University of Tartu. International Journal of Epidemiology, 44, 1137–1147.
Löckenhoff, C. E., Chan, W., McCrae, R. R., De Fruyt, F., Jussim, L., De Bolle, M., . . .
Terracciano, A. (2014). Gender stereotypes of personality: Universal and accurate? Journal 3 4 5 6 7 8 9 10 11 12 13 14 15 16 17 18 19 20 21 22 23 24 25 26 27 28 29 30 31 32 33 34 35 36 37 38 39 40 41 42 43 44 45 46 47 48 49 50 51 52 53 54
For Peer Review
of Cross-Cultural Psychology, 45, 675-694.Lord, F. M., & Novick, M. R. (1968). Statistical theories of mental test scores. Reading MA: Addison-Welsley.
McCrae, R. R. (1987). Creativity, divergent thinking, and Openness to Experience. Journal of Personality and Social Psychology, 52, 1258-1265.
McCrae, R. R. (2015). A more nuanced view of reliability: Specificity in the trait hierarchy. Personality and Social Psychology Review, 19, 97-112.
McCrae, R. R. (2018). Method biases in single-source personality assessments. Psychological Assessment.doi: org/10.1037/pas0000566
McCrae, R. R., & Costa, P. T., Jr. (1989). Rotation to maximize the construct validity of factors in the NEO Personality Inventory. Multivariate Behavioral Research, 24, 107-124
McCrae, R. R., & Costa, P. T., Jr. (1997). Personality trait structure as a human universal. American Psychologist, 52, 509-516.
McCrae, R. R., & Costa, P. T., Jr. (2008). Empirical and theoretical status of the Five-Factor Model of personality traits. In G. J. Boyle, G. Matthews, & D. H. Saklofske (Eds.), Sage handbook of personality theory and assessment (Vol. 1, pp. 273-294). Los Angeles: Sage McCrae, R. R., & Costa, P. T., Jr. (2010). NEO Inventories professional manual. Odessa, FL:
Psychological Assessment Resources.
McCrae, R. R., Costa, P. T., Jr., de Lima, M. P., Simões, A., Ostendorf, F., Angleitner, A., . . . Piedmont, R. L. (1999). Age differences in personality across the adult lifespan: Parallels in five cultures. Developmental Psychology, 35, 466-477.
McCrae, R. R., Costa, P. T., Jr., Hřebíčková, M., Urbánek, T., Martin, T. A., Oryol, V. E., Rukavishnikov, A., & Senin, I. G. (2004). Age differences in personality traits across 3 4 5 6 7 8 9 10 11 12 13 14 15 16 17 18 19 20 21 22 23 24 25 26 27 28 29 30 31 32 33 34 35 36 37 38 39 40 41 42 43 44 45 46 47 48 49 50 51 52 53 54
For Peer Review
cultures: Self-report and observer perspectives. European Journal of Personality, 18, 143-157.
McCrae, R. R., Herbst, J. H., & Costa, P. T., Jr. (2001). Effects of acquiescence on personality factor structures. In R. Riemann, F. M. Spinath, & F. Ostendorf (Eds.), Personality and temperament: Genetics, evolution, and structure (pp. 217-231). Berlin: Pabst Science Publishers.
McCrae, R. R., Jang, K. L., Livesley, W. J., Riemann, R., & Angleitner, A. (2001). Sources of structure: Genetic, environmental, and artifactual influences on the covariation of personality traits. Journal of Personality, 69, 511-535.
McCrae, R. R., Kurtz, J. E., Yamagata, S., & Terracciano, A. (2011). Internal consistency, retest reliability, and their implications for personality scale validity. Personality and Social Psychology Review, 15, 28-50.
McCrae, R. R., & Sutin, A. R. (2018). A Five-Factor Theory perspective on causal analysis. European Journal of Personality. doi: org/10.1002/per.2134
McCrae, R. R., Terracciano, A., & 78 Members of the Personality Profiles of Cultures Project. (2005). Universal features of personality traits from the observer’s perspective: Data from 50 cultures. Journal of Personality and Social Psychology, 88, 547-561
McCrae, R. R., Zonderman, A. B., Costa, P. T., Jr., Bond, M. H., & Paunonen, S. V. (1996). Evaluating replicability of factors in the Revised NEO Personality Inventory: Confirmatory factor analysis versus Procrustes rotation. Journal of Personality and Social Psychology, 70, 552-566.
Mõttus, R., McCrae, R. R., Allik, J., & Realo, A. (2014). Cross-rater agreement on common and specific variance of personality scales and items. Journal of Research in Personality, 52,
3 4 5 6 7 8 9 10 11 12 13 14 15 16 17 18 19 20 21 22 23 24 25 26 27 28 29 30 31 32 33 34 35 36 37 38 39 40 41 42 43 44 45 46 47 48 49 50 51 52 53 54
For Peer Review
47–54.
Norman, W. T., & Goldberg, L. R. (1966). Raters, ratees, and randomness in personality structure. Journal of Personality and Social Psychology, 4, 681-691.
Ozer, D. J., & Benet-Martínez, V. (2006). Personality and the prediction of consequential outcomes. Annual Review of Psychology, 57, 401-421.
Passini, F. T., & Norman, W. T. (1966). A universal conception of personality structure? Journal of Personality and Social Psychology, 4, 44-49.
Paulhus, D. L., & Vazire, S. (2007). The self-report method. In R. W. Robins, R. C. Fraley, & R. F. Krueger (Eds.), Handbook of research methods in personality psychology (pp. 224-239). New York: Guilford.
Piedmont, R. L., McCrae, R. R., Riemann, R., & Angleitner, A. (2000). On the invalidity of validity scales: Evidence from self-reports and observer ratings in volunteer samples. Journal of Personality and Social Psychology, 78, 582-593.
Shweder, R. (1975). How relevant is an individual difference theory of personality? Journal of Personality, 43, 455-484.
Sneed, C. D., McCrae, R. R., & Funder, D. C. (1998). Lay conceptions of the Five-Factor Model and its indicators. Personality and Social Psychology Bulletin, 24, 115-126.
Soto, C. J., & John, O. P. (2009). Ten facet scales for the Big Five Inventory: Convergence with NEO-PI-R facets, self-peer agreement, and discriminant validity. Journal of Research in Personality, 43, 84-90.
Sutin, A. R., Ferrucci, L., Zonderman, A. B., & Terracciano, A. (2011). Personality and obesity across the adult life span. Journal of Personality and Social Psychology, 101, 579-592. Terracciano, A., Löckenhoff, C. E., Crum, R. M., Bienvenu, O. J., & Costa, P. T., Jr. (2008). 3 4 5 6 7 8 9 10 11 12 13 14 15 16 17 18 19 20 21 22 23 24 25 26 27 28 29 30 31 32 33 34 35 36 37 38 39 40 41 42 43 44 45 46 47 48 49 50 51 52 53 54
For Peer Review
Five-Factor Model personality profiles of drug users. BMC psychiatry, 8, 22.
Vazire, S., & Mehl, M. R. (2008). Knowing me, knowing you: The accuracy and unique predictive validity of self-ratings and other-ratings of daily behavior. Journal of Personality and Social Psychology, 95, 1202-1216.
3 4 5 6 7 8 9 10 11 12 13 14 15 16 17 18 19 20 21 22 23 24 25 26 27 28 29 30 31 32 33 34 35 36 37 38 39 40 41 42 43 44 45 46 47 48 49 50 51 52 53 54
For Peer Review
Notes1. It would be possible to explain the findings of Passini and Norman (1966) without recourse to IPT if one assumes that raters identified the stranger with a real acquaintance and provided ratings of that acquaintance. The structure of ratings of these real targets could yield the FFM even if individual raters had no conception of how traits covary. There are, however, a number of other lines of evidence (see Borkenau, 1992; Sneed, McCrae, & Funder, 1998)—including the present results—that make IPT the most plausible explanation for Passini and Norman’s findings.
2. The mathematical basis of these claims is addressed in more detail in McCrae (2018). Briefly, each facet score for one source can be modeled as
Source1 facet score = aD + bMD1 + cF+ dE1
where D represents the domain component for the target (e.g., the Neuroticism in an Anxiety facet), MD represents the source’s method variance common to all facets in the same domain, F
represents the trait variance for the target specific to the facet, and E represents error; in the population all these components are mutually independent. The coefficients a, b, c, and d
indicate the quantity of each standardized component in a given score, and are scaled such that a2 + b2 + c2 + d2 = 1.0.
Under the assumption that two sources (e.g., self-reports and informant ratings) are equally reliable and valid, they must also contain the same proportion of method bias, and
Source2 facet score = aD + bMD2 + cF + dE2
The difference is
Source2 – Source1 = b(MD2 – MD1) + d(E2 – E1). 3 4 5 6 7 8 9 10 11 12 13 14 15 16 17 18 19 20 21 22 23 24 25 26 27 28 29 30 31 32 33 34 35 36 37 38 39 40 41 42 43 44 45 46 47 48 49 50 51 52 53 54