Strathprints Institutional Repository
Ye, Minxiang and Yang, Cheng and Stankovic, Vladimir and Stankovic,
Lina and Kerr, Andrew (2015) Gait analysis using a single depth camera.
In: 2015 IEEE Global Conference on Signal and Information Processing
(GlobalSIP). IEEE, pp. 285-289. ISBN 9781479975914 ,
http://dx.doi.org/10.1109/GlobalSIP.2015.7418202
This version is available at http://strathprints.strath.ac.uk/55063/
Strathprints is designed to allow users to access the research output of the University of Strathclyde. Unless otherwise explicitly stated on the manuscript, Copyright © and Moral Rights for the papers on this site are retained by the individual authors and/or other copyright owners. Please check the manuscript for details of any other licences that may have been applied. You may not engage in further distribution of the material for any profitmaking activities or any commercial gain. You may freely distribute both the url (http://strathprints.strath.ac.uk/) and the content of this paper for research or private study, educational, or not-for-profit purposes without prior permission or charge.
Any correspondence concerning this service should be sent to Strathprints administrator:
Gait Analysis using a Single Depth Camera
1Minxiang Ye,
1Cheng Yang,
1Vladimir Stankovic,
1Lina Stankovic, and
2Andrew Kerr
1Department of Electronic and Electrical Engineering, University of Strathclyde, Glasgow, G1 1XW, UK
2
Biomedical Engineering Department, University of Strathclyde, Glasgow, G1 1XW, UK
Abstract—Gait analysis is often used as part of the rehabilitation program for post-stoke recovery assessment. Since current optical diagnostic and patient assessment tools tend to be expensive and not portable, this paper proposes a novel marker-based tracking system using a single depth camera which provides a cost-effective solution suitable for home and clinic use. The proposed system can simultaneously generate motion patterns even within a complex background using the proposed geometric model-based algorithm and autonomously provide gait analysis results. The processed rehabilitation data can be accessed by cross-platform mobile devices using cloud-based services enabling emerging tele-rehabilitation practices. Experimental validation shows a good agreement with state-of-the-art non-portable and expensive industrial standards.
Keywords: multimedia signal processing, mobile multimedia content analysis
I. INTRODUCTION
During typical clinical rehabilitation programs, stroke patients are asked to complete a series of exercises and training modules after their conditions have been stabilized for periodically evaluating their walking patterns [1]. Mo-tion capture systems have become popular for this clinical recovery assessment in rehabilitation programs. However, these systems are usually based on multiple cameras, used to construct a 3D scene and track the positions of all markers in the 3D space, fixed within a large laboratory room.
An attractive alternative is to use Microsoft (MS) Kinect sensor [2] with provided software capable of tracking 25 skeleton joints. However, it is demonstrated in [3], [4], [5] that Kinect’s skeleton results are too noisy and not suitable for clinical applications. Furthermore, other marker-based single or multiple RGB camera tracking systems have limitations, requiring specific color of the cloths, lack of portability or high price such as VICON [6], single RGB camera systems of [1], [7]–[10] and multiple RGB camera systems, such as [11]. [12] explores the marker-less solution for gait analysis using MS Kinect v1, but the reported results are still not a good match with 3D benchmarks.
In this paper, we propose a novel system using a single depth camera (MS Kinect), combining the benefits of the 3D reconstruction ability of Kinect and high accuracy from VICON-like optical marker-based tracking. The proposed multimedia system provides a convenient solution for
track-ing multiple retro-reflective markers simultaneously, solv-ing a geometric model-based identification problem even within a complex background. Our proposed geometric model detector is able to label markers and construct the corresponding digital models. All markers are detected by a white blob detector before marker identification takes place. Since the retro-reflective marker introduces blank hole into the depth image, we introduce a novel algorithm to estimate the depth value for the region of each marker to restore their 3D trajectories. In experiments, we adopt the cubic Bezier curve interpolation [13] for gap filling, calculate the joint angles, visualize movement patterns, detect gait phases, measure step and stride length, swing and stance phase.
All locally processed results can be sent to a cloud server and accessed via a smart-phone by clinicians for visual-ization and diagnostics, facilitating tele-rehabilitation, as a mobile multimedia communication service. Result validation with VICON clearly shows the ability to reconstruct sagittal view planes’ gait cycles accurately.
II. PROPOSEDSYSTEM
The proposed multimedia system enables 3D optical marker-based kinematics reconstruction with high accuracy and robustness using a single Kinect sensor. The task is to estimate the position of each attached joint marker during the straight-line walking and automatically calculate customiz-able data such as joint angles, movement patterns, velocity, step and stride length, swing and stance phase, etc [14].
The system consists of four modules: (1) Data Cleaning - used for filtering out invalid data before processing. (2) Modeling - for subject modeling as identification reference. (3) Tracking - for locating the markers and automatically la-beling the trajectory of each marker. (4) Kinematics Analysis - used for customizable data computation.
All processed data are dispatched to a cloud server or another remote terminal device as a mobile inquiry service for tele-rehabilitation. We elaborate these modules next. A. Data Cleaning
The infrared (IR) and depth image sequences are captured by MS Kinect v2 with factory calibrated depth camera intrinsic parameters. We adopt depth-map projection method from [15] to get undistorted camera space coordinates of tracked markers before data cleaning.
Next, we build a trapezoidal cylindrical scene model shown in Fig.1 to clean the camera and environment noise (due to reflective materials), i.e., to remove all redundant point clouds due to potentially complex background.
Fig. 1. Sagittal View Modeling Schematic Map.
In particular, estimation of the distanceLfrom the Kinect sensor to the centroid of the floor square (denoted as red x in Fig.1) can be done by offline extraction of the floor square corners (blue dots in Fig.1) and calculating the central point used for subject modeling in Sec. II-B. After this, the walking start/end points can be estimated by view angle
β = 70◦ [16], defining the valid scene region shown in Fig.1 limited by the predefined reliable Kinect depth range. The proposed trapezoidal cylindrical scene model aims to construct the walking line scene and filter out the irrelevant point clouds outside the region of interest.
B. Modeling
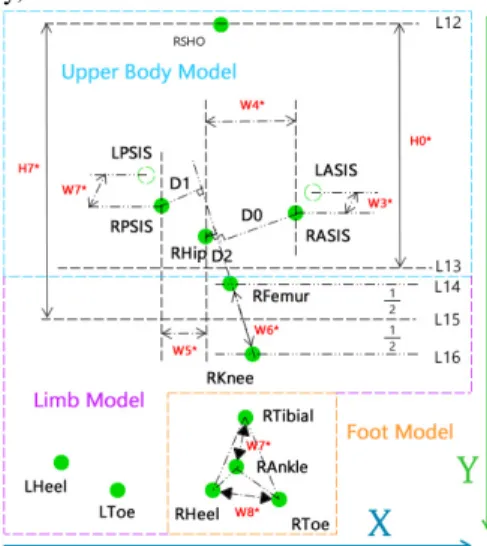
Next, we define the frontal and sagittal subject model according to the tracking requirements by physically mea-suring the subject. Our sagittal model is split into three parts: upper body, limb and foot models as shown in Fig.2.
Fig. 2. Sagittal Model (Right Hand Side). 12 visible markers are marked with green circles. 2 partial invisible markers are shown in circle outlines.
We locate all markers by validating their camera space coordinates along with axes X,Y. See Sec.II-C2. We measure
H0∗, H7∗, and W4∗ to W8∗ shown in Fig. 2 after all markers have been labeled for the static subject.
C. Tracking
The proposed tracking method detects and labels markers attached on subject during the walking exercise, on a
frame-by-frame basis using both IR and depth images. 1) Marker Detection
The marker detector consists of 4 parts: (1) Blob Filter - for detecting center of each blob. (2) Contour Finder [17] - used for finding valid contours. (3) Ellipse And Minimum Area Rectangle Fitter [18] [19] - for extracting blob information. (4) Proposed Kernel Cluster Filter - used for grabbing valid blobs as markers.
The blob filter filters the acquired 16-bit single-channel IR image into a binary image. To detect the center of each blob we use a contour finder [17] and an ellipse and minimum area rectangle fitter. The next step is to remove the blobs that do not represent markers but are due to camera noise and background. To do that, we form a concentric cycles around each blob center. Let RM arker be the radius of the
marker in pixels, and let Centre be the center of a blob. Regard C(Rn) as the pixel values forming an imaginary
circle centered atCentrewith radiusRn [in pixels], where
Rn = 1, . . . , RM arker pixels.
We apply a histogram filter on all C(Rn) to obtain the
significant pixel valuesκnfor each concentric cycle. Letκm
be the mean of κn for Marker m. Next, for Marker m we
find the smallest index im such that κm i
κm i+1
>2. LetAm=
P
j=1,imRjThen, we obtain the marker detection threshold
T as the mean of allκmweighted by Am
PM l=1A
l whereM is
the number of visible markers in the floor square.
To detect markers, first we apply a contour algorithm of [17] to locate concentric contours Ω= ω0, ω1, ... for each
blob in the binary image using thresholdT. Let|Ω|be the number contours in the set Ω. Then, the centroid of each marker is identified as:
Centroid= F itEllipse(Ω) if|Ω|>5 F itM inRect(Ω) if|Ω| ∈(2,5) ω0+ω1 2 if|Ω|= 2
andF itDepth[Grow(Ω, δ)] = 1
ω0
if|Ω|= 1
andF itDepth[Grow(Ω, δ)] = 0 (1)
where F itEllipse uses the algorithm of [18] to obtain
the centroid given each blob’s contoursΩ andF itM inRect
uses the algorithm of [19] to calculate the minimum-area bounding rectangle for locating the centroid. If the number of counters is less than 3, then the functionGrow given by (2) is applied to create a new rectangular region by applying kernel incrementδ onPi,j from contoursω0 (andω1).
G=Grow(Pi,j, δ) =M ini,Pi,j∈Ω(Pi,j)−δ
| {z } left , M inj,Pi,j∈Ω(Pi,j)−δ | {z } top ,
M axi,Pi,j∈Ω(Pi,j) +δ
| {z } right , M axj,Pi,j∈Ω(Pi,j) +δ | {z } bottom (2) δ is set to 3 and 2 for the case |Ω| = 2 and |Ω| = 1, respectively. Function F itDepth in (1) determines whether
to include the Centroid by examining the new windowG
given by (2) as:
F itDepth=
n1, forN > τ
0, forN =τ (3)
where we setτ= 0andN as the number of pixels inG
whose corresponding depth value is in the sensor’s reliable range of (500,4500] mm. As a result, we regard all blobs centered atCentroidas the final detected markers. 2) Marker Identification
In this section, we introduce a model-based identifier for restoring depth value, relocating the region of interest on the associated depth image using our proposed histogram clustering algorithm, that is used to obtain marker trajec-tories. Since we use retro-reflective markers, the area in the depth image occupied by the markers is full of zero depth values while the spatially collocated regions in the IR image will have very high values. Having this in mind, we can estimate the depth value at the marker centroid from the surrounding depth pixels. However, marker intersection is difficult to be identified due to low resolution and the uncertain surrounding background especially when arm and leg overlap. Moreover, the surrounding depth values will also be zero since edge noise is pre-introduced by the Time of Flight (TOF) sensor.
Therefore, we calculate the weighted mean depth from depth-map histogram statistics with our proposed clustering algorithm described next. The task of clustering is to clean the zero depth hole inside the region of pixels grown by recovery radius δ = 3 using (Eq.2) with Pi,j from the
corresponding detected marker region where the IR value is high. The weight value of depth clustering is calculated as the significant mean relative distance between depth pixels to the centroid in each histogram bin.
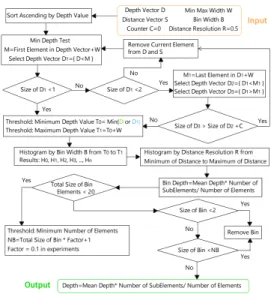
Fig. 3. Histogram Clustering Workflow
Fig. 3 shows a flowchart of the histogram clustering algorithm for the markers on knee, ankle, heel, toe, using
T0=M in(D)and estimate the depth value for the marker
on hip, femur that has occlusion or missing conditions during
arm swing with T1 =M ax(D1)andT0=T1−W, where
D,W, andD1are distances shown in Fig. 2. If the shoulder
marker is on topmost of the surrounding pixels due to its distance to neck on sagittal plane, we set T0 =M in(D1).
By applying these different thresholds, we eventually reduce the noise from the edges and holes, moving forward to restore the depth.
When labeling each marker, we use the subject model (Sec. II-B) to examine all possible marker groups for upper body, limb and foot models (see Fig. 2). We order all markers in the region of L12 and L13 by X-coordinate and validate the distances D0, D1, D2 for obtaining the most-like group as a result for the upper body model. For the upper limb, we firstly order all markers under L13 by Y-coordinate and X-coordinate afterwards. Secondly, we separate them into two groups by evaluating 6 markers nearest to the ground by testing all possible groups for the triangle foot model shown in Fig. 2 so that we can eventually get the labeled right foot. When labeling the limb model, we choose the left markers in the upper limb region for combining them according to Y-coordinates and finally determine left foot’s position by checking its relative 3D position with right knee marker and foot. For large out-of-plane rotation on the subject, we detect the gaps when large position error occurs between adjacent frames and predict to find the most-like marker trajectories according to the 4th cubic Bezier curve [13] interpolation. D. Kinematics Analysis
We adopt relative knee angle (based on hip, knee and an-kle trajectories) and gait phases (detecting local extremums and inflection ranges) defined in [14] for kinematics analysis in our system. The gait cycle mainly consists of initial contact, loading response, mid stance, terminal stance, pre-swing, initial pre-swing, mid swing and terminal swing [14]. We examine the relative trajectories of knee, ankle, and heel markers to the floor to detect these gait phases.
The proposed method to measure step and stride length, stance and swing phase uses resampled trajectories (100 fps) of heel, ankle, knee and hip markers by calculating vertical thigh segment angle, tibia segment angle, inflection points and local peaks of heel markers horizontal and vertical axis values shown in Figs. 4 and 5.
Fig. 4. Heel Horizontal Axis Fig. 5. Heel Vertical Axis
For measuring the step and stride length, it is easier to analyze the stable valuesψ0,ψ1,ψ2using window matching
for the region between inflection points in Fig. 4. Once the left and right heels horizontal stable values are found, the step and stride length can be calculated using the adjacent stable values over time.
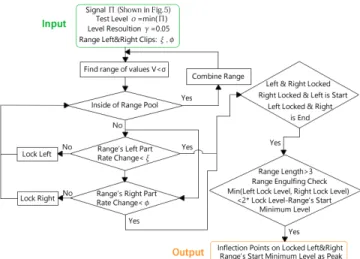
Fig. 6. Inflection and Local Extremum Searching
Detecting gait phase depends on heel strike and toe off. This can be simplified into finding inflection points η0,
η1, η2, η3 and local extremum ρ0, ρ1 where we adopt a
novel global gradient filtering algorithm (instead of using an averaging filter) shown in Fig. 6. The algorithm searches the region between the inflection points from a global minimum to maximum by regrouping iteratively.
E. Rehabilitation Online Service
Due to high portability and low price, our system can be easily deployed in small clinics and community hospital or even use at home. Furthermore, its simple setup procedure naturally provides the feasibility to build up a mobile mul-timedia communication system for visualization, presenta-tion and telemedicine services through mobile devices after dispatching the diagnostic reports. In Fig. 7, one can see that the overall system is capable of remote operation and data transmission simultaneously with a cloud server which consists of components on data mining, active diagnostics and permission management.
Fig. 7. Mobile Multimedia System
Once the diagnostics reports of knee angle, step and stride length, swing and stance phases are obtained using our proposed system, the built-in software dispatcher will up-load encrypted patient personal information and diagnostics reports to a cloud server for authorized direct inquiry or secondary data mining as to evaluate patient’s rehabilita-tion condirehabilita-tions from big data. When our designed mobile
application interacts with the dispatcher or cloud server, it takes the advantages of remote diagnostics, operation and tele-rehabilitation, etc. These benefits provides a very user friendly environment for tele-rehabilitation with no operation expertise, potentially ready for clinic test.
III. EXPERIMENTALRESULTS&DISCUSSION
We recorded 5 randomly selected healthy subjects (4 males, 1 female), and each recording contains 8 separate trials. Thus, we tested the proposed approach on 40 inde-pendent trials. We follow [14], measure knee angleα, step length ζ, stride lengthξ, stance and swing phases.
Fig. 8. Relative Knee Angle Comparison with VICON
Four typical trials are shown in Fig. 8. It can been seen that our results have high accuracy benchmarked to the in-dustrial standard VICON (100 fps). Moreover, we manually select the key frames (by examining the infrared image sequence with corresponding static point clouds captured in the experiments as reference) for validating the step and stride length, stance and swing phase. In order to evaluate the performance of the phase detection, we averaged 40 sets of results, representing their mean percentage error and percentage standard derivation in Table I.
TABLE I
PERFORMANCE OF THE PROPOSED METHOD FOR MEASURING STEP AND STRIDE LENGTH,AND STANCE AND SWING PHASE
Error Step Stride Stance Swing
Mean(%) 1.05 1.17 1.82 1.10
Std(%) 5.33 4.76 5.83 4.37
IV. CONCLUSION
Our proposed cheap and portable single camera tracking system is more attractive for gait analysis in the rehabili-tation program than typical optical motion capture systems such as current VICON. Furthermore, the proposed system provides a mature solution for building up a mobile multi-media interactive service for visualization, presentation and tele-rehabilitation. Validation results indicate high perfor-mance for the sagittal plane gait analysis which certainly has practical value in clinical tests using the designed mobile multimedia application for further study.
REFERENCES
[1] C. Yang, U. Ugbolue, B. Carse, V. Stankovic, L. Stankovic, and P. Rowe, “Multiple marker tracking in a single-camera system for gait analysis,” in 2013 IEEE International Conference on Image Processing, ICIP 2013 - Proceedings. IEEE, October 2013, pp. 3128–3131.
[2] Kinect for Window software development kit, May 2015. [Online]. Available: http://www.microsoft.com/en-us/kinectforwindowsdev [3] S. kook Jun, X. Zhou, D. K. Ramsey, and V. N. Krovi, “A comparative
study of human motion capture and analysis tools.” [Online]. Avail-able: http://citeseerx.ist.psu.edu/viewdoc/summary?doi=10.1.1.391.73 [4] H. Nguyen and J. Meunier,Gait Analysis from Video: Camcorders vs Kinect, ser. Lecture Notes in Computer Science. Springer International Publishing, 2014, vol. 8815, book section 8, pp. 66–73. [5] R. Clark, S. Vernon, B. Mentiplay, K. Miller, J. McGinley, Y. Pua, K. Paterson, and K. Bower, “Instrumenting gait assessment using the kinect in people living with stroke: reliability and association with balance tests,”Journal of NeuroEngineering and Rehabilitation, vol. 12, no. 1, p. 15, 2015.
[6] VICON, Gait Analysis, 2015. [Online]. Available: http://www.vicon.com
[7] A. Leu, D. Ristic-Durrant, and A. Graser, “A robust markerless vision-based human gait analysis system,” inApplied Computational Intelligence and Informatics (SACI), 2011 6th IEEE International Symposium on, May 2011, pp. 415–420.
[8] T.-Y. Liao, S.-G. Miaou, and Y.-R. Li, “A vision-based walking pos-ture analysis system without markers,” inSignal Processing Systems (ICSPS), 2010 2nd International Conference on, vol. 3, July 2010, pp. V3–254–V3–258.
[9] C. Yang, A. Kerr, V. Stankovic, L. Stankovic, and P.Rowe, “Upper limb movement analysis via marker tracking with a single-camera system,” in2014 IEEE International Conference on Image Processing (ICIP), 2014, pp. 2285 – 2289.
[10] C. Yang, A. Kerr, V. Stankovic, L. Stankovic, and P. Rowe, “Arm movement analysis via marker tracking with a single-camera system,” in WCB-2014 7th World Congress of Biomechanics, Boston, United States, June 2014, pp. 1547–1548.
[11] Y.-R. Li, S.-G. Miaou, C. Hung, and J. Sese, “A gait analysis system using two cameras with orthogonal view,” inMultimedia Technology (ICMT), 2011 International Conference on, July 2011, pp. 2841–2844. [12] S. Sarkar, L. Stankovic, A. Kerr, and P. Rowe, “Kinect-based lower limb motion analysis,” in ISB-2015 XXV Congress International Society of Biomechanics, July 2015.
[13] M. K. Agosto, “Bezier curves,” inComputer Graphics and Geometric Modelling: Implementation & Algorithms, 2005, pp. 396–404. [14] M. S. D.Casey Kerrigan and M. N.Wen, “Gait analysis,” in
Rehabil-itation Medicine: Principles and Practice, 1998, pp. 167–174. [15] E. Lachat, H. Macher, M.-A. Mittet, T. Landes, and P. Grussenmeyer,
“First experiences with kinect v2 sensor for close range 3d modelling,”
ISPRS - International Archives of the Photogrammetry, Remote Sens-ing and Spatial Information Sciences, vol. XL-5/W4, pp. 93–100, 2015.
[16] Kinect for Windows features: Kinect sensor key features and benefits, May 2015. [Online]. Available: https://www.microsoft.com/en-us/kinectforwindows/meetkinect/features.aspx
[17] S. Suzuki and K. be, “Topological structural analysis of digitized binary images by border following,”Computer Vision, Graphics, and Image Processing, vol. 30, no. 1, pp. 32 – 46, 1985.
[18] A. W. Fitzgibbon and R. B. Fisher, “A buyer’s guide to conic fitting,” inProceedings of the 6th British Conference on Machine Vision (Vol. 2), ser. BMVC ’95. BMVA Press, 1995, pp. 513–522.
[19] G. Toussaint, “Solving geometric problems with the rotating calipers,” inIEEE MELECON83, May 1983.