This manuscript is a post-print copy of the following article
Title:
A Tool for Subjective and Interactive Visual Data Exploration
Authors: Bo Kang ; Kai Puolamäki ; Jefrey Lijffijt ; Tijl De Bie
The final publication is available at Springer via
A Tool for Subjective and Interactive
Visual Data Exploration
Bo Kang1, Kai Puolam¨aki2, Jefrey Lijffijt1, Tijl De Bie1
1 Data Science Lab, Ghent University, Belgium
firstname.lastname@ugent.be
2 Finnish Institute of Occupational Health, Finland
kai.puolamaki@ttl.fi
Abstract. We presentSIDE, a tool for Subjective and Interactive Vi-sual Data Exploration, which lets users explore high dimensional data via subjectively informative 2D data visualizations. Many existing visual an-alytics tools are either restricted to specific problems and domains or they aim to find visualizations that align with user’s belief about the data. In contrast, our generic tool computes data visualizations that are surpris-ing given a user’s current understandsurpris-ing of the data. The user’s belief state is represented as a set of projection tiles. Hence, this user-awareness o↵ers users an efficient way to interactively explore yet-unknown features of complex high dimensional datasets.
1
Introduction
Exploratory Data Mining is the process of using data mining methods to gain novel insights into data without having a specific goal in mind. To convey large amounts of complex information, it is a logical choice to present this information visually, as the information bandwidth of the eye is much larger than the other senses, and humans excel at spotting visual patterns [11]. Surprisingly, visual interactive data mining tools are still rare.
The few tools that exist are either designed for specific problems and domains (e.g., itemset and subgroup discovery [1,4,7], information retrieval [10], or analy-sis of networks [2]) and/or aim to present information that align with the user’s beliefs (e.g., semi-supervised PCA [7]). However, users are typically interested in finding structures in the data that contrast with their current knowledge [5].
In this paper, we present a generic tool3 that enables users to efficiently
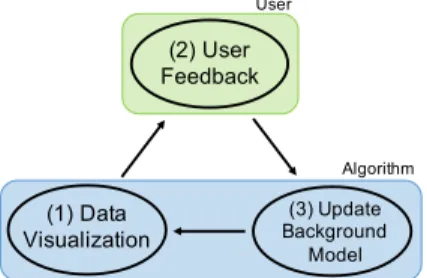
ex-plore data via a sequence of 2D scatter plots, i.e.,projections. It models the user’s beliefs about data by iteratively incorporating their feedback, which in turn is utilized for calculating an updated data projection. SIDE operates iteratively, with three steps in each iteration (see Fig. 1). In step 1, it presents a user with a ‘surprising’ data projection. In step 2, the user provides feedback about the pro-jection. Finally, in step 3, thebackground modelis updated to reflect the user’s
3 Our tool, SIDE, is freely accessible at http://www.interesting-patterns.net/
current belief state. It then repeats from step 1, and shows a data projection that takes into account the updated background model.
2
Subjectively Interesting Projections
SIDE employs a generic method for interactive visual exploration of high di-mensional data, with awareness of a user’s belief sate about the data. Due to space constraints we limit ourselves to describe only the intuition and overview of the approach. For a full description, we refer the reader to our paper [9].
(1) Data Visualization (2) User Feedback (3) Update Background Model User Algorithm
Fig. 1: This three-step cycle illus-trates our tool’s flow of action. In order to present the user with
subjectively informative data projections, there are two modeling problems [3]. First, we have to maintain a background
model throughout the exploration process.
This model accumulates the user’s feed-back, which represents the knowledge they learned from the data projections. Hence, this model represents a user’s current belief about the data.
The second obstacle is quantification of the informativeness, for which we employ
constrained randomization [6]. The idea is that we sample random data from the user’s current belief state, where the beliefs are modeled as constraints to the randomization procedure. Then, we search for projections that contrast with the random data, and hence that contrast with the current beliefs. That is, we assume that a data projection that (maximally) deviates from the beliefs will reveal subjectively novel structures.
Then, an optimization problem arises to find a projection that makes the real data maximally di↵erent from the randomized data. Currently the tool em-ploys the L1 distance, which can be optimized well using standard optimization toolboxes. We have not studied the choice of measure extensively yet.
3
User Interface
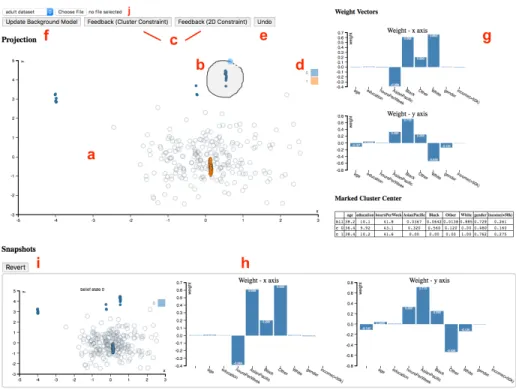
SIDEwas designed according to three principles for visually controllable data mining [8], which essentially says that the model and the interactions should be transparent to users, and the analysis method should be fast enough such that the user does not lose their trail of thought. Figure 2 shows the user interface of our tool. The main component of this interface is the interactive scatter plot (Fig. 2a). The scatter plot visualizes the projected data (filled dots) and the randomized data (gray circles) using the same projection. By drawing circles (Fig. 2b), the user can highlight a projection tile pattern (i.e., a set of filled dots). Once a set of points is marked, the user can press either feedback button (Fig. 2c), indicating these points form a cluster. If the users believe the points are clustered only in the shown projection, they click ‘2D Constraint’, while
Fig. 2: Visual layout of interactive dimensionality tool, which contains interact area (a), projection meta information area (g), and snapshots area (h).
‘Cluster Constraint’ indicates they are aware of the fact that these points will be clustered in other dimensions as well. To identify the defined clusters, data points associated with the same feedback (i.e., user’s belief) are filled by the same color (Fig. 2d), and their statistics are shown in a table. The user can define multiple clusters in a single projection, and they can also undo (Fig. 2e) the feedback. Once a user finishes exploring the current projection, they can press ‘Update Background Model’ (Fig. 2f). Then, the background model is updated with the provided feedback and a new scatter plot is computed and presented to the user, etc.
A few extra features are provided to assist the data exploration process: to gain an intuitive understanding of a projection, the weight vectors associated with the projection axes are plotted as bar charts (Fig. 2g). At the bottom of Figure 2g, a table lists the mean vectors of each colored point set (i.e., cluster). The exploration history is maintained by taking snapshots of the background model when updated, together with the associated data projection (scatter plot) and bar charts (weight vectors). This history in reverse chronological order is illustrated in Figure 2h. The tool also allows a user to click and revert (Fig. 2i) back to a certain snapshot, to restart from that time point. This allows the user to
discover di↵erent aspects of a dataset more consistently. Finally, custom datasets can be selected for analysis from the drop-down menu (Fig. 2j). Currently our tool only works with CSV files and it also automatically sub-samples any data set so that the interactive experience is not compromised. By default, two datasets are preloaded so that users can get familiar with the tool.
4
Conclusions
We presented SIDE, an interactive exploratory data mining tool that allows users to visually explore data. By modeling a user’s belief state, our tool is able to present users with views of data that contrast with and add to their current knowledge. In contrast to the existing visual analytics systems, our tool is automatically tailored towards each specific user and able to cope with generic mining tasks. Thus, users can easily obtain new knowledge about data on top of their increasingly accurate understandings, providing a more efficient way of navigating the complex information space hidden in high-dimensional data.
Acknowledgments This work was supported by the European Union through the ERC Consolidator Grant FORSIED (project reference 615517), Academy of Finland (decision 288814), and Tekes (Revolution of Knowledge Work project).
References
1. Boley, M., Mampaey, M., Kang, B., Tokmakov, P., Wrobel, S.: One click mining: Interactive local pattern discovery through implicit preference and performance learning. In: Proc. of KDD. pp. 27–35 (2013)
2. Chau, D.H., Kittur, A., Hong, J.I., Faloutsos, C.: Apolo: making sense of large network data by combining rich user interaction and machine learning. In: Proc. of CHI. pp. 167–176 (2011)
3. De Bie, T.: Subjective interestingness in exploratory data mining. In: Proc. of IDA. pp. 19–31 (2013)
4. Dzyuba, V., van Leeuwen, M.: Interactive discovery of interesting subgroup sets. In: Proc. of IDA. pp. 150–161 (2013)
5. Hand, D.J., Mannila, H., Smyth, P.: Principles of Data Mining. MIT Press (2001) 6. Lijffijt, J., Papapetrou, P., Puolam¨aki, K.: A statistical significance testing ap-proach to mining the most informative set of patterns. DMKD 28(1), 238–263 (2014)
7. Paurat, D., G¨artner, T.: Invis: A tool for interactive visual data analysis. In: Proc. of ECML–PKDD. pp. 672–676 (2013)
8. Puolam¨aki, K., Papapetrou, P., Lijffijt, J.: Visually controllable data mining meth-ods. In: Proc. of ICDMW. pp. 409–417 (2010)
9. Puolam¨aki, K., Kang, B., Lijffijt, J., De Bie, T.: Interactive visual data exploration with subjective feedback. In: Proc. of ECML–PKDD (to appear) (2016)
10. Ruotsalo, T., Jacucci, G., Myllym¨aki, P., Kaski, S.: Interactive intent modeling: Information discovery beyond search. CACM 58(1), 86–92 (2015)
11. Ware, C.: Information Visualization: Perception for Design. Morgan Kauf-mann/Elsevier, third edn. (2013)

