Int. J. Advance Soft Compu. Appl, Vol. 10, No. 3, November 2018 ISSN 2074-8523
Beast to Beauty Transition:
Design Process for Complex Visual Analytics
Suraya Ya’acob 1, Nazlena Mohamad Ali 2, Hai-Ning Liang 3, Nilam NurAmir Sjarif 1, Nurul Huda Firdaus Mohd Azmi1 , Doris Wong Hooi Ten1
1Advanced Informatics School, Universiti Teknologi Malaysia, KL Malaysia.
[email protected], [email protected], [email protected], [email protected] 2Institut Visual Informatik, Universiti Kebangsaan Malaysia, Bangi Malaysia.
3Dept of Computer Science and Software Engineering, Xi'an Jiaotong Liverpool
University, China [email protected]
Abstract
Visual analytics fundamentally influences the analytical process. Without proper guidance, the complex condition can become a beast that hides the beauty of analytical data. Since visual analytics is the only way to represent analytical outcomes, ineffective visual analytics will bury the relevancy of information to support any valuable decision. Thus, this research revisits the way to design more valuable and effective visual analytics, especially for the complex condition which involves i) the information complexities, ii) the nature of the activities involved and iii) the complex context of usage. Governed by the Design Science Research Methodology (DSRM), the research applied the pragmatic philosophical worldview and exploratory research. Furthermore, the design process embedded the human-activity centered design approaches as the new perspective to get a better understanding of the visual analytics users and the analytical activities involved. There are basically three important activities of the design process that comprises of five design phases. Activity 1 aims to identify the visual analytics context and its challenges, Activity 2 to develop the solution of visual analytics design and Activity 3 to evaluate the effectiveness of visual analytics to handle its complex context. By offering a set of design process, this research aims to improve the experience of the visual analytics community to design in a more flexible, dynamic and intuitive way. Finally, this paper also recommends appropriate methods, the unit of analysis, sampling strategy and data management & analysis suitable for complex visual analytics.
Keywords: visual analytics, design process, complex condition, analytical processes, complex cognitive activities and context dependent
1 Introduction
The complexities of analysis have been expanding rapidly. Just as the amount and complexity of information grow, so do the sophistication and complexity of their corresponding analytical tools and techniques. In the context of visual analytics, according to [1] data and information are encoded and stored internally and are not directly accessible to users. The only access that users have to this information is through the visual analytics at the interface of a tool. Therefore, the design of visual analytics for big data interface fundamentally influences how users perceive and process the complexities of information. Without proper guidance, the representation of information complexities through visual analytics will become infuriating. According to Johnson [2], there is a great challenge to visualize the complexities of information that have been characterized as having many parts where those parts interact with each other in multiple ways and layers. These characters of information complexities can become a beast that hides the beauty of analytical data. Since visual analytics is the only way to represent analytical outcomes, ineffective visual analytics will bury the relevancy of information to support any valuable decision. The report from Gartner [3] justified the needs for effective visual analytics to convince business decision making in order to reduce “60% of Big Data project will fail to go beyond piloting and
experimentation, and will be abandoned.”
According to [4], the methodological aspect of visual analytics was a topic in the research and development (R&D) roadmap for visual analytics as mentioned in
Illuminating the Path, as a critical aspect of moving research into practice. Since visual analytics has been growing up as the science of analytical reasoning supported by interactive visual interfaces [5], it has an integral approach consisting of visualization, human factors and data analysis. Kosara and Purchase [6] mentioned this field as the marriage of science and arts. Thus, the design process of visual analytics not only involves assessing the visualizations, interactions, or data processing algorithms themselves but also involves the complex processes that a tool is meant to support human cognitive (such as exploratory data analysis and reasoning, communication through visualization, or collaborative data analysis). The researchers and practitioners in the Visual Analytics field have long identified many of the challenges faced when planning, conducting, and executing the design process of a visualization tool or system. One of the challenges is with the nature of the analytical activities that usually involve the complex cognitive activities (CCA) and context dependent environment such as including decision making, problem solving, sense making, analytical reasoning and strategy planning. For visual analytics to move from research into practice, the design process must be able to understand the needs, challenges and issues within the process of this complex condition. Thus, it is time to revise the way we design Visual Analytics by considering the nature of CCA, its complex environment and dependency on the business and users’ context perspectives.
3 Beast to Beauty Transition
2 Related Work
The thorough and integrative methodological basis for context dependent environment of visual analytics yet lack in the research. The suitable methodology has been the challenge since the findings from literature as shown in Table 1 indicated that: i) generally, there is inadequate of visual design process, ii) if there is so, it is focused more on functional and operational use (e.g visual mapping, operating steps and taxonomies) and iii) there is a lack of rationales for design decision.
Table 1: The LR summary for Visual Design Process
No Sources Description Summary
1 [7] Classical visual information seeking mantra – overview first, zoom and filter then details on demand
Concern more on tasks and
functionalities 2 [8] Visualization mapping from raw data to
visual space, form (glyph, presentation) and properties
Focus more on visual mapping (raw data to visualization) and operating steps. 3 [9] Visualization pipeline
4 [10] Data State Reference Model
5 [11] Design guidelines and methodologies in the visualization field is still left behind. Left to consult design example,
guidelines and reference model which do not adequately describe the visualization design process.
Inadequacy of visualization design process.
6 [12] Approach of ‘genius design’ in
visualization. Designer takes an absolute authority that need to be supported systematically.
‘Genius design’ need to be supported systematically
7 [13] Human centric elements (e.g. cognitive, perceivedness and communication) in a form of abstraction, uncertain and complex are still in dilemma to be accepted as logical and scientific rationales in visualization. Human centric elements is still in dilemma to be accepted as logical and scientific rationales in visualization.
No Sources Description Summary 8 [14] Despite the increasing number of
sophisticated and novel visualization techniques and methods, little is known about the design rationales that drove the design decisions
Lack of rationales for design decision.
9 [15] Concern of understanding the context of visualization usage as a rationales for visualization to work effectively.
Lack of guidelines for the process of
viewing the visualization to be knowledge for the users.
10 [16] Emphasize the importance of continuity from ‘viewing to one eyes’ (visualization coding) to ‘seeing to one mind’
(knowledge value of visualization to the human).
From these findings, the research found the importance for environment and specific context methodology to go beyond the users and dig more about their context of use and the activities involved - these will lead to the rationales of any visual analytics’ solution and returning the solution into the real settings to justify the relevancy of it. In order to do that, the research proposed an extension from Human Centered Design (HCD) to Activity Centered Design (ACD) approach. According to [17], this extension will improve the understanding of the users and their activities as a basis to support visual analytics’ design rationales. On top of understanding the user, by carefully studying the activities which needs to be done by the users during CCA might potentially lead to understanding the root problem of its challenges. In this case, the methodology proposed is not directly trying to develop a novelty visual analytics design, instead the process is intended to understand the root cause of environment conditions and then rationalize the visual analytics’ solution.
According to [18], human centric visualization emphasized the importance to understand why human (users) need the visualization hence enhanced the way on how visualization can best facilitate them. It is based from Human Centered Design (HCD) as the process to ensure the people’s need are met [19]. It has emphasized an effective design by solving the right problem and by doing so, it is capable to meet the human needs. Two important components in HCD are to identify the right problem and to find the right solution based on the double diamond diverge-converge model [20,17] as shown in Fig.1. The first diamond of divergence to convergence is meant to discover and define the right problem while the second diamond of divergence to convergence is meant to develop and deliver the right solution.
5 Beast to Beauty Transition
Fig. 1 Two Important Components in Human Centered Design (source: [17])
However, focusing and centralizing only on a human (user) might lead to insufficient understanding of the root cause of the problem in the environment. The culture and geography can be the greatest shortcomings to generalize on user understandings. Besides that, people primarily think about what they want instead of what they need [21] and they are always change the thinking and requirements based on the context and situation. In order to develop a specific design by referring to the users alone might improve the design for some group of people at the cost of making it worse for the others. The more consideration that is tailored for any particular likes, dislikes, skill and needs of a particular target population, the less likely it will be appropriate for others. Thus, [17] suggest an Activity Centered Approach (ACD) to further define the design and its structure. ACD can be defined as actions taken by the users to achieve the desired goal and has its theoretical underpinnings in Activity Theory. Since ACD is an enhancement from HCD, there is still an understanding of people but it also requires a deep understanding of the technology, tools and the reasons for the activities. This research intended to propose the design of visual analytics’ situation by understanding the users-activity from the perspective of ACD. Through ACD, the process design should be able to identify the dynamic sequential operation underlying the processes’ activity to improve the ill-supported structure because most of HCD seem centered around static understanding of each set of controls. Furthermore, ACD is relevant to CCA since [17] defines and differentiates the term of activity as opposed to task, action and operation (events) that are in line with the four levels of CCA [1]. Thus embedding ACD during the visual analytics design process can potentially help for a better understanding the complex situation.
Furthermore, complex visual analytics always take place in the organization settings where an experts and decision-makers collaboratively use, apply, and manipulate visual analytics to support and convince the business decision and
apparently, the visual analytics are supposed to be used during the meetings, discussions and forums are among the familiar settings during the collaboration. With different individual backgrounds, extensive scopes, and diverse ideas, it is difficult to develop mutual analytical process, especially when the integration is carried out between various domains of knowledge [22, 23]. Thus, doing collaborative itself leads to higher level of cognitive complexities; and at the same time, increases the difficulties to communicate among the group members; and poses numerous cognitive overload, and emotional and social challenges [24]. They all rely heavily on the analytical use of information, combine their human flexibility, creativity and background knowledge with the enormous storage and processing capacities of today’s computers to gain insight into complex problem and challenges. Therefore, in designing visual analytics, it is essential for the methodology to consider collaborative environment as mentioned above. The design process for visual analytics is not only meant to fulfill the usability in the complexities of information, but also able to centralized the mental model among users and support the convergence and emergent during analytical processes. Through the design perspective, the research is not directly trying to solve the complex analytical process, instead the research propose the design process to discover the real problem by firstly understanding who the user is and their activities that lead to the users’ difficulties during the process. By mapping back the user-activities problem and design, we hope to accomplish a design solution that is able to handle the users’ conditions and their sequential activities within the complex conditions. Norman [17] has emphasized the importance to discover the real problem as he said “Engineers and business people are trained to solve problems. Designers are trained to discover the real problems. A brilliant solution to the wrong problem can be worse than no solution at all: solve the correct problem”. Even though the design perspectives seem to be going backward by revisiting the problem, it is crucial since the visual analytics design especially for the complex condition is in lack of it. The next section will further explain the proposed methodology.
3 The Proposed Methodology
This section intend to offer the potential methodology to guide complex visual analytics. In conjunction with that, since the central attention in this methodological paper is visual analytics yet the visualization field itself is lack of the suitable design process, the research decide to apply Design Science Research Methodology (DSRM) that is generally used as the comprehensive and rigorous backbone to govern the research design especially in visualization and Human Computer Interface (HCI) larger extent – Information Science (IS) discipline. Furthermore, DSRM is suitable to guide and conduct visual analytics design since it has been congruent with the pragmatic philosophical worldview, supports an exploratory mode and is relevant to the complex activities’ nature phenomenon. However DSRM alone is insufficient to handle the complex-environment visual
7 Beast to Beauty Transition
analytics design process, there is a need to embed HCD-ACD and consider collaborative perspective within the design process.
Due to the needs to understand, develop and evaluate visual analytics within CCA and context dependent environment, the methodology is following the pragmatic philosophy and exploratory approach. This methodology is having pragmatic philosophical view because the solution should arise out of actions of the complex and context dependent situation rather than antecedent (as in postpositivism) or social understanding (as in constructivism) alone. Instead of focusing on methods, this research emphasized the real world practice and problem and used all approaches available to understand the context challenges and find a way to solve it. Thus, this research worldview is aligned with Creswell [25, 26] to convey the importance of focusing attention to the problem from the phenomenon and then using pluralistic approaches to derive a solution about the problem. Even though the methodology proposed give guidance for visual analytics design process, hence it also give freedom and applicable for problem solving situation.
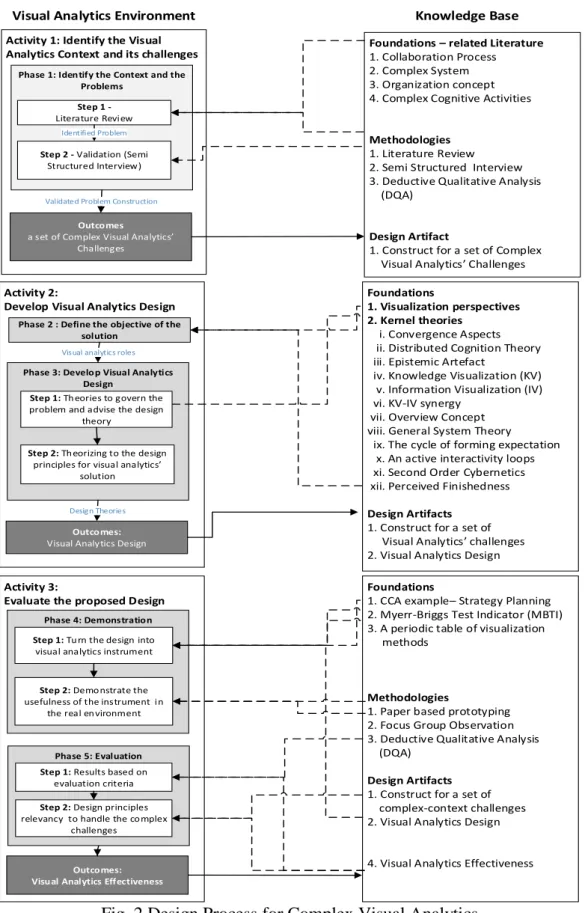
Based on the pragmatic philosophical worldview and DSRM, the proposed methodology intended to complement and mixed the research method as long as they can serve the visual analytics’ purpose and usages. Considering the timing by sequential that is connecting from the complex phenomenon and weighting more on qualitative, based on Creswell’s planning procedures, this methodology is having a sequential exploratory to govern the research methods since it is congruent to the complex and context dependent purpose - to develop the visual design solution because the existing solution is inadequate or not available. It is suitable for a phenomenon that has not been clearly defined. Since, we started by knowing a little about the visual analytics usage challenges and not to mention how to solve them, the pragmatic paradigm is guiding to seek for a new findings. Therefore, this methodology will utilize the advantage of DSRM in term of the flexibility for the phases to be combined with other appropriate methods. The encouragement to adapt other theories and methods is what needed most since we need the research from other areas and fields to help us. By having DSRM as the basic guidelines and with the combination of other knowledge base, the research found the suitability of the research design process to guide the complex and context dependent visual analytics through human-activity centric approach as shown in Fig.2.
Based on the three commonalities of DSRM phases, there are three main activities have been introduced in the propose methodology.
Activity 1 is to identify the complex-environment and its challenges. It is crucial for complex visual analytics because the environment and context of visual analytics are varies based on its users and purpose. The solution is depending on the context of its use. Thus, identifying the context and its challenges and requirements within the context and its natural environment is substantial to derive for more effective visual analytics’ solution.
Activity 2 is intend to develop the visual analytics as the solution for the identified environment. The outcomes from activity 1 will be reflected from the visual perspectives to provide the rationales and see the clearer roles for visual analytics. This might lead to an effective of theory usage and theorizing during the visual analytics design development.
Activity 3 is intends to justify the usefulness and effectiveness of the visual analytics design through demonstration and evaluation phases. Finally, communication phase will let the research to justify the contribution of the research outcomes towards the visual analytics fields and its users.
Each of the activities will be explain in the paragraph here after. 3.1. Activity 1 – Identify the context and its challenges
Problem identification is aimed to define the specific research problem and justify the value of solution. It is the very first and crucial activity in the design process. [27, 28] have mentioned about awareness of the problem as the prerequisite in the DSRM process and [29] also agree on the necessity to see the problem as the motivation to move to the next activity. It also can motivate researchers to pursue the solution, help to understand the reasoning and rationales of the proposed solution and help the researchers to justify the value of the solution.
Since there is still a lack of consideration about complex condition in visual analytics design, it is still inadequate of the research to emphasize the significant problem within complex condition that is able to justify the needs for a better design. Therefore, activity 1 emphasized the importance to identify the visual analytics context and its challenges from scratch, in which the research intended to expand the phase of the problem identification by embedding the methods of Literature Review (LR) and analysis. Through LR, the problem identification view researches from other areas to help us understand the root cause and then verify these findings within methods that appropriate for natural and real settings environment such as semi structured interview, case study and focus group observation. In other aspects, the verification can enhance the credibility of the identified challenges to convince the visual analytics communities.
9 Beast to Beauty Transition
Phase 1: Identify the Context and the Problems
Activity 1: Identify the Visual Analytics Context and its challenges
Visual Analytics Environment
Foundations – related Literature
1. Collaboration Process 2. Complex System 3. Organization concept 4. Complex Cognitive Activities
Methodologies
1. Literature Review 2. Semi Structured Interview 3. Deductive Qualitative Analysis (DQA)
Design Artifact
1. Construct for a set of Complex Visual Analytics’ Challenges
Knowledge Base
Step 1 -
Literature Review
Step 2 - Validation (Semi
Structured Interview)
Outcomes
a set of Complex Visual Analytics’ Challenges
Activity 2:
Develop Visual Analytics Design
Foundations
1. Visualization perspectives 2. Kernel theories
i. Convergence Aspects ii. Distributed Cognition Theory iii. Epistemic Artefact
iv. Knowledge Visualization (KV) v. Information Visualization (IV) vi. KV-IV synergy
vii. Overview Concept viii. General System Theory ix. The cycle of forming expectation x. An active interactivity loops xi. Second Order Cybernetics xii. Perceived Finishedness
Design Artifacts
1. Construct for a set of Visual Analytics’ challenges 2. Visual Analytics Design
Phase 2 : Define the objective of the solution
Phase 3: Develop Visual Analytics Design
Step 2: Th eorizing to the design
principles for visual analytics’ solution
Visual analytics roles
Step 1: Th eories to govern the
problem and advise the design theory
Outcomes: Visual Analytics Design
Design Theories Identified Problem
Validated Problem Construction
Activity 3:
Evaluate the proposed Design
Foundations
1. CCA example– Strategy Planning 2. Myerr-Briggs Test Indicator (MBTI) 3. A periodic table of visualization methods
Methodologies
1. Paper based prototyping 2. Focus Group Observation 3. Deductive Qualitative Analysis (DQA)
Design Artifacts
1. Construct for a set of complex-context challenges 2. Visual Analytics Design
4. Visual Analytics Effectiveness
Phase 4: Demonstration
Step 2: Demonstrate the
usefulness of the instrument in the real en vironment
Step 1: Turn the design into
visual analytics instrument
Outcomes: Visual Analytics Effectiveness
Phase 5: Evaluation
Step 2: Design principles
relevancy to handle the complex challenges
Step 1: Results based on
evaluation criteria
3.2. Activity 2 - Develop the Visual Analytics Design
Developing the visual analytics design theory and its principles is the main activity for the design process. The main intention for this activity is to create the solution that serves the identified problem. Thus, the outcomes from the previous activity 1 are pre-cursor in theory and theorizing the solution for the visual analytics’ design theory. Two DSRM phases are required to guide the development of the visual representation design theory: i) Define the objective of the solution and ii) Design and development. The details for each of the phases will be discussed in the following paragraph.
i. Define the Objective of the Solution
The objective of the solution will be define by reflecting the context challenges from the visual analytics perspectives. It is going to be done after knowing the problem from the previous phase. Continuity from the previous phase, this section should answer what are the specific criteria that the solution for the problem defined should meet, what is the possible and feasible solution and how knowledge tools (methods, technologies and theories) are selected and applied to help with defining the objective of the solution. Therefore, in order to understand how the problem can be solve, the research reflected the challenges from visual analytics perspectives. The LR is also used to reflect the identified of the CCA challenges from the visual design point of view.
ii. Theorizing the Visual Analytics Design.
This phase aim to create the visual analytics design as the prime design artifact that is able to solve the identified problem. The important element from the DSRM point of view is the application of methods, technologies and theories to create an artifact that solves the problem. Thus, the visual analytics design is an integrative element from the reflection of challenges, approaches and theories as to perform the solution in handling complex activities challenges. This phase use the theories to theorizing an effective solution. According to [30], theory and theorising have long played an important role and being the central activity in defining the objective of the solution. [31] state that theory and theorising will provide the feasible approach to handle the problem and the output of this activity is a tentative/meta design. During the theories application, we examined each of the challenges in relative isolation while still keeping their necessary relationship as an important aspect of in any complex situation.
3.3. Activity 3 – Evaluate the Proposed of Visual Analytics Design
During this activity, the research should observe and identify how well the visual analytics design is being the solution to resolve the problem by comparing the objectives with observed findings. The practical usefulness of evaluation is also essential since the artifact is new in the explorative mode [32]. In order to do that, this objective needs guidance from the last two phases of DSRM which are demonstration and evaluation as describe below.
11 Beast to Beauty Transition
i. The Demonstration
The demonstration phase is important to gather the users’ context use and then demonstrate the design theory into visual analytics instrument that can be used during the evaluation later. According to [27], demonstration is the process to demonstrate the use of the artifact to prove that the artifact works by solving one or more instances of the problems. The most important part during the demonstration is to explain on the ‘how’ knowledge to use the artifact to solve the problem and further describe how the applicable visual design is workable for users’. However, for this particular study, since the complex situation is context dependent, the demonstration only can take place after the sampling and criterion of the participants have been identified. Therefore by knowing which context to be investigate, then the demonstration can be customised accordingly.
ii. The Evaluation
Based from the activity central point of view, the evaluation should be able to observe how the visual analytics design is able to facilitate the complex analytical process. By taking into account the necessity of sampling and research method based on the activities and processes, the evaluation methods should be able to observe the interactive collective process while the participants performed analytical processes. The method selection for evaluation must balance between the values of freedom of qualitative methods and the control environment for the deductive process. This is because, the investigation of complex phenomena especially when dealing with the activities is not a straightforward process [33]. Even though the criteria of visual analytics is essential for evaluation criteria, the natural settings for activities are also important. Thus, we recommend the qualitative component by observing the activities in a real setting. The evaluation can only take place when the visual analytics instrument as the outcomes from the demonstration is completed. It will act as the control environment during the evaluation process. Based on the unit of analysis, the evaluation need to observe and record the process as an evidence on how the visual analytics instrument would be able to facilitate the process of complex analytical activities.
4 Methods Consideration
Based on LR, there are difficulties to identify the suitable methods for complex visual analytics. The previous researcher faced the difficulties and uncertainties on designing the visual analytics since the guidelines for a complex condition method has already mentioned about the context dependent and natural condition as mentioned by [34,35 36]. Furthermore, the observation for activity-based is seldom to find since the visual analytics field is having more on the evaluation for user-based. Thus, we consider these three methods that suitable for complex condition after going through iterative processes as described in [37].
4.1. Literature analysis to identify the visual analytics context.
Literature analysis method help to emphasize the significant situation/problem within the context that is able to justify the needs for more effective design of visual analytics. The aim of literature analysis is to understand how situation and context environment of complex visual analytics take place and why certain of these processes need to be supported [38]. In appreciating and utilizing the prior knowledge, literature analysis identify the basis of visual analytics context is by reviewing Literature Review (LR). LR seeks previous researches to help the discovery from various fields and perspectives about the context and condition of the visual analytics context. Due to the wide range of complex condition and based Human-Activity Centered Design [17], we suggest, the research to centralize the understanding from the perspective of activities. [39] recommend the understanding from two perspectives; i) design as the context of use and ii) deployment as the processes and activities involve. Since this visualization is concentrating to support and facilitate the human cognitive, it means to understand the background of the complex task, knowledge content and task context in order to have a meaningful, rightfully and able to achieve the visual analytics of cognitive goal.
4.2. Semi Structured Interview to Verify the Challenges.
Semi structured interview is a qualitative method of inquiry that combines a pre-determined set of questions with the opportunity for the interviewer to explore particular themes or responses further. The pre-determined set of questions as an interview guide but the interviewer is flexible to follow topical trajectories in the conversation when it is appropriate. Usually, the semi structured interview will verify the context findings from literature analysis in the real organization settings. The necessity of verification is not only for accountability, but also to expand the understanding of the context of use and activities by getting a deeper understanding about how and why these context, activities and challenges occur in the real complex organizational settings. If occured, then using description and task settings from the participants’ own job perspectives, the research will enrich and expand the description for each of the challenges and how it gives impact to their job and activities. At the end, the semi structured interview expected the construct of challenges as the outcomes.
4.3. The task and setting of semi structured interview
Before the interview, there was a session to introduce the objectives of the interview and to briefly explain about the interview objectives and settings. The interview was divided into initial and main phases. The initial phase of the interview was to get a mutual understanding about the participants’ background and how they relate and perceive the analytical processes in the complex environment. First, the participants described their level of education and working experience. Then, from the working experience, the researcher will pick and discuss any of the analytical processes situations by including and explaining
13 Beast to Beauty Transition
additional facts in the scenario. Finally, by building mutual understanding, indirectly the participants will gain a better understanding of the concept of the analytical processes that the study seeks to investigate. Furthermore, to identify the challenges during the process of analytical settings, the following tasks have been set up during the main phase:
From the example of the scenario in building the mutual understanding above, the participants were asked to give a few examples of recurring problems during the activities. The interviewer then picked one of the problems by relating to the identified challenges found in the LR. All of the participants were giving the space to describe the problem clearly and explained fluently about each of the challenges.
While they are describing that, the participant had been asked further on how to build an understanding for the situation and how to handle it if there are any issues.
Then the process had been captured from the participant’s verbal, participant’s thinking aloud and picking points while describing their job scope.
By seeing the difficulties of the participants to understand the point of the challenges, some of the challenges have been asked a few time by using different examples and scenarios to make sure the participant is able to grab the question and provide the consistent answer.
4.4. The Focus Group Observation
Based from the activity central point of view, the focus group observation methods should be able to observe how the visual analytics is able to facilitate the analytical processes. Using this method, this research was able to observe the interactive collective process while the participants performed analytical process while using visual analytics. The method is selected to balance between the values of freedom of qualitative methods and the control environment for the deductive process. This is because, the investigation of complex phenomena especially when dealing with the activities is not a straightforward process [33]. Even though the visual analytics design is essential for evaluation criteria, the natural settings for activities are also important. Thus, we embed the qualitative component by observing the activities in a real setting for this method.
The focus group observation can only take place when the visual analytics instrument as the outcomes from the demonstration is completed. It will act as the control environment during the evaluation process. During the focus group observation, we only provided two main elements. The first is the goal of the CCA to be performed as a group, and it was based on our early agreement with the participants during the understanding for the context of use. The second was the visual representation instrument that had been derived from the visual analytics demonstration to facilitate the participants.
4.5. The tasks and settings of Focus Group Observation.
Since the main concern is to observe how the visual analytics will affect the analytical processes, the visual analytics design must act as the control environment (instrument) for activities’ facilitation. The design of this study does not limit the freedom of participants to act, think, draw and express their views during the analytical process. From the focus group we would like to observe the feedback loops between participants and the visual representation instrument. Basically the tasks and settings for focus group observation is divided into three divisions: before, during and after the observation. Before the observation, the consent form has been given to each of the participants. After getting the permission, then the research start to demonstrate the visual analytics instrument that is to be used during the focus group activity. During the observation, the usefulness of the instruments will be demonstrated and evaluated. Then, after the observation is the process to manage and analyze the evaluation data to develop valuable findings.
Before the focus group observation is the demonstration of the visual analytics design into the visual analytics instrument. This process will turn each of the principles for the design that has been developed into the workable instrument. Due to the complex condition that is context dependent, the demonstration can only take place after the participants have been identified, then the activity to understand the activity’s context of use and group fit design will be according to the selective participants. During the observation, the usefulness of the instruments will be demonstrated and evaluated. Based on our early agreement with the participants while understanding the context of use, the focus group aimed to perform and solve the analytical goal. The activity lasted around 90-120 minutes, and during that time, the participants in the group of 4-5 people were gathered in the meeting room. The groups were to discuss as in a normal meeting or discussion group as long as they would refer and utilize the provided instruments. Then we observed and recorded the interactivity as an evidence on how the visual structure would be useful to facilitate the complex analytical processes. After the observation, the researcher has discussion with the group to clarify certain findings from the observation and give some time for them to express their view about the activity, instruments and the topic of discussion.
15 Beast to Beauty Transition
5.
Conclusion
The proposed design process is intended to guide the complex visual analytics. Complex in this case is from the perspectives of: i) the information complexities, ii) the nature of the activities involved and iii) the complex environment of visual analytics’ context of usage. By offering more flexible and context dependent approaches, the design process utilizes DSRM as the backbone of the design process. The capabilities of DSRM to play the directive and macro-managing roles let the visual analytics design process be guided on the right path and yet, at the same time, is able to give freedom in designing visual analytics according to its function, quality and context. The balance between guidance and freedom is essential in a visual analytics design process. Being too rigid on the guidance will kill the creativity, ideas and exploration of visual analytics design. However, if it is too loose, then we will go back to square one – no comprehensive guidelines for a visual analytics design process.
Furthermore, using the pragmatic philosophical world view and supported by an exploratory approach, the design process also embedded Human-Activity Centered Design approaches. There are basically three important activities of the design process for complex visual analytics that comprises of five design phases. HCD-ACD gives a new perspective and a better understanding of the users and their activities. Before this, HCD used the concept of asking users what they wanted. The research found this kind of concept burdened the users and was somehow misleading because the users sometimes didn’t know what they wanted. Furthermore, what has been described as what they wanted is actually based on their desires, not on what they needed. Thus, by embedding ACD in understanding the context of use, the research was able to identify the activities, its sequential and the challenges faced during executing the activities in a more consistent manner. From here, the designer or the developer should be able to propose an appropriate solution based on more consistent rationales.
Again, the research highlighted the importance of:
Three main activities of the design process which comprises of five design phases.
Activity 1 is essential as to provide rationales to see clearer roles for a visual analytics solution.
The interconnection between the visual analytics solution as the outcome from activity 2 should be evaluated in activity 3 to justify its relevancy in order to handle the challenges identified in activity 1.
In addition to the evaluation phase, the research sensed the potential of the proposed design process to complement the whole lifeline for visual analytics design. It can guide the visual analytics community especially to move from research to practice – in more real and natural settings. Furthermore, the methods proposed are suitable to evaluate the specific use and natural settings’
perspectives. This is because evaluation for visualization is usually based on experiments and quantitative approaches [40]. Here, we bring some cornerstone to evaluate the visualization in more natural settings and qualitative approaches. Furthermore, the evaluation emphasized the effectiveness of visual analytics design by accessing its usefulness to handle the identified challenges. By offering a sequential set of design process, this research aimed to improve the experience for the visual analytics community to evaluate in a more flexible, dynamic and intuitive way. Hence, the methods proposed are able to bring balance between the environmental control and context of natural settings.
ACKNOWLEDGEMENTS
The authors would like to thank Ministry of Higher Education (MOHE) and Universiti Teknologi Malaysia (UTM) for their educational and financial support. This work is conducted at Advances Informatics School (AIS) under Operation & Business Intelligence Research Group (OBI RG) and funded by Universiti Teknologi Malaysia (GUP PAS: Q.K130000. 2738.02K99).
References
[1] Sedig K. & Parsons, P. 2013. Interaction Design for Complex Cognitive Activities with Visual Representations: A Pattern-Based Approach. AIS Transactions on Human-Computer Interaction 5(2): 84–133.
[2] Johnson, J. 2010. Embracing design in complexity. In Embracing Complexity in Design. Alexiou, K. & Johnson, J. (Eds.). 193–203, Routledge
[5] Thomas, J. J. & Cook, K. A. 2005. Illuminating the Path: The Research and Development Agenda for Visual Analytics. IEEE Computer Society.
[7] Schneiderman, B. 1996. The Eyes Have It: A Task by Data Type
Taxonomy for Information Visualizations. Visual Languages Proceedings IEEE Symposium, 336-343.
[9] Northcote, M. T. 2012. Selecting Criteria to Evaluate Qualitative Research. Education Papers and Journal Articles. Paper 38.
http://research.avondale.edu.au/edu_papers/38 [3 Februari 2015] [10] Chi, E. H. 2000. A taxonomy of visualization techniques using the data
state reference model. IEEE Symposium onInfoVis 2000 Information Visualization, 69-75.
[11] Craft, B., & Cairns, P. 2008. Directions for Methodological research in information visualization. IEEE 12th International Conference of Information Visualisation, 44-50.
17 Beast to Beauty Transition
[12] Moere, A. V. & Purchase, H. 2011. On the Role of Design in Information Visualization. Information Visualization 10(4): 356-371.
[13] Bertschi, S., Bresciani, S., Crawford, T., Goebel, R., Kienreich, W., Lindner, M., Sabol, V. & Moere, A.V. 2011.What is knowledge
visualization? Perspectives on an emerging discipline. Proceedings of the 2011 IEEE Symposium on International Conference of Information Visualisation, 329-336.
[15] Drocourt, Y., Borgo, R., Scharrer, K., Murray, T., Bevan, S. I., & Chen, M. 2011. Temporal Visualization of Boundary‐based Geo‐information Using Radial Projection. Computer Graphics Forum 30(3): 981-990. [14] Sedig, K., Parsons, P., Dittmer, M. & Haworth, R. 2013. Human-Centered
Interactivity of Visualization Tools : Micro- and Macro-level Considerations. in Handbook of Human Centric Visualization. Huang, W. (Ed.). 717-743, Springer New York Business Media.
[16] Chen, M. & Floridi, L. 2013. An analysis of information visualisation: in Synthese. Chen, M. & Floridi, L (Eds.). 190(16): 3421-3438, Springer. [17] Norman, D. A. 2013. The Design of Everyday Things: Revised and
Expanded Edition. Basic Books.
[18] Huang, W. 2014. Handbook of Human Centric Visualization. Springer New York.
[19] Norman, D. A. 1993. Things that Make Us Smart: Defending Human Attributes in the Age of the Machine. Basic Books.
[20] Norman, D. A. 2005. Human-centered design considered harmful.
Interactions 12(4): 14-19.
[21] Sauro, J. Lewis, J. 2012. Quantifying the User Experience. First Edition. Practical Statistics for User Research.
[22] Daud, R. et al, 2018. Critical Factors in Knowledge Communication of Malaysian Public Sector. Journal of Theoritical & Applied Information Technology, 96(1)
[23] Daud, R. et al, 2018. Knowledge Communication Model Between IT Experts and Decision Makers For ICT Project Efficiency in Malaysian Public Services.
[25] Creswell, J. W., Plano Clark, V. L., Gutmann, M. L., & Hanson, W. E. 2003. Advanced mixed methods research designs. Handbook of Mixed Methods in Social and Behavioral Research, 209-240.
[26] Creswell, J., 2009. Research design: Qualitative, Quantitative, and Mixed Methods Approaches. SAGE Publications Incorporated.
[27] Peffers, K., Tuunanen, T., Gengler, C. E., Rossi, M., Hui, W., Virtanen, V. & Bragge, J. 2006. The Design Science Research Process: a Model for Producing and Presenting Information Systems Research. Proceedings of the first international conference on design science research in information systems and technology (DESRIST), 83-106.
[28] Vaishnavi, V. K. & Kuechler Sr, W. L. 2007. Design [science] research in IS—a work in progress. Proceedings of the Second International
Conference on Design Science Research in Information Systems and Technology (DESRIST 2007), 1-17.
[29] Hevner, A. & Chatterjee, S. 2010. Design research in information systems: theory and practice (Vol. 22). Springer Science & Business Media.
[30] Venable, J. 2006. The Role of Theory and Theorising in Design Science Research. Proceedings of the 1st International Conference on Design Science in Information Systems and Technology (DESRIST 2006), 1-18. [31] Walls, J. G., Widmeyer, G. R. & El Sawy, O. A. 1992. Building an
Information System Design Theory for Vigilant EIS. Information Systems Research 3(1): 36-59.
[32] Pfister, R. A. & Eppler, M. J. (2012). The benefits of sketching for knowledge management. Journal of Knowledge Management 16(2): 372-382.
[34] Albers, M. 2010. Usability and Information Relationship: Considering content relationship when testing complex information. in Usability of Complex Information Systems: Evaluation of User Interaction. Albers, M., Still, B. (Eds.). 109-132, CRC press.
[35] Redish, J. 2007. Expanding usability testing to evaluate complex systems.
Journal of Usability Studies 2(3): 102-111.
[39] Briggs, R. O., Kolfschoten, G., Vreede, G. J. D., Albrecht, C., Dean, D. R., & Lukosch, S. 2009. A seven-layer model of collaboration: Separation of concerns for designers of collaboration systems. ICIS 2009 Proceedings
26.
[40] Lam H., Bertini, E., Isenberg, P., Plaisant, C. & Carpendale, S. 2011. Seven Guiding Scenarios for Information Visualization Evaluation Seven Guiding Scenarios for Information Visualization Evaluation. TechReport 2011-992-04. University of Calgary.
![Fig. 1 Two Important Components in Human Centered Design (source: [17])](https://thumb-us.123doks.com/thumbv2/123dok_us/10196761.2922523/5.892.254.638.190.437/fig-important-components-human-centered-design-source.webp)