University of Warwick institutional repository: http://go.warwick.ac.uk/wrap
This paper is made available online in accordance with
publisher policies. Please scroll down to view the document
itself. Please refer to the repository record for this item and our
policy information available from the repository home page for
further information.
To see the final version of this paper please visit the publisher’s website.
Access to the published version may require a subscription.
Author(s): Turgay Celik and Tardi Tjahjadi
Article Title: Image Resolution Enhancement Using Dual-Tree
Complex Wavelet Transform
Year of publication: 2010
Link to published article:
http://dx.doi.org/10.1109/LGRS.2010.2041324
Publisher statement: © 2010 IEEE. Personal use of this material is
permitted. Permission from IEEE must be obtained for all other uses, in
any current or future media, including reprinting/republishing this
material for advertising or promotional purposes, creating new
collective works, for resale or redistribution to servers or lists, or reuse
of any copyrighted component of this work in other works.”
Image Resolution Enhancement Using Dual-tree
Complex Wavelet Transform
Turgay Celik and Tardi Tjahjadi
Abstract
In this letter, a complex wavelet-domain image resolution enhancement algorithm based on the estimation of wavelet coefficients is proposed. The method uses forward and inverse dual-tree complex wavelet transform (DT-CWT) to construct the high-resolution (HR) image from the given low-resolution (LR) image. The HR image is reconstructed from the LR image together with a set of wavelet coefficients using the inverse dual-tree complex wavelet transform (IDT-CWT). The set of wavelet coefficients is estimated from the DT-CWT decomposition of the rough estimation of the HR image. Results are presented and discussed on very high-resolution QuickBird data, through comparisons between state-of-the-art resolution enhancement methods.
Index Terms
Resolution enhancement, image interpolation, dual-tree complex wavelet transform, discrete wavelet transform, satellite image.
I. INTRODUCTION
Image resolution enhancement is a usable preprocess for many satellite image processing applications, such as vehicle
recognition, bridge recognition, and building recognition to name a few. Image resolution enhancement techniques can be
categorized into two major classes according to the domain they are applied in: 1) image-domain; and 2) transform-domain.
The techniques in image-domain use the statistical and geometric data directly extracted from the input image itself [1], [2],
while transform-domain techniques use transformations such as decimated discrete wavelet transform to achieve the image
resolution enhancement [3]–[6].
The decimated discrete wavelet transform (DWT) has been widely used for performing image resolution enhancement [3]–
[5]. A common assumption of DWT-based image resolution enhancement is that the low-resolution (LR) image is the low-pass
filtered subband of the wavelet-transformed high-resolution (HR) image. This type of approach requires the estimationof wavelet
coefficients in subbands containing high-pass spatial frequency information in order to estimate the HR image from the LR
image.
In order to estimate the high-pass spatial frequency information, many different approaches have been introduced. In [3], [4],
only the high-pass coefficients with significant magnitudes are estimated as the evolution of the wavelet coefficients among the
scales. The performance is mainly affected from the fact that the signs of estimated coefficients are copied directly from parent
coefficients without any attempt being made to estimate the actual signs. This is contradictory to the fact that there is very
little correlation between the signs of the parent coefficients and their descendants. As a result, the signs of the coefficients
estimated using extreme evolution techniques cannot be relied upon. Hidden Markov tree (HMT) based method in [5] models
the unknown wavelet coefficients as belonging to mixed Gaussian distributions which are symmetrical about the zero mean.
HMT models are used to determine the most probable state for the coefficients to be estimated. The performance also suffers
mainly from the sign changes between the scales.
The decimated DWT is not shift-invariant and, as a result, suppression of wavelet coefficients introduces artifacts into the
image which manifests as ringing in the neighbourhood of discontinuities [6]. In order to combat this drawback in DWT-based
Manuscript received 21 0ctober, 2009; revised 10 December, 2009; accepted 27 December, 2009. This work was supported by the Warwick University Vice Chancellor Scholarship.
image resolution enhancement, cycle-spinning methodology was adopted in [6]. The perceptual and objective quality of the
resolution enhanced images by their method compare favourably with recent methods [3], [5] in the field.
Dual-tree complex wavelet transform (DT-CWT) is introduced to alleviate the drawbacks caused by the decimated DWT [7].
It is shift invariant and has improved directional resolution when compared with that of the decimated DWT. Such features
make it suitable for image resolution enhancement. In this letter, a complex wavelet-domain image resolution enhancement
algorithm based on the estimation of wavelet coefficients at high resolution scales is proposed. The initial estimate of the
HR image is constructed by applying cycle-spinning methodology [6] in DT-CWT domain. It is then decomposed using the
one-level DT-CWT to create a set of high-pass coefficients at the same spatial resolution of the LR image. The high-pass
coefficients together with the LR image are used to reconstruct the HR image using inverse DT-CWT.
The letter is organized as follows. Section II gives a brief review of the CWT. Section III describes the proposed
DT-CWT domain satellite image resolution enhancement algorithm. Section IV provides some experimental results of the proposed
approach and comparisons with the approaches in [1], [2], [4], and [6]. Section V concludes the letter.
II. DUAL-TREECOMPLEXWAVELETTRANSFORM
The dual-tree complex wavelet transform is a combination of two real-valued decimated discrete wavelet transforms. The
ordinary decimated DWT is shift variant due to the decimation operation exploited in the transform. As a result, a small shift
in the input signal can result in a very different set of wavelet coefficients. For that, Kingsbury [7] introduced a new kind
of wavelet transform, called the dual-tree complex wavelet transform which exhibits shift invariant property and improves
directional resolution when compared with that of the decimated DWT.
The DT-CWT also yields perfect reconstruction by using two parallel decimated trees with real-valued coefficients generated
at each tree. The one-dimensional (1-D) DT-CWT decomposes the input signal f(x) by expressing it in terms of a complex
shifted and dilated mother wavelet Ψ(x)and scaling functionΦ(x), i.e.,
f(x) =X
l∈Z
sj0,lΦj0,l(x) + X
j≥j0 X
l∈Z
cj,lΨj,l(x), (1)
whereZis the set of natural numbers,jandlrefer to the index of shifts and dilations respectively,sj0,lis the scaling coefficient
and cj,l is the complex wavelet coefficient with Φj0,l(x) = Φ
r j0,l(x) +
√ −1Φi
j0,l(x) andΨj,l(x) = Ψ
r j,l(x) +
√ −1Ψi
j,l(x),
where the superscripts r andi denote the real part and the imaginary part, respectively. In the 1-D DT-CWT case, the set
{Φr j0,l,Φ
i j0,l,Ψ
r j0,l,Ψ
i
j0,l} forms a tight wavelet frame with double redundancy. The real and imaginary parts of the 1-D DT-CWT are computed using separate filter banks with filters h0 andh1 for the real part, andg0 andg1 for the imaginary part
[7].
Similar to the 1-D DT-CWT, the two-dimensional (2-D) DT-CWT decomposes a 2-D image f(x, y) through a series of
dilations and translations of a complex scaling function and six complex wavelet functions Ψθ j,l, i.e.,
f(x, y) = X
l∈Z2
sj0,lΦj0,l(x, y) + X
θ∈Θ
X
j≥j0 X
l∈Z2 cθ
j,lΨ θ
j,l(x, y). (2)
where θ ∈ Θ = {±15◦,
±45◦,
±75◦
} provides the directionality of the complex wavelet function. In other words, the decomposition of f(x, y)by exploiting the DT-CWT produces one complex-valued low-pass subband and six complex-valued
high-pass subbands at each level of decomposition, where each high-pass subband corresponds to one unique directionθ.
III. PROPOSEDMETHOD
Let us consider the unknown2H×2W HR image XHand the knownH×W LR imageXL. The aim of the enhancement
is to generate an estimate HR imageXˆHof the unknown HR imageXHusing the known LR imageXL. Let us further assume
that the one-level DT-CWT decomposition of an 2H ×2W image X results in a matrix of DT-CWT(X) = [LPX HPX],
and inverse DT-CWT (IDT-CWT) of [LP
X HPX] reconstructs the signalX perfectly, i.e., IDT-CWT([LPX HPX]) =X. The LPX is a matrix of sizeH×W which is the complex-valued low-pass subband resulting from the one-level DT-CWT
decomposition of image X, and HPX is a matrix of size H ×W ×6 which is the collection of all six complex-valued
(a) (b) (c)
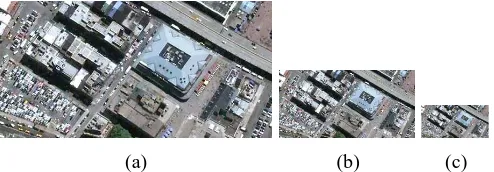
Fig. 1. Reference high-resolution test image and its low-resolution versions obtained by first low-pass filtering and then down-sampling by a sampling factor in both spatial dimensions: (a) Input high-resolution reference image; (b) Low-resolution version of (a) with a sampling factor 2; and (c) Low-resolution version of (a) with a sampling factor 4.
For a given LR image XL, the proposed resolution enhancement method is made up of the following four main steps: 1)
generate the initial estimate (Y) of the HR image; 2) decompose the Y using one-level DT-CWT to create low-pass and
high-pass matrix structure [LPY HPY]; 3) formulate a matrix structure [XL HPY] using [LPY HPY] and the input LR
imageXL; and 4) generate of the HR image by employing the IDT-CWT on [XL HP
Y].
The first step employs the cycle-spinning algorithm [6] in DT-CWT domain to create an initial estimateY of the unknown
HR image.
The second step is the estimation of the high-pass coefficients for the input LR signal XL. The initial estimate Y is
decomposed using the one-level DT-CWT to create one complex-valued low-pass subband and six complex-valued high-pass
subbands with the same spatial resolution as that of XL, i.e., DT-CWT(Y) = [LPY HPY].
In the final step, the input LR image together with the complex-valued high-pass subbandsHPYextracted from the one-level
DT-CWT decomposition ofY are used to create the HR image by employing inverse DT-CWT, i.e.,
ˆ
XH=IDT-CWT([XL HPY]). (3)
IV. EXPERIMENTALRESULTS
In the experiments, the natural colour (R,G, andB), 60 centimeter (2 foot) high-resolution QuickBird satellite image data
is used. The QuickBird data was acquired over Wall Street and the southern tip of Manhattan on April 24, 2009. A test
image of size 256×512 pixel at the resolution of 60 cm are cropped from the raw image as shown in Fig. 1 (a), and is
used as the reference image. In order to obtain a performance metric in addition to visual assessment of the results using
different resolution enhancement methods, we take a256×512image,XH, filter it with3×3averaging (low-pass) filter, and
down-sample it to obtain two available LR imagesX(2)
L andX
(4)
L of sizes 128×256and 64×128pixels, respectively. The available LR images are shown in Fig. 1 (b) and 1 (c). The superscripts 2 and 4 denote the down-sample factor. The resolution
enhancement methods are applied on LR images X(2)
L andX
(4)
L to reconstruct an estimateXˆH of the known HR imageXH. The original HR image XH and the reconstructed HR image XˆH are then compared qualitatively and quantitatively. In this
letter, images consisting of three spectral bands that correspond toR,GandB channels in natural colour image representation,
i.e., XH =nX(R)
H ,X
(G)
H ,X
(B)
H o
, XL =nX(R)
L ,X
(G)
L ,X
(B)
L o
, are used and resolution enhancement methods are applied to
each spectral band of LR image XL independently to reconstruct an estimate of the reference image.
The quality of the resolution enhanced images is estimated using several metrics from the remote sensing community. Let
the reference HR image XH and reconstructed HR imageXˆH be of size H×W pixels and consist of three spectral bands,
i.e., R,G, andB. The following quantitative metrics are used to compareXH andXˆH:
1) Spectral Angle Mapper (SAM) [8]: the average change in angle of all spectral vectors, defined as
SAM= 1
HW X
x,y
arccos
hv(x, y),vˆ(x, y)i ||v(x, y)||2||vˆ(x, y)||2
,
where (x, y) is spatial pixel coordinate, v(x, y) =
v(1)(x, y), v(2)(x, y), v(3)(x, y)
= h
X(R)
H (x, y),X
(G)
H (x, y),X
(B)
H (x, y) i
denotes the spectral vector of the pixel (x, y) in the reference image, and
ˆ
v(x, y) = vˆ(1)(x, y),vˆ(2)(x, y),ˆv(3)(x, y) = hXˆ(R)
H (x, y),Xˆ
(G)
H (x, y),Xˆ
(B)
H (x, y) i
resolution enhancement. The SAM value measures the difference in spectral content between corresponding bands of the
reference and resolution enhanced images, and should be as close to 0 as possible.
2) Spectral Information Divergence (SID) [9]: derived from the concept of divergence arising in information theory and can
be used to measure spectral similarity. SID views each pixel spectrum as a random variable and then measures the discrepancy
of probabilistic behaviours between two spectra. SID is computed as
SID=X
x,y N
X
i=1
v(i)n (x, y) log
vn(i)(x, y)/ˆv(i)n (x, y)
+ˆv(i)n (x, y) log
ˆ
v(i)n (x, y)/v (i) n (x, y)
,
where N is the number of spectral bands, i.e., N = 3, vn(i)(x, y) = v(i)(x, y)/PNj=1v(j)(x, y), and ˆv(i)n (x, y) =
ˆ
v(i)(x, y)/PN
j=1ˆv(j)(x, y). The SID value should be as close to 0 as possible.
3) Quality Index Q4 (Q4) [10]: obtained through the use of correlation coefficient between hypercomplex numbers that represent
spectral vectors. Q4 is made up of different components (factors) to take into account of the correlation: the mean of each
spectral band; the intra-band local variance; and the spectral angle. The highest value of Q4 is 1, which is obtained if and only
if the resolution enhanced image is equal to the reference image.
4) Root Mean Square Error (RMSE): the root mean square error between the reference image and the resolution enhanced
image, i.e., RMSE= v u u t1 N N X i=1
∆X(i)
H ,Xˆ
(i)
H 2
,
where
∆X(i)
H ,Xˆ
(i) H = s 1 HW X x,y X(i)
H (x, y)−Xˆ
(i)
H (x, y) 2
.
The RMSE value should be as close to 0 as possible.
5) Relative Dimensionless Global Error (ERGAS) [11]: the normalized version of the root mean square error designed to
calculate the spectral distortion between the reference image and resolution enhanced image, i.e.,
ERGAS= 100h l v u u t1 N N X i=1
∆X(i)
H ,Xˆ
(i)
H 2
/M2 i,
whereh/lis the ratio between the pixel sizes of the reference HR image and the LR image, and Mi is the mean radiance of
ith spectral band in the reference image. The ERGAS should be as close to 0 as possible.
6) Correlation Coefficient (CC): the correlation between each band of the reference image and the resolution enhanced image,
i.e.,
CC= 1
N
N
X
i=1
P
x,y v(i)(x, y)−v¯(i)
ˆ
v(i)(x, y)−v¯ˆ(i) q
P
x,y v(i)(x, y)−v¯(i)
2P
x,y vˆ(i)(x, y)−¯ˆv(i)
2 ,
where¯v(i) and¯ˆv(i)are the mean values of the corresponding spectral band. The CC value should be as close to 1 as possible. Experiments are conducted to compare the performance of the proposed approach with that of recently proposed methods in
[1], [2], [4], and [6]. We used the authors’ implementations for the methods in [1] and [2], and we implemented the methods
of [4], and [6].
In the first experiment, we test the performance of different methods on enhancing resolution of the input LR image by a
factor 2 in both spatial dimensions. For this, Fig. 1 (a) and Fig. 1 (b) are used as the reference HR image and the input LR
image, respectively. Different resolution enhancement methods are applied to Fig. 1 (b) to estimate the reference HR image as
shown Fig. 1 (a). Fig. 2 show sub-images cropped from the results of different resolution enhancement methods. The spectral
distortions on the enhanced images can be noticed. It can be observed that wavelet-domain methods achieve better visual
(a) (b) (c)
[image:6.612.185.427.294.374.2](d) (e) (f) (g)
Fig. 2. Results of spatial resolution enhancement with a factor of 2 in both spatial dimensions: (a) Reference HR image; (b) Input LR image; (c) Resolution enhanced image using [1]; (d) Resolution enhanced image using [2]; (e) Resolution enhanced image using [4]; (f) Resolution enhanced image using [6]; and (g) Resolution enhanced image using the proposed method.
TABLE I
SPECTRAL QUALITY METRICS FORFIG. 2USING DIFFERENT RESOLUTION ENHANCEMENT METHODS.
CC ERGAS Q4 RMSE SAM SID Reference values 1.0000 0.0000 1.0000 0.0000 0.0000 0.0000 Method of [1] 0.9328 6.1660 0.5988 32.5969 1.5672 0.0139 Method of [2] 0.9347 6.0853 0.6081 32.1702 1.4752 0.0137 Method of [4] 0.9796 3.4987 0.8415 18.4968 0.9468 0.0115 Method of [6] 0.9668 4.4009 0.7689 23.2654 1.0250 0.0111 Proposed method 0.9814 3.3302 0.8702 17.6056 0.8437 0.0116
calculated for different methods, and the results are shown Table I. It is clear that, the values of the metrics get closer to the
optimal when using the proposed method.
In the second experiment, the resolution enhancement methods are applied twice to the LR input image as shown in Fig. 1
(c) to test their performances when the spatial resolution enhancement factor is 4 in both spatial dimensions. The subjective
results are shown in Fig. 3 and the corresponding quantitative results computed using the aforementioned metrics are shown
in Table II. The spectral deformations resulted from using the spatial-domain methods are apparent. Such deformations are
reduced by employing the wavelet-domain methods. Furthermore, it is clear that the proposed resolution enhancement method
shows better performance than that of the other methods.
We compare the computation times required by each of the image resolution enhancement methods in generating the HR
image using the input LR image as shown in Fig. 1 (c) on a laptop which is operated by 32-bit Windows Vista with 2GHz
Intel(R) Core(TM)2 Duo CPU, and 2GB RAM. The methods presented in this paper are implemented in MATLABTM. It takes 52, 39, 90, 4 and 10 seconds for the methods in [1], [2], [4], [6], and the proposed method, respectively, to produce
the resultant HR image. The method in [4] has the highest computational cost due to its multiscale data processing, while the
proposed method has a moderate computational cost.
V. CONCLUSION
A method for image resolution enhancement from a single low-resolution image using the dual-tree complex wavelet is
presented. The initial rough estimate of the high-resolution image is decomposed to estimate the complex-valued high-pass
wavelet coefficients for the input low-resolution image. Estimated complex wavelet coefficients are used together with the
input low-resolution image to reconstruct the resultant high-resolution image by employing inverse dual-tree complex wavelet
transform.
Extensive tests and comparisons with the state-of-the-art methods show the superiority of the method presented in this letter.
(a) (b) (c)
[image:7.612.180.429.291.373.2](d) (e) (f) (g)
Fig. 3. Results of spatial resolution enhancement with a factor of 4 in both spatial dimensions: (a) Reference HR image; (b) Input LR image; (c) Resolution enhanced image using [1]; (d) Resolution enhanced image using [2]; (e) Resolution enhanced image using [4]; (f) Resolution enhanced image using [6]; and (g) Resolution enhanced image using the proposed method.
TABLE II
SPECTRAL QUALITY METRICS FORFIG. 3USING DIFFERENT RESOLUTION ENHANCEMENT METHODS.
CC ERGAS Q4 RMSE SAM SID Reference values 1.0000 0.0000 1.0000 0.0000 0.0000 0.0000 Method of [1] 0.9090 7.9112 0.4096 36.9070 1.9310 0.0125 Method of [2] 0.9085 7.8361 0.4126 37.0248 1.8312 0.0124 Method of [4] 0.9073 5.2569 0.3962 37.1817 1.8243 0.0125 Method of [6] 0.8965 6.2643 0.4024 39.4043 1.9426 0.0166 Proposed method 0.9389 4.7915 0.5615 30.8993 1.3558 0.0129
REFERENCES
[1] X. Li and M. Orchard, “New edge-directed interpolation,” IEEE Trans. Image Proc., vol. 10, no. 10, pp. 1521–1527, Oct 2001.
[2] L. Zhang and X. Wu, “An edge-guided image interpolation algorithm via directional filtering and data fusion,” IEEE Trans. Image Proc., vol. 15, no. 8, pp. 2226–2238, Aug 2006.
[3] W. K. Carey, D. B. Chuang, and S. S. Hemami, “Regularity-preserving image interpolation,” IEEE Trans. Image Proc., vol. 8, no. 9, pp. 1293–1297, 1999.
[4] S. Chang, Z. Cvetkovic, and M. Vetterli, “Locally adaptive wavelet-based image interpolation,” IEEE Transactions on Image Processing, vol. 15, no. 6, pp. 1471–1485, Jun 2006.
[5] K. Kinebuchi, D. D. Muresan, and T. W. Parks, “Image interpolation using wavelet-based hidden markov trees,” in Proc. IEEE Int. Conf. Acoust. Speech
and Signal Process., 2001, pp. 1957–1960.
[6] A. Temizel and T. Vlachos, “Wavelet domain image resolution enhancement using cycle-spinning,” Electronics Letters, vol. 41, no. 3, pp. 119–121, Feb 2005.
[7] N. Kingsbury, “Complex wavelets for shift invariant analysis and filtering of signals,” J. Appl. Comput. Harmon. Anal., vol. 10, no. 3, pp. 234–253, 2001.
[8] L. Alparone, S. Baronti, A. Garzelli, and F. Nencini, “Landsat etm+ and sar image fusion based on generalized intensity modulation,” IEEE Transactions
on Geoscience and Remote Sensing, vol. 42, no. 12, pp. 2832–2839, Dec 2004.
[9] C.-I. Chang, “Spectral information divergence for hyperspectral image analysis,” in Proceedings of IEEE International Geoscience and Remote Sensing
Symposium, vol. 1, 1999, pp. 509–511.
[10] L. Alparone, S. Baronti, A. Garzelli, and F. Nencini, “A global quality measurement of pan-sharpened multispectral imagery,” IEEE Geoscience and
Remote Sensing Letters, vol. 1, no. 4, pp. 313–317, Oct 2004.
[11] L. Wald, “Quality of high resolution synthesized images: Is there a simple criterion?” in Proceedings of International Conference on Fusion of Earth
![Fig. 2.Results of spatial resolution enhancement with a factor of 2 in both spatial dimensions: (a) Reference HR image; (b) Input LR image; (c) Resolutionenhanced image using [1]; (d) Resolution enhanced image using [2]; (e) Resolution enhanced image using [4]; (f) Resolution enhanced image using [6]; and(g) Resolution enhanced image using the proposed method.](https://thumb-us.123doks.com/thumbv2/123dok_us/9701477.471367/6.612.185.427.294.374/resolution-enhancement-dimensions-resolutionenhanced-resolution-resolution-resolution-resolution.webp)
![Fig. 3.Results of spatial resolution enhancement with a factor of 4 in both spatial dimensions: (a) Reference HR image; (b) Input LR image; (c) Resolutionenhanced image using [1]; (d) Resolution enhanced image using [2]; (e) Resolution enhanced image using [4]; (f) Resolution enhanced image using [6]; and(g) Resolution enhanced image using the proposed method.](https://thumb-us.123doks.com/thumbv2/123dok_us/9701477.471367/7.612.180.429.291.373/resolution-enhancement-dimensions-resolutionenhanced-resolution-resolution-resolution-resolution.webp)
