University of Wisconsin Milwaukee
UWM Digital Commons
Theses and DissertationsMay 2017
Large Scale Integration of Electric Vehicles into the
Power Grid and Its Potential Effects on Power
System Reliability
Mingzhi Zhang
University of Wisconsin-Milwaukee
Follow this and additional works at:https://dc.uwm.edu/etd Part of theElectrical and Electronics Commons
This Thesis is brought to you for free and open access by UWM Digital Commons. It has been accepted for inclusion in Theses and Dissertations by an authorized administrator of UWM Digital Commons. For more information, please [email protected].
Recommended Citation
Zhang, Mingzhi, "Large Scale Integration of Electric Vehicles into the Power Grid and Its Potential Effects on Power System Reliability" (2017).Theses and Dissertations. 1562.
LARGE SCALE INTEGRATION OF ELECTRIC VEHICLES INTO THE POWER GRID AND ITS POTENTIAL EFFECTS ON POWER SYSTEM
RELIABILITY
by Mingzhi Zhang
A Thesis Submitted in Partial Fulfillment of the Requirements for the Degree of
Master of Science in Engineering
at
The University of Wisconsin-Milwaukee May 2017
ABSTRACT
LARGE SCALE INTEGRATION OF ELECTRIC VEHICLES INTO THE POWER GRID AND ITS POTENTIAL EFFECTS ON POWER SYSTEM
RELIABILITY
by Mingzhi Zhang
The University of Wisconsin-Milwaukee, 2017 Under the Supervision of Professor Lingfeng Wang
In this thesis, the potential effects of large scale integration of electric vehicles into the power grid are discussed in both the beneficial and detrimental aspects. The literature review gives a comprehensive introduction about the existing smart charging algorithms. According to the system structure and market mechanism, the smart charging algorithms can be divided into centralized and distributed method. With the knowledge of driving patterns and charging characteristics of electric vehicles, both the centralized and decentralized smart charging algorithms are studied in this research.
Based on the smart charging pricing and sequential price update mechanism, a multi-agent based distributed smart charging algorithm is used in this research to flatten the load curve and therefore mitigate the potential detrimental effects caused by uncoordinated charging. Each EV agent has some extent of intelligence to solve its own charging scheduling problem. The optimization method used in this
research is the binary hybrid GSA-PSO algorithm, which combines the merits of particle swarm optimization (PSO) and gravitational search algorithm (GSA), and has very good exploration and exploitation abilities. A V2G enabled centralized smart charging algorithm is also introduced in this thesis, each EV can earn
resolve the “curse of dimensionality” problem existing in the centralized
optimization problems. Numerical case studies show both the distributed and V2G enabled smart charging algorithms can effectively transfer the charging load from the peak load period to the load valley hours.
Because of the limited integration ratio of electric vehicles, most power system reliability methods do not evaluate the charging load of EVs separately in their analytical procedures. However, with a fast increasing integration level, the potential effects of large scale integration of EVs on the power system reliability should be comprehensively evaluated. The effects of EV charging on power system reliability in the planning phase is analyzed in this research based on the RBTS. The results show the uncontrolled charging will deteriorate the reliability level while the smart charging can effectively decrease the detrimental effect. The potential application of aggregated EV providing operating reserve to the grid as a kind of ancillary service is also discussed, and the related effects on power system reliability in operating phase are calculated using the modified PJM method. The case study shows the unit commitment risk of the system can decrease to a very low level with the additional operating reserve capacity provided by aggregated EVs, which can not only improve the system’s reliability level but also save the cost.
c Copyright by Mingzhi Zhang, 2017 All Rights Reserved
TABLE OF CONTENTS
Abstract . . . ii
List of Tables . . . viii
List of Figures . . . ix
1 Introduction 1 1.1 Research background . . . 1
1.2 Benefits of large scale integration of EVs . . . 2
1.2.1 Economic Benefits . . . 2
1.2.2 Environmental Benefits . . . 3
1.3 Adverse impacts of large scale integration of EVs into the power grid 4 1.3.1 Increased peak load demand . . . 5
1.3.2 Power quality issues . . . 5
1.4 Smart charging and its potential effects on power system reliability . 7 1.5 Research objectives and thesis structure . . . 8
2 Smart charging control of EVs 9 2.1 Literature review of smart charging algorithms . . . 9
2.1.1 Centralized charging control . . . 9
2.1.2 Decentralized charging control . . . 13
2.2 The driving and energy characteristics of EVs . . . 15
2.2.2 Charging characteristic of EVs . . . 17
2.2.3 The energy need of EVs’ charging . . . 19
2.3 Distributed smart charging algorithm . . . 19
2.3.1 Smart charging pricing mechanism . . . 19
2.3.2 Sequential charging price update mechanism . . . 21
2.3.3 Problem formulation . . . 22
2.3.4 Binary hybrid GSA-PSO optimization algorithm . . . 23
2.4 V2G enabled smart charging algorithm . . . 28
2.4.1 Problem formulation . . . 28
2.4.2 Intelligent PSO algorithm . . . 31
2.5 Numerical study . . . 33
2.5.1 Distributed smart charging control . . . 33
2.5.2 V2G enabled smart charging control . . . 37
3 The effects of large scale integration of EVs into the grid on power system reliability 40 3.1 Power system reliability analysis introduction . . . 40
3.1.1 Methods of reliability evaluation . . . 41
3.1.2 Generating system reliability analysis . . . 43
3.1.3 Reliability indexes . . . 44
3.2 Reliability analysis of generating system with sequential MCS method 46 3.3 The effect of EV charging on power system reliability . . . 48
4 Power system reliability analysis with EV providing operating re-serve 52 4.1 Operating reserve . . . 52
4.2 PJM and Modified PJM method for unit commitment risk analysis . 55 4.3 Capacity estimation of EV providing operating reserve . . . 58
4.3.1 Interruptible charging capacity . . . 59
4.3.2 V2G capacity . . . 60
4.4 Analysis procedures . . . 61
4.5 Numerical study . . . 62
5 Conclusion and future work 68
LIST OF TABLES
2.1 Charging characteristics of representatives PHEVs and EVs . . . 20
2.2 Base load of the test system without EVs charging. . . 33
2.3 Comparison of peak and valley load with different charging algorithms. 35 3.1 Reliability indexes of generating units in RBTS . . . 49
3.2 Weekly peak load as a percentage of annual peak load . . . 49
3.3 Daily peak load as a percentage of weekly peak load . . . 50
3.4 Hourly peak load as a percentage of daily peak load . . . 50
3.5 Reliability index of the test system under different load scenarios. . . 51
4.1 RBTS Priority loading order. . . 63
4.2 COPT for the scheduled 7 generating units. . . 63
4.3 Hourly peak load as a percentage of daily peak load . . . 64
LIST OF FIGURES
2.1 Centralized control architecture. . . 10
2.2 Decentralized control architecture. . . 13
2.3 Percentage of vehicles versus departure time. . . 16
2.4 Percentage of vehicles versus arrival time. . . 17
2.5 Daily driving mileage probability. . . 18
2.6 A multi-agent based distributed smart charging control architecture. . 22
2.7 Adaptive parameters of accelerating factors. . . 27
2.8 Transfer function for binary optimization. . . 27
2.9 Schematic diagram of dominant search matrix. . . 32
2.10 The convergence curves of 20 agents in the BPSOGSA. . . 34
2.11 System load with 100 EVs under different charging control algorithms. 35 2.12 System load with 1000 EVs under different charging control algorithms. 36 2.13 System load with 3000 EVs under different charging control algorithms. 36 2.14 System load with 3000 EVs under different charging control algorithms. 37 2.15 The charging price for different charging control algorithms. . . 38
2.16 Net charging load of aggregated 3000 EVs. . . 39
3.1 Hierarchical levels of power system reliability assessment . . . 41
3.2 Total reliability cost of the system . . . 42
3.3 Two states model of generating unit . . . 44
3.5 6 Bus Roy Billinton Test system . . . 48
3.6 Load variation of the test system in a year . . . 51
4.1 The response of reserves in a contingency event. . . 54
4.2 Area risk curve of the system. . . 58
4.3 System base load of the designed test system. . . 62
4.4 Operating reserve capacity provided by 3000 EVs in test day. . . 65
4.5 Four-state representative model of the rapid start unit. . . 66
ACKNOWLEDGMENTS
I would like to thank my supervisor Professor Lingfeng Wang for his help, guidance and encouragement during my study in UWM. Professor Wang’s professionalism, patience and dedication to the research have a profound influence on my career path. His humor, wisdom and attitudes also enlightened me about the essence of life. I fell very proud and grateful to have a chance to do research under his supervision.
I would like to thank Professor Chunlin Guo from North China Electric Power Uni-versity for the patient guidance and training in the early stage of my research. I would also like to thank Professor David Yu and Professor Xiao Qin for acting as the committee members.
I would like to thank senior students Jun Tan and Yingmeng Xiang for so many times’ discussions, their experiences and suggestions are valuable for this research work.
Finally, I would like to thank my parents, Haoqun Zhang and Weihua Gao, without their continuing encouragement and support, it’s hard to imagine I could go as far as now on the academic path.
Chapter 1
Introduction
1.1
Research background
Large-scale electric vehicles and plug-in hybrid vehicles (EVs and PHEVs) integration into the power and transportation system has been envisioned for the first half of the 21st century. Sales number of EVs and PHEVs begin to grow rapidly after 2015 and is estimated to reach 7 million per year by 2020, and 100 million by 2050 [1], According to the statistical data from Electric Drive Transportation Association(EDTA), 2.99% of the U.S. automotive market is contributed by EVs and PHEVs by 2016, there are 580,569 plug-in vehicles sold in US since 2010 [2].
There are mainly three different types of electric vehicles: battery electric vehicle (BEV), hybrid electric vehicle (HEV), and plug-in-electric vehicle (PHEV) [3]. Battery electric Vehicles (BEVs) use battery-powered motor, they run exclusively on electric power via on-board batteries, which can be charged by plugging into the electric power system through different methods. EV use electric motor and therefore do not use gasoline at all. The Nissan LEAF, Fiat 500e, Chevrolet Bolt and Tesla Series fall into this category. Hybrid Electric Vehicles (HEVs) can use both electric power and gasoline, the battery on board is charged with regenerative braking and
internal combustion engine. Unlike BEVs and PHEVs, HEVs can not be plugged into the grid for charging. Because this research focus on the interaction between vehicles and power system, HEVs are not considered in this research. Plug-in Hybrid Electric Vehicles (PHEVs) also can use both gasoline and electric power stored in on board battery. Different with the HEVs, the battery can be charged by plugging into power grid. Because PHEVs can run with both gasoline and electricity, it’s suit for long distances driving if the charging station’s availability is unknown.The Chevy Volt, Toyota Prius, BMW i8, Audi A3 E-Tron fall into this category. In this thesis, the electric vehicles (EVs) mean battery electric vehicle (BEV) or plug-in-electric vehicle (PHEV).
The large scale integration of EVs into the power grid can lead to potential issues including power unbalance, power losses increase, voltage deviation, etc [4]. However with properly coordinated control, it can greatly minimize those adverse impacts. The flexibility of EVs in both time and spatial scale can also be resources, which makes it capable for taking multi-roles in the power system. It can be load (charging), energy storage system (ESS), and power source (discharging). Compared with the conventional thermal generating units, large amounts aggregated vehicle batteries nearly do not have startup cost or shutdown cost at all when discharging power to the grid [5], which make it suitable for responding the fluctuations in power system caused by high ratio integration of renewable energy.
1.2
Benefits of large scale integration of EVs
1.2.1
Economic Benefits
The economic benefits of EV can be observed from EV owners and the power grids perspectives. For the EV owners, the costs are comparatively less than the traditional internal combustion engine (ICE) because of the high efficient electric
motors. The typical efficiency of ICE is 15-18%, however the efficiency of EV can be as high as 60-70% [6]. In recent years, the developments of battery technologies have already greatly improved the life time, performance indexes and economics metrics of batteries [7]. However, the prices of EV now are still much higher than ICE vehicles. In fact, the price can be significantly reduced by mass production and clean energy trading policies. Some companies like Tesla are making progress on this direction.
Meantime, the integration of electric vehicles into the power grid can bring many potential opportunities, such as the vehicle-to-grid (V2G) technology could be a solution for the stochastic, uncertain issues of renewable energy [8]. The concept of V2G shows EV owners can earn profits by transferring their EV battery from load to energy storage systems, even distributed generation sources with proper market and control mechanism. Kim et al. [9] showed EV’s characteristics of fast dynamic response can be used to enable buildings to compensate for the high-frequency compo-nents of load demand variations, and its effective in reducing the frequency deviations and required reserve capacity. Aghaei et al. [10] discussed the importance of plug-in vehicles and their problems and investigated their potential applications as mobile storages for the integration of RESs and demand response programs. Sioshansi and Denholm [11] showed an EV fleet can reduce the cost of power system by $200-$300 per year per vehicle. By using EVs, it can improve residential customers’ competitive positions in demand response programs and can help decreasing the negative impacts of EVs’ charging.
1.2.2
Environmental Benefits
The large scale integration of EVs is recognized as one of the most promis-ing solutions to air pollution and carbon dioxide emission. The impacts of massive adoption of PHEVs on greenhouse gas (GHG) emissions reduction was investigated in [12] for Los Angeles. PHEVs’ effects on GHG emissions are dependent on type and
scale of generation sources, adoption rate, and charging behavior. Donateo et al. [13] put forward a method that use measured data of electric consumption to quantify its emissions of CO2 and pollution, by using Italian electricity production mix of each recharging event and the emissions factors of the Italian power plants, this research showed the EVs have advantages in CO2, carbon monoxide, nitrogen oxide emissions. Well-to-wheels (WTW) analysis on electric vehicles (EVs) have been used ex-tensively to evaluate the potential energy and environmental effects, Ke et al. [14] collected up-to-date data concerning the electricity generation mix, fuel transport, end-of-pipe controls, real-world fuel economy and emissions, the WTW energy
con-sumption andCO2and air pollutant emissions for various light-duty passenger vehicle
technologies currently (2015) and in the mid-term future (2030) are estimated. The
results showed the WTW CO2 emissions by EVs should approach to 100 gkm−1 by
2030 due to the increased integration ratio of renewable clean electricity, even lower than that of hybrid electric vehicles.
The environmental impacts of electric cars depend on the source of electricity. The increasing integration ratio of renewable energy can promote further reduction of pollutant emissions. For the city of Athens during 2012-2020, by using a penetration scenario of 10% biodiesel, 10% natural gas and 10% electricity to the energy mix of the vehicle fleet, Nanaki et al. [16] showed by using biodiesel, natural gas and EVs can
decrease the CO2 emissions by 21.1% compared to 2012’s level and N Ox by 57.2%.
1.3
Adverse impacts of large scale integration of
EVs into the power grid
Although with all the merits introduced in last section, the large scale integra-tion of EVs into the existing power system may cause a lot problems, the analysis of
potential adverse impacts and specific solutions are critical to not only the safe and reliable operation of power system but also the long term development of EVs.
1.3.1
Increased peak load demand
Various studies have been done about the impact of EVs’ charging on grid peak load demand. The potential peak power and energy demand by the integration of electric vehicles are examined for the city of Perth, Western Australia in [17]. This research showed the uncoordinated charging with a high EV penetration ratio can cause the peak demands surpassing the generating system capacity on average days. Smart charging and time-of-use (TOU) tariff plan can significantly reduce the peak demand, so the optimization of charging and discharging behaviors of EVs is based on given variations in electricity spot prices, user preferences and driving patterns, then it can avoids the extra generation capacity expansion [18].
1.3.2
Power quality issues
A stable power grid is critical for the reliable power supply. The characteristics of EV charging loads are different from the traditional household or industrial loads, therefore, the effects of EV charging loads on grid power quality [19, 20, 21, 22, 23] have been extensively analyzed.
Gmez and Morcos [19] investigated the impacts of harmonic distortion caused by EV chargers on distribution system, especially on transformers. This proposed method can be used to determine the optimal charging time according to the base load, ambient temperature, and time. This study also showed that uncoordinated direct charge can be detrimental to the transformer life, especially under high tem-perature and large load scenarios. A probabilistic harmonic simulation method are put forward in [21] to study the power quality impacts of EVs. The random and stochastic characteristics of the vehicles, such as charging begin time, charging
dura-tion, and locations are taken into the Monte-Carlo simulation process. A harmonic current source model was used to model the harmonic characteristics of EV charger, the results showed that Level 1 charger may cause the rise of neutral to earth voltage, which could lead to stray voltage incidents.
A similar stochastic modeling and simulation technique are used in [22] to analyze the impacts of EVs’ charging demands on distribution network. Different from the probabilistic method, the feeder daily load models, electric vehicle start charging time, and battery state of charge used are derived from actual measurements and survey data. A modified IEEE 13-bus test system and a 25-bus Taiwan Power Company (TPC) distribution system were used for numerical analysis, the Monte Carlo simulations and roulette wheel selection concept were used to simulate the uncertainties of SOC and charging time. This study showed the stochastic approach can present significant risk information by determining many under-voltages and over-currents cases.
The impacts of EV charging on residential low voltage distribution network in Malaysia are analyzed in [23] in aspects of voltage profile, voltage unbalance and transformer thermal limit. The results showed that distribution networks can safely operate at 10% penetration ratio with uncontrolled charging, and smart charging can increase the penetration ratio to 60% without adverse impact on distribution system voltage. Razeghi et al. [20] focused on the impacts of plug-in hybrid electric vehicles on a residential transformer using both stochastic and empirical analysis, the hot spot temperature and loss of life of transformer are calculated based on a thermal model. The results showed the transformer might fail due to excessive temperatures with Level 2 charging. By proper design and using smart charging control, the negative effects on the life time of transformer can be greatly mitigated.
1.4
Smart charging and its potential effects on
power system reliability
As discussed in last section, large scale integration of EVs may cause lots of problems like increased peak load, power quality issues, power losses and transformer loss of life. Increasing the investment on the update of existing distribution network is one option, however, a more economical choice is to reduce the bad effect with smart charging control, it can greatly minimize those adverse impacts. Kiviluoma and Meibom [24] calculated that smart charging can save 227 Euro per year per vehicle compared with immediate uncontrolled charging. Most of the benefits come from smart timing of charging and providing reserves. Kara et al. [25] estimated the potential benefits of smart charging by collecting data from more than 2000 non-residential electric vehicle supply equipments (EVSEs) in Northern California for the year of 2013. The results showed that the smart charging control of aggregated electric vehicles can decrease the contribution to system peak load by approximately 37%.
Smart charging change the traditional role of EV as passive load in the distri-bution network, instead it seeks to achieve active control of EVs for certain objectives, such as reduce the peak load, minimize the generation costs or operation losses. Sys-tem costs and peak demand can be further reduced by the integration of renewable energy.
Controlled smart charging can decrease the system costs and peak demand compared with uncontrolled charging, meantime the plug-in electric vehicles’ char-acteristics of controlled charging rate providing a fast and economic way to balance the supply and load demand. Compared with the method of using fast-responding natural gas turbines, this method can potentially reduce the operation costs and the construction of new power plants [26]. Meantime, the V2G technology allows aggre-gated EV to play the roles of energy storage systems and distributed generators in
the system, so it can therefore provide different kinds of ancillary services [27, 28] (frequency regulation, spinning reserve, demand side response), which are valuable for power system with high ratio of renewable energy integration.
The effects of smart charging on power system reliability become a hot topic in recent years. Liu et al. [29] used a bidirectional charging control algorithm and combined the EV charging with the generation system adequacy. The results showed the smart charging control can effectively improve power generation adequacy. Xu and Chuang [30, 31] used the well-being analysis framework to analyze the power system generating system reliability with electric vehicles charging considered. However, because of the relatively low integration ratio now, the research in this area is still lacking.
1.5
Research objectives and thesis structure
This research focus on analyzing the potential impacts of large scale integration of electric vehicles into the power grid, the benefits and potential adverse effects are mainly discussed in Chapter 1. The methods for modeling the charging behaviors of EVs and the existing smart charging algorithms are introduced in Chapter 2, then two different smart charging algorithms are used in this research to coordinate the stochastic charging behaviors of EVs. The potential effects of large scale integration of EVs on power system reliability are analyzed in Chapter 3 and 4. The potential application of aggregated EVs providing operating reserve is also discussed in Chapter 4. The conclusion and future work are in Chapter 5.
Chapter 2
Smart charging control of EVs
2.1
Literature review of smart charging algorithms
The power and capacity level of a single EV is small, in order to achieve the economic and technical advantages in the energy and ancillary services bidding market, a unique market entity is needed to coordinate the charging behaviors of large amount of EVs. The role of aggregator [5, 32, 33] is introduced by some literatures, it contracts a significant number of EVs and works as an interface between the end users and energy market. The capacity of aggregator is determined by the controlled number of EV and the flexibility of each car, which depends on users’ behaviors and preferences. With the aggregator, the smart charging can be implemented in two different control architectures, centralized and decentralized control methods. The functions and roles of aggregator will be variant under different architectures.
2.1.1
Centralized charging control
For the centralized control architecture, aggregator can directly control the charging behaviors of each cars. By collecting the historical data and users’ pref-erences, the aggregator can predict its daily energy need and controllable capacity.
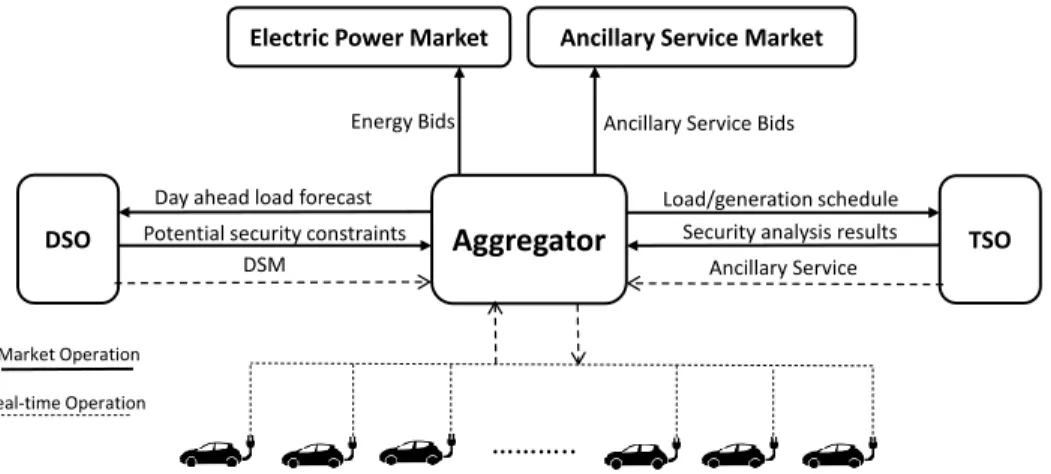
The forecast of energy need will be evaluated by the distribution system operator for system security. The time scale may be variant under different markets and operation situations, usually the aggregator will bid into the day-ahead electricity market for its energy need. The transmission system operator will also evaluate the potential effects on the transmission system. If all security based criteria are met and biddings cleared, the aggregator can achieve the charging control objective and provide the needed an-cillary service by providing real time charging set points for each controlled EV, the whole process is shown in Fig. 2.1. The aggregator will also monitor the real-time operation of connected EVs and collect related information, like the identification, state of charge (SOC) and user preference settings. A wide range of algorithms with different objectives have been discussed in literatures.
Aggregator
DSO TSO
Load/generation schedule Day ahead load forecast
Security analysis results Potential security constraints
Electric Power Market Ancillary Service Market Energy Bids Ancillary Service Bids
………..
DSM Ancillary Service
Market Operation Real-time Operation
Figure 2.1: Centralized control architecture.
Coordinated charging
Han et al. [5] proposed an aggregator based market mechanism, which use the distributed electric vehicles to provide frequency regulation services to the grid by determining the charge schedule of each EV. The author pointed out when a vehicle battery is charged, it plays a role as the load to the grid which directly affect the frequency regulation control process if under a high EV penetration scenario. If the
load suddenly disappear (or adjusted) when the frequency regulation control is trying to achieve the delicate balance between power generation and load, it would affect the control loop. Aggregator will decides the charging rate, charging sequence, and duration to maximize the revenue, a dynamic-programming method is used to find the optimal charge schedule. Sortomme and El-Sharkawi [34] presented a similar charge control algorithm, which could take part into the frequency regulation by changing
the charging set points. The aggregator controls the charging behaviors of each
EV according to its capacity, the regulation up or down are achieved by simulating the decrease or increase of load. Wu et al. [35] put forward a centralized control framework. A minimum-cost load scheduling algorithm is designed to determine the amount of energy purchased in the day-ahead market, which is based on the forecast electricity price and EV power demands. Then a dynamic dispatch algorithm is developed to distribute the purchased energy to different EVs on the operating day. The impacts of aggregated EV load on the distribution grid is also studied.
V2G enabled smart charging
The literatures in last section focus on the control of charging schedule and charge rate, so the power flow is still unidirectional. Power flow is possible in both directions with the V2G technology. EV can provide more flexibility, but simultaneous charging and discharging of an EV battery is not allowed. Meantime, the battery degradation caused by discharging should be carefully evaluated.
Tan and Wang [36, 37] put forward a two-layer evolution strategy particle swarm optimization (ESPSO) algorithm to integrate PHEVs into a residential distri-bution grid, which is based on a stochastic model of PHEV. A novel business model is developed for PHEVs to provide ancillary service and participate in peak load shav-ing. The virtual time-of-use rate is used to influence the charging behaviors. The objective function includes the peak load shaving, power quality improvement,
charg-ing cost, battery degradation cost and frequency regulation earncharg-ings. Sortomme and El-Sharkawi [38] developed a V2G algorithm to optimize the energy and ancillary services scheduling. This algorithm maximizes the profits of aggregator by providing additional system flexibility and peak load shaving to the utility and low prices for EV charging. A hypothetical group of 10 000 commuter EVs in the ERCOT system were simulated, the results showed significant benefits for customers and aggregator. Khodayar et al. [39] coordinated the integration of aggregated plug-in electric vehicle (PEV) with renewable energy (wind energy) in power systems by stochastic security-constrained unit commitment (SCUC) model. The objective is to minimize the ex-pected grid operation cost with the random behavior of PEVs considered. Customers’ random behaviors of driving patterns, locational energy requirements, topological grid interconnections, and other constraints imposed by consumers are considered. The numerical case showed PEVs can help reduce the grid operation cost by providing en-ergy storage for renewable enen-ergy resources. Jin et al. [40] studied the coordination of EV charging scheduling problem with Energy Storage (ES) from an electricity market perspective, with joint consideration of aggregator’s energy trading in the day-ahead and real-time markets. The author pointed ES can be utilized by aggregator to mit-igate the impacts of uncertainty and inaccurate prediction. A Mixed Integer Linear Programming (MILP) model as well as a simple polynomial-time heuristic based LP rounding are proposed to get optimal solutions. Tan and Wang [41, 42] proposed a hierarchical framework for plug-in hybrid electric vehicles to participate in frequency regulation in a deregulated market. At the upper level of the game, the competition between aggregators are formulated as a non-cooperative game. Markov game is then used to coordinate the charging behaviors of PHEVs at the lower level. The Markov game will optimize the regulation capacity bidding in the upper level game.
2.1.2
Decentralized charging control
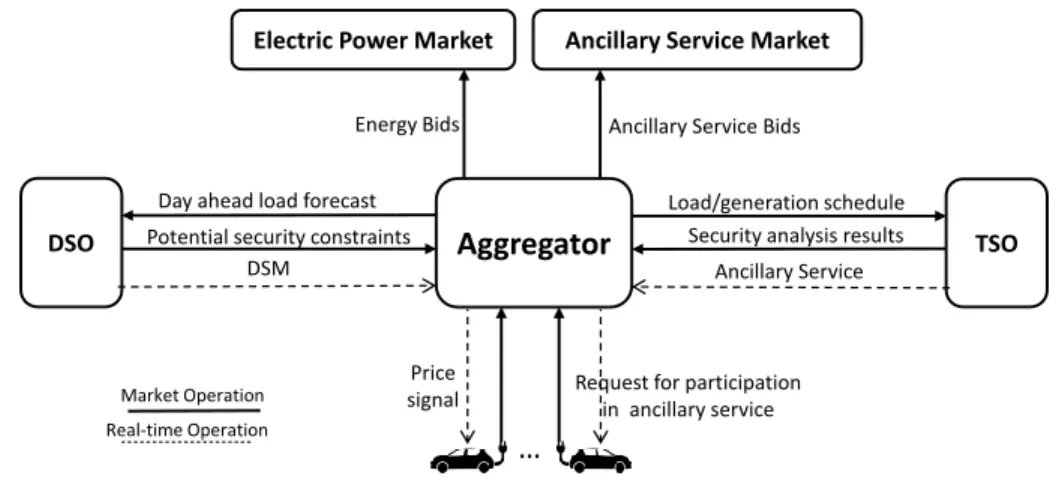
Decentralized control is also known as indirect control, each EV has some level of intelligence and communication abilities to make charging decisions to achieve its own maximum benefits. Meantime, the aggregator can use price signal to influence the charging and discharging behaviors of EV. The system architecture is shown in Figure 2.2.
Aggregator
DSO TSO
Load/generation schedule Day ahead load forecast
Security analysis results Potential security constraints
Electric Power Market Ancillary Service Market
Energy Bids Ancillary Service Bids
…
DSM Ancillary Service
Market Operation Real-time Operation
Price
signal Request for participation in ancillary service
Figure 2.2: Decentralized control architecture.
Coordinated charging
Ma et al. [43] proposed a decentralized charge scheduling algorithm for a large number of EVs using the mean field game. The social optimality was achieved by establishing a PEV charging schedule that transfer the charging load to the night demand valley. The aggregator broadcasts the prediction of base demand to all EV agents, then each EV makes its own charging schedule decision that minimize its cost. In the third step, each EV modify its charging plan according to the new aggregated charging demand. Steps 2 and 3 are repeated until each EV has no incentives to change its strategy. The implementation issues and computational complexity were also discussed. Gan et al. [44] proposed a similar decentralized charge scheduling al-gorithm for EVs to fill the electricity valley demand. The objective is to minimize the
charge cost of the EVs within the targeted charging deadline. This work is different with [43], EVs updating their charging profiles according to the control signal, which is used by the utility company to influence the charging behaviors. This algorithm only requires each EV solve its own optimization problem, which has the benefit of low computation capability requirements. Wen et al. [45] used a charging selection concept for EVs to maximize user convenience levels while satisfying demand con-straints. The convex relaxation optimization tool was used to reduce the complexity of the problem and to get the close-to-optimal solutions. A distributed optimization algorithm is also proposed in this research to solve the charging selection problem, which only needs each vehicle’s power demand rather than private user state infor-mation, so this method can mitigate the increasing security and privacy concerns.
The idea of multi-agent system is also introduced in the EV smart charging control [47, 48, 49]. Karfopoulos and Hatziargyriou [48] proposed a distributed, multi-agent based EV charging control algorithm, which bases on Nash Certainty Equiva-lence Principle. Convergence of this method is discussed when EVs’ control agents are in both uncoupled and weakly-coupled methods. The MAS system is developed in the Java Agent Development Framework (JADE). Logenthiran and Srinivasan [49] used the method of decentralized Multi-Agent System (MAS), a hybrid algorithm which combines Evolutionary Algorithm (EA) and a Linear Programming (LP) was used to manage the power distribution system with PHEVs. Simulation results showed the MAS approach is a scalable and robust decentralized methodology which can adapt incomplete and unpredictable information.
V2G enabled smart charging
The interactions among EVs and aggregators in the market for frequency regu-lation are studied by Wu et al. [50] using a new game-theoretic model. A pricing policy is used to encourage EVs to participate in frequency regulation, then a decentralized
control mechanism is proposed to guarantee the achievement of Nash Equilibrium in interactions between vehicles and aggregator. Fan [51] proposed a distributed framework for demand response and user adaptation in smart grid. The concept of congestion pricing in Internet traffic control was borrowed and the pricing informa-tion was proved to be useful to regulate the user demand. Ota et al. [52] proposed an autonomous distributed V2G control scheme, which could provide spinning reserve according to the frequency deviation. He et al. [53] proposed a global optimal schedul-ing scheme and a local optimal schedulschedul-ing scheme for EV chargschedul-ing and dischargschedul-ing. In the global scheduling optimization, the charging powers are optimized to minimize the total cost of all EVs. Although the global optimal solution can achieve global minimal total cost, its impractical because the uncertain and stochastic information like the arrival time, charging periods of EVs are needed. So the author formulated a local scheduling optimization problem, which aims to minimize the total cost of the EVs. The outcomes showed the local optimal scheduling scheme can achieve a close performance compared with the global one.
2.2
The driving and energy characteristics of EVs
2.2.1
Driving pattern of EVs
The charging behaviors of EVs are greatly determined by the driving pat-terns, which will determine when, where and how much energy needed for charging. A typical driving pattern often starts at leaving home for work in the morning, having lunches at noon, backing to home at afternoon or maybe a short trip to the supermar-ket. Although the destinations and trips are very different for each car, the average daily mileage can be determined according to the probabilistic survey method [54], which is roughly 26 Miles.
Another important dataset for the simulation of driving patterns is National Household Travel Survey (NHTS) 2009 [55], which provides comprehensive
informa-tion about the travel and transportainforma-tion patterns in the United States. Data is
collected from daily trips, which is taken in a 24-hour period and includes some im-portant aspects like travel time, time of day when the trip took place, trip lengths, etc.
For the simulation of EV driving patterns, the time in a day when the trip takes place is defined as the departure time, the time in a day when EV arrives home is defined as the arrival time and the total drive distance in a day is defined as mileage. So according to the statistical data, the percentage of vehicles during different periods is shown in Figure 2.3, the similar one about the percentage of arrival time is shown in Figure 2.4.
Figure 2.3: Percentage of vehicles versus departure time.
It is assumed the driving patterns of large amount of EVs will follow the statistical pattern, therefore the probability distribution functions of arrival time, departure time and mileage can be get from the survey data. As the figure of departure time shows, it follows the normal distribution:
Fd(t) =
e−(t−µ)/2σ2
σ√2π , 0< t <24 (2.1)
Figure 2.4: Percentage of vehicles versus arrival time.
Similarly, the probability distribution function of arrival time is expressed as:
Fa(t) =
e−(t−µ)/2σ2
σ√2π , 0< t <24 (2.2)
where µ=17.01, σ=3.2
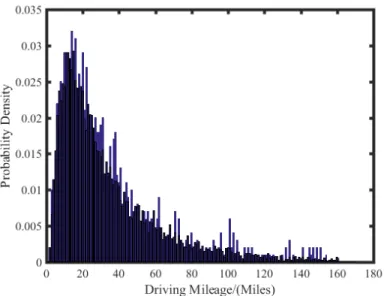
The distribution of daily mileage can be described by a lognormal distribution function, which is shown in Figure 2.5, which is expressed as follows:
Fm(d) =
e−(lnd−µ)/2σ2
σd√2π (2.3)
where d is the travel distance, unit is mileage. µ=3.2 is the mean value of lnd and
σ=0.9 is the standard deviation value of this lognormal distribution function.
2.2.2
Charging characteristic of EVs
According to the charging capacity and charging methods, there are generally three kinds of charging methods [56]:
Level 1 slow charging is the most common method for electric vehicles charging. Level 1 charging usually use 120 V, AC plug, which can be standard household outlet. A full charge typically taking 8 to 12 hours, overnight charging at home is the most common type of charging cycle. Nearly all electric vehicle can be slow charged with
Figure 2.5: Daily driving mileage probability.
the appropriate connectors and cables. This kind of charging method has a relatively small charging power, so there is no need for EV owners to update the existing distribution feeder, however, with the increasing penetration rate, it may cost failures in the distribution network because of their variability and uncertainty.
Level 2 charging usually through a 240V, AC plug, which usually through installed home charging equipments or public charging stations. Level 2 charging is compatible with nearly all electric vehicles, the time for a full charge typically taking 4 to 6 hours.
Three are mainly two types of fast charging, rapid AC and DC charging. Rapid AC chargers provide a high power three phase AC supply. An electric vehicle can be charged to 80% in less than half an hour. Rapid DC chargers charges through a 480V, direct-current (DC) plug. The Tesla supercharger by consisting multiple chargers working together can deliver up to 120kW power. Both the rapid AC and DC charging methods are designed to meet the urgent charging need, which have very high power charging rate, so specific charging facilities and feeder lines are needed to guarantee its operation. The expensive of fast charging limit its application scale, so it mainly located at areas with high transportation rate.
2.2.3
The energy need of EVs’ charging
Because of EV owner’s mileage anxiety, it is reasonable to assume each EV owner will charge the battery to a full status before leaving for work next morning. And for the same reason, the minimum SOC is set to be 20%, which is also helpful
for the battery lifetime. The all electric range (AER) of the electric vehicle is Dm.
The electricity energy consumption of EV is proportional to the daily mileage, so the SOC of EV when arriving home is
SOCarrival = (1−D/Dm)×100%, 0< D <0.8Dm (2.4)
The energy needed for charging after arriving home is:
Er= 1
ηCEV ·(1−SOCarrival) (2.5)
whereηis the energy efficiency of charging equipment,CEV is the capacity of battery.
2.3
Distributed smart charging algorithm
2.3.1
Smart charging pricing mechanism
As analyzed before, one of the big problems of large scale EVs integration is the increased peak load, which may exceeds the existing generating capacity. Meantime, the increased peak load may also cause some detrimental effects on the transformer in the distribution system [20].
Smart charging control and time-of-use (TOU) tariff plan can significantly reduce the peak demand, so the optimization of the charging behaviors of EV is based on given variations in electricity prices, user preference and driving patterns, which can also avoid the extra generation capacity expansion [18]. A real time dynamic
Table 2.1: Charging characteristics of representatives EVs [57]. Toyota Prius PHEV Chevrolet Volt PHEV Nissan Leaf BEV Tesla Roadster BEV Battery Capacity 4.4 kWh 16 kWh 24 kWh 53 kWh
All-electric Range 14 Miles 40 Miles 100 Miles 245 Miles
Connector Type SAE J1772 SAE J1772 SAE J1772
JARI/TEPCO
SAE J1772 Level 1 Charging
Rate
1.4 kW 0.96-1.4 kW 1.8 kW 1.8 kW
Charging Time 3 hours 5-8 hours 12-16 hours 30+ hours
Level 2 Charging Rate
3.8 kW 3.8 kW 3.3 kW 9.6-16.8 kW
Charging Time 2.5 hours 2-3 hours 6-8 hours 4-12 hours
Level 3 DC Fast Charging Rate
N/A N/A 50+kW N/A
Charging Time N/A N/A 15-30 minutes N/A
pricing mechanism [37] is used in this research to reduce the peak load of the system, the charging price is changed with the system load, their relation is defined as:
λ(t) =β1+β2·α P t
d−Pa
Pa (2.6)
wherePt
d is the system load demand (including EV charging load) at time t,Pa is the
average load demand and β1, β2, α are price parameters, which are set as 0.1, 0.2 and
10 in this research. This smart charging price policy is sensitive to the load demand, when the system load increase, the charging price will also increase, especially during the peak load period.
2.3.2
Sequential charging price update mechanism
Each EV is an independent agent, which has the communication ability and intelligence to make decisions according to the existing information. When the EV agent is connected with the grid, it firstly enter into a planning queue. The relative positions of different agents in the queue are based on their connection time, which follows the policy of first come, first served. The EV agent on the top of planning queue receives the pricing signal from the aggregator agent, solves its own charging scheduling problem, report its charging schedule to the aggregator agent and then leaves the planning queue. The aggregator agent will keep updating the charging price information based on each EV agent’s charging schedule and the system load.
Using this sequential charging price update mechanism, the charging prices only need to be updated for a single EV agent on the top of the planning queue, and the effect is only transmitted to the next EV agent in the queue. The communication requirements and computation complexity can be greatly reduced in contrast with the centralized control method, which needs updating control signals simultaneously for all EVs.
With the increasing integration ratio of renewable energy into the power sys-tem, the stochastic and intermittent nature of renewable energy will bring a lot of challenges on the system planning and safety, the stochastic nature of uncontrolled charging may make things worse. However, at the same time, the flexibility of EV can also be resources and solutions for the intermittency.
The distribution system operator (DSO) will monitor the system base load, EV charging and renewable energy generation, the potential violations of technical constraints, and contingencies. If technical constraints are violated, the DSO will require the aggregators in the control area to respond accordingly, for example, cut the charging load of aggregated EVs at current time step. The aggregator will then send an emergency signal to all connected EVs, the EV agent will enter into a reschedule
queue, similar with the planning queue. Each EV agent will solves its own charging scheduling problem for the remaining period before the departure based on its own energy needs and charging price information. Once solved, EV agent will leave the reschedule queue. The aggregator will update the charging price according to the updated charging schedules and required amount of charging load curtailments. The whole system architecture is shown in Figure 2.6.
Aggregator Agent 1
Charging price Charging schedule
Charging scheduling queue
Aggregator Agent n
Charging price Charging schedule
Charging scheduling queue
…
DSO Agent
Figure 2.6: A multi-agent based distributed smart charging control architecture.
2.3.3
Problem formulation
The time horizon of EV charging is determined by the EV’s arrival time and
departure time. For theith EV, the time it arrives home is assumed to be the plug-in
time ti,in, which doesn’t means the start of charging. The departure time of EV is
assumed to be the time when the connector is plugged out, so the plug-out time is
ti,out. The energy need Er,i can be derived from Equation 2.5.
The behaviors of EV are controlled at two different status: charging and idle.
The control sequence for EV i during the connected period can be expressed as:
Ki = h Ktin i ,· · ·K t i · · ·K tout i i (2.7) where Kt
i=1 means the ith EV is charging at time t, Kit=0 means the EV is in idle
The total energy required of the ith EV can be expressed as Equation 2.8, which is also the energy constraint that smart charging algorithm must meets.
Er,i = tout,i
X
t=tin,i
Ki·Pi (2.8)
where Pi is the charging rate of ith EV.
The related cost of charging for a EV is:
CostC = T X
t=1
PEV,Ct ·C(t)·λ(t) (2.9)
where λ(t) is the charging price for ith EV, which comes from the combination of
smart charging pricing mechanism and sequential charging price update mechanism. The objective of each EV is to minimize its own charging cost, the constraint is the total energy requirement. By combining two different pricing mechanisms, the aggregator can affect the charging behaviors of EV through price signal, which is closely related with the real time load. So the distributed smart charging control is achieved by the combination of each vehicle’s charging optimization problem, the problem solving is discussed in next section.
2.3.4
Binary hybrid GSA-PSO optimization algorithm
As mentioned in last section, the optimization problem of each vehicle’s charg-ing schedule is the key for the distributed smart chargcharg-ing algorithm. The GSA-PSO hybrid optimization method is used for this problem, which combines the gravitational search algorithm (GSA) and particle swarm optimization (PSO). Because EV’s charg-ing schedulcharg-ing is a discrete optimization problem, so the hybrid continuous GSA-PSO algorithm is modified into a binary optimization method.
The hybrid method PSOGSA was first proposed in 2010 [58], the performance has been proved in the optimization problems solving. The search for optimization is
still done by the agents in the PSO, which is modified to mimic the agents’ behavior in the GSA. So this hybrid method can use both the social thinking of PSO and the exploitation ability of GSA. The social thinking of PSO can alleviate the slow exploitation rate, which is the main drawback of the GSA.
Each search agent has a position vector, which reflects the agent’s current position in search spaces:
Xi =
x1i,· · ·, xdi, i= 1,2,3,· · ·, N (2.10)
whered is the dimension of the problem, xd
i is the position of the ith agent in thedth
search dimension, N is the number of search agents.
The idea of gravitational force are borrowed form GSA, firstly the euclidian distance and the gravitational constant between two search agents are defined as:
Dij(t) = r h x1 i (t)−x1j(t) i2 +hx2 i (t)−x2j(t) i2 +· · ·+hxd i (t)−xdj(t) i2 (2.11) G(t) = G0·exp(−α·citer/miter) (2.12)
whereG0is the initial gravitational constant,αis the descending coefficient andciter
is the current iteration number, miter indicates the maximum iterations number.
The force between agent j on agent i at a specific time t can be defined as:
Fi,jd (t) = G(t)Maj(t)Mpi(t)
Dij(t) +ξ h
xdj(t)−xdi (t)i (2.13)
whereG(t) is the gravitational constant value att, Maj(t) is the active gravitational mass of agenti,Mpi(t) is the passive gravitational mass of agent i,Dij is the euclidian
So for a search space with a dimension of d, the total forces on agentiat time
t can be calculated as:
Fid(t) = N X
j=1
Fi,jd (t)·rand (j 6=i) (2.14)
where rand is a random number, which is generated by an uniform distribution in
the interval of [0, 1].
With the total forces on an agent, the Newton’s Second Law of Motion-Force
and Acceleration is used to calculate the acceleration of agenti, which is proportional
to the net force acting upon and inversely upon the mass of the object.
adi (t) = Fid(t)/Mi(t) (2.15)
where Mi(t) is the inertial mass of agenti.
In the GSA, the weight of agent is calculated by the fitness function, which directly affect its movement. The agent with better fitness value will have bigger masses, then it will move slowly. For the GSA, during the process of agents moving towards the optimal point, the masses of agent will become heavier and heavier. In the final steps of iterations, the agents near the optimal point have almost same mass. According to the Newton’s Second Law of Motion-Force and Acceleration, they gravitational forces between different agents are nearly same, which makes the movement speeds of agents very slow. However, combined with the PSO, the best
solution so far is saved as gbest, which can guide the heavy agents move toward the
optimal point, so the velocity update function which combines PSO and GSA is:
Vi(t+ 1) =Vi(t)·rand+β1·adi (t) +β2·[gbest−Xi(t)] (2.16)
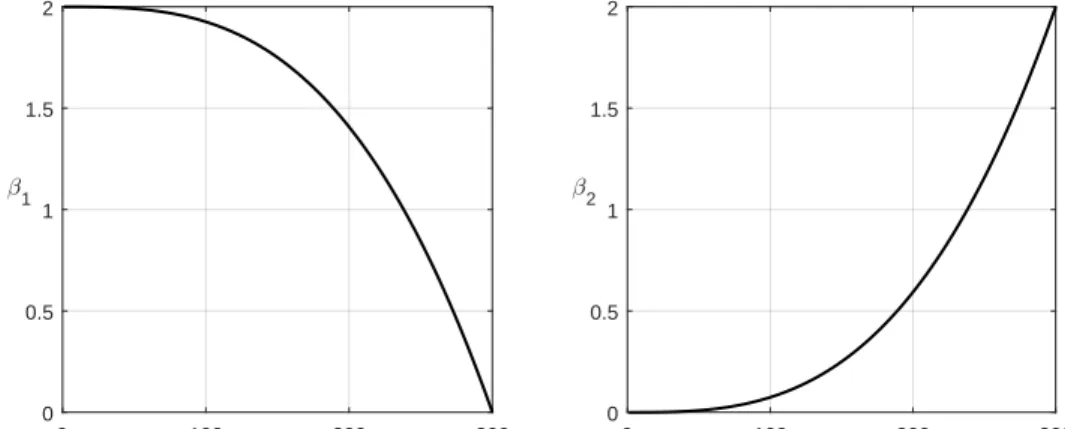
However, adding the gbest to the velocity vector will weaken the exploration in the early period of optimization, because it establishes a permanent element of velocity updating, so an adaptive method is used to change the accelerating factors
β1, β2 adaptively during the iteration, the variations are shown in Figure 2.7.
β1 =−2(citer)3/(miter)3+ 2
β2 = 2(citer)3/(miter)3
(2.17)
During the iteration process, the update function of agent’s position is:
Xi(t+ 1) =Xi(t) +Vi(t+ 1) (2.18)
So the whole procedures can be summarized as:
Step 1: Generate initial population, set the initial positions, velocities, masses and gravitational constant G0.
Step 2: Calculate the fitness value for each agent.
Step 3: Update the G with Equation 2.12 and gbest.
Step 4: For each agent, calculate all gravitational forces using Equation 2.14, cal-culate the acceleration with Equation 2.15, update its velocity and location with Equation 2.16 and Equation 2.18.
Step 5: Repeat the Step 2-4 until satisfying the stop criterion
Step 6: Return the value of gbest.
In order to solve the binary optimization problem, the agent’s position update function needs to be modified. A transfer function map the velocities to the prob-ability for updating the positions, so the range of the function should be [0,1] and
0 100 200 300 Iteration 0 0.5 1 1.5 2 1 0 100 200 300 Iteration 0 0.5 1 1.5 2 2
Figure 2.7: Adaptive parameters of accelerating factors.
increases with the velocity. The transfer function used in this research is S[Vi(t)], which is shown in Figure 2.8.
S[Vi(t)] = |tanh(Vi(t))| (2.19) -10 -8 -6 -4 -2 0 2 4 6 8 10 V(t) 0 0.1 0.2 0.3 0.4 0.5 0.6 0.7 0.8 0.9 1 S[V(t)]
The velocities of agents are transferred to the probabilities of position update, so the agent’s position update function is:
If S[Vi(t)]> rand, then Xi(t+ 1) = 1−Xi(t)
else Xi(t+ 1) =Xi(t)
(2.20)
Compared with the GSA, the BPSOGSA has better exploitation ability be-cause of the introduction of the social behaviors in PSO, which enables more accurate exploit around the best agent obtained so far. Meantime the intrinsic nature of GSA, where searching agents have impacts on each other during the whole iteration process is different with the PSO that only the local best and global best means.
At the same time, the adaptive parameters design of β1 and β2 making the
algorithm has better exploration ability in the initial iterations. Then the exploitation ability increase during the iteration process to find the global optimal point. This mechanism can help the optimization searching process avoiding the local optimal points and accelerating the convergence speed towards the global optimal point.
2.4
V2G enabled smart charging algorithm
2.4.1
Problem formulation
The mathematical model is similar with the decentralized smart charging al-gorithm in last section. The time horizon of EV charging is determined by the EV’s
arrival time and departure time. For theith EV, the time it arrives home is assumed
to be the plug-in timeti,in, which doesn’t means the start of charging, the departure
time of EV is assumed to be the time when the connector is plugged out, so the
plug-out time is ti,out. The energy need Er,i can be get from Equation 2.5.
The behaviors of EV at this scenario are controlled at three different status:
con-nection period can be expressed as: Ki = h Ktin i ,· · ·K t i · · ·K tout i i (2.21) where Kt
i=1 means the ith EV is charging at time t, Kit = −1 means the ith EV is
discharging at time t and Kit=0 means the EV is in idle status.
The total energy required of the ith EV can be expressed as Equation 2.22,
which is also the energy constraint that the smart charging algorithm must meets. Pi
is the charging rate of ith EV.
Er,i = tout,i
X
t=tin,i
Ki·Pi (2.22)
The status vectorsCi andDi are used to separately indicate the charging and
discharging status of each vehicle, which are defined as:
Ci = h Ctin i ,· · ·C t i,· · ·C tout i i , Cit= 1, 0, if kt i = 1 otherwise (2.23) Di = h Dtin i ,· · ·D t i,· · ·D tout i i , Dti = 1, 0, if kt i =−1 otherwise (2.24)
The total charging power of n EVs is illustrated as:
PEV,Ct = n X
i=1
Ci·Pi (2.25)
The related cost of charging is:
CostC = T X
t=1
where λ(t) is the real time charging price get from Equation 2.6, which is closely related with the system load.
The total discharging power of n EVs is illustrated as
PEV,Dt =
n
X
i=1
Di·Pi (2.27)
The total energy discharge during the whole time is
ED = n X i=1 ti,out X t=ti,in Di·Pi (2.28)
The related revenue of discharging is
EarnD = T X
t=1
PEV,Ct ·D(t) (2.29)
When it comes to discharging, the problem of battery degradation needs to be carefully analyzed. Chenke et al. [59] built a mathematical model for the cost of EV battery degradation because of V2G. Combined with manufacturer’s data, the results
showed theDoD and ambient temperature are two most significant influence factors
on the battery life. However, because of the ambient temperature is a stochastic vari-able, so a simplified model is used in this research, the cost of battery degradation [60] is expressed as:
DegD =
cb ·Eb+cL
Lc·Eb ·DoD
ED (2.30)
where cb is the unit capacity cost for battery, $/kWh, Eb is the capacity of battery,
cL is the labor cost for the replacement of battery, Lc is the battery life cycle times
at a predefined level of DoD,DoD is the depth of discharge, it refers to the an ratio
between the absolute discharge and the rated battery capacity. It’s hard to directly
get the real operational data ofDoD, so the (1−SOC) is used to represent theDoD
Equation 2.28. In this research, the cb, cL are set as 300 $/kWh and 240 $, theLc is set as 5000 at 80% discharge [61].
The objective function of this optimization problem is minimizing the total cost, which can be represented as:
min(CostC +DegD −EarnD) (2.31)
2.4.2
Intelligent PSO algorithm
For the centralized optimization architecture, the aggregator needs collect in-formation about each EV, finds the optimization point and directly sends control signal to each vehicle. So if the aggregator controls a large number of EVs, like thou-sands, the search space for this optimization will be very large and falls into the curse of dimensionality. Meantime, the frequent status switching between charging and discharging will greatly reduce the life time of battery [61], so the control sequence should be wisely arranged.
Based on this presumption, the search space is simplified by using the
dom-inant solution matrix. Based on different V2G strategies, the control sequences Ki
are classified into different patterns. For a single EV, firstly it can choose a row from the dominant matrix [37], which stands for different V2G patterns, then the starting point of the row will determine the specific control sequence of the EV. The schematic diagram of dominant search matrix is shown in Figure 2.9.
So it’s basically a two layers evolution PSO optimization algorithm, the opti-mal V2G strategy is firstly set on the upper level, then based on that strategy the optimal control sequence is find in the lower level. Each EV is a dimension in the search space, the sequence starting point is mapped as the variable number in that dimension, the evolving process is guided by the following equations:
1 1 1 1 0 0 0 0 0 0 0 0 …
1 1 1 1 1 -1 0 0 0 0 0 0 …
1 1 1 1 1 0 -1 0 0 0 0 0 …
1 1 1 1 1 0 0 -1 0 0 0 0 …
1 1 1 1 1 0 0 0 -1 0 0 0 …
1 1 1 1 1 0 0 0 0 -1 0 0 …
1 1 1 1 1 0 0 0 0 0 -1 0 …
1 1 1 1 1 0 0 0 0 0 0 -1 …
…
1 1 1 1 1 1 -1 -1 -1 -1 0 0 …
1 1 1 1 1 1 0 -1 -1 -1 -1 0 …
1 1 1 1 1 1 0 0 -1 -1 -1 -1 …
1 1 1 1 1 1 0 0 0 -1 -1 -1 …
1 1 1 1 1 1 0 0 0 0 -1 -1 …
…
Figure 2.9: Schematic diagram of dominant search matrix.
KEin=Kin+ωN(0, σd) (2.32) Kin+1 = KEin, if cost(KEin)< pbestn Kin, otherwise (2.33) ω =ωmax−n ωmax−ωmin nmax (2.34)
Vin+1 =σVin+β1 rand1(pbesti−Xin) +β2 rand2(gbest−Xin) (2.35)
Xin+1 =Xin+Vin (2.36)
where Kn
i is the original V2G strategy, the KEin is the evolved one, ω is the inertia
weight, n is the iteration number, i is the ith particle agent. The velocity Vin and
position Xn
2.5
Numerical study
As introduced before, the level 1 charging has a slow charge speed, usually take 8-12 hours for a full charge, Level 2 charging equipment is compatible with all electric vehicles and plug-in electric hybrid vehicles, the time for a full charge typically take 4 to 6 hours. As the battery capacity and energy density increases, the Level 2 charging will be more popular with customers. So in this research, it assumes all electric vehicles will return home for charging and use the Level 2 charging method, the charging rate is set as 3.3kW. In the V2G enabled smart charging algorithm, all charging equipments are considered to have the capabilities of discharging energy into the grid and metering, the discharging rate is set as the same as charging rate.
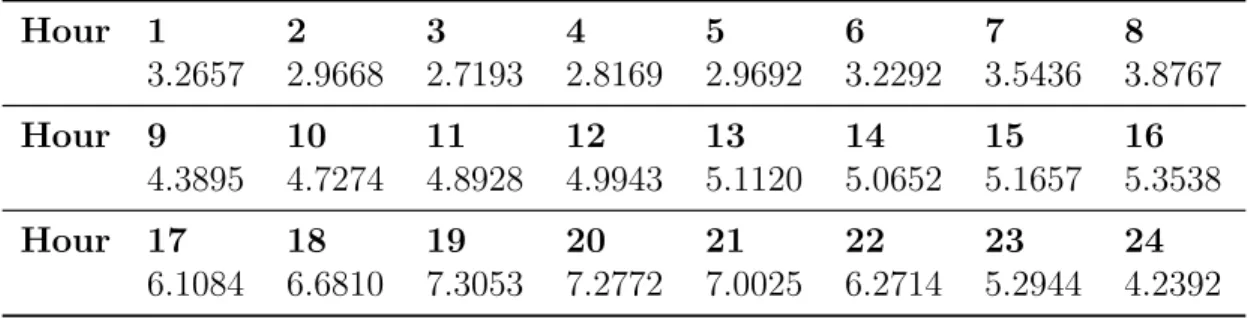
In order to show the effect of EVs’ charging on system and the performance of proposed smart charging algorithms, a test system is designed for the numerical analysis, the load without EV charging in each hour is shown in Table 2.2.
Table 2.2: Base load of the test system without EVs charging (Unit:MW).
Hour 1 2 3 4 5 6 7 8 3.2657 2.9668 2.7193 2.8169 2.9692 3.2292 3.5436 3.8767 Hour 9 10 11 12 13 14 15 16 4.3895 4.7274 4.8928 4.9943 5.1120 5.0652 5.1657 5.3538 Hour 17 18 19 20 21 22 23 24 6.1084 6.6810 7.3053 7.2772 7.0025 6.2714 5.2944 4.2392
2.5.1
Distributed smart charging control
For the distributed charging control algorithm, each EV agent has some level of intelligence to make decisions about its own charging schedule with the known system information, so the complexity and computation burden of this optimization problem must be well handled. So for this problem, after several experiments, the number of agents in the binary hybrid GSA-PSO optimization method is set as 60.
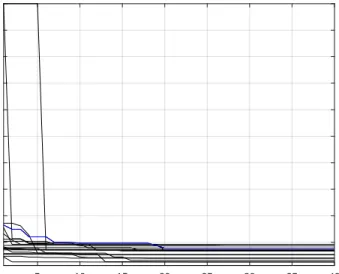
The convergence curve of agents in this algorithm is shown in Figure 2.10, the fitness value of agent is the charging cost of each EV agent. As the figure shows, all agents can converge to the optimal point very rapidly after 20 iterations, so in order to improve the computation efficiency, the maximum iteration number is set as 40.
5 10 15 20 25 30 35 40 Iteration 100 200 300 400 500 600 700 800 900 1000 Average Best-so-far
Figure 2.10: The convergence curves of 20 agents in the BPSOGSA.
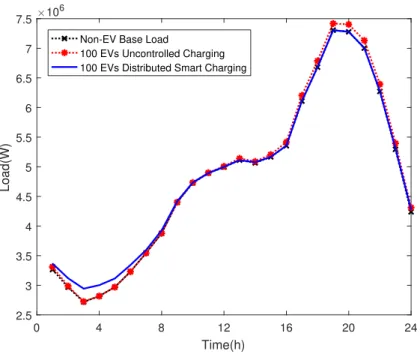
With the same charging control algorithm, the integration ratio of electric vehicles will have a determining effect on the system load. When the EV number is relatively small, like 100 in Figure 2.11, the uncontrolled charging method will slightly increase the system peak load and the effect of smart charging is not so evident. So under a low integration rate, the existing distribution network doesn’t need upgrade.
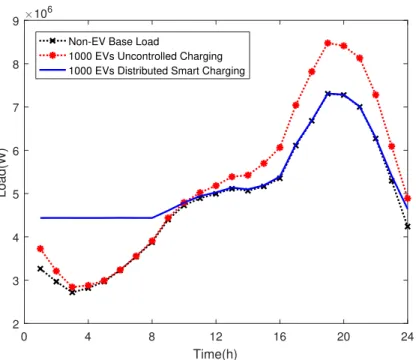
However, when the number of EV increased to 1000 as the Figure 2.12 shows, the uncontrolled charging under this scenario can increase the system peak load to nearly 11MW at 9 pm. The purpose of this smart charging algorithm is flattening the load curve, so the peak load nearly keep the same, the existing charging needs are transferred to the night valley hours. Compared with the system base load, we can find the charging load start to increase after 10 pm and mainly concentrate on the
0 4 8 12 16 20 24 Time(h) 2.5 3 3.5 4 4.5 5 5.5 6 6.5 7 7.5 Load(W) 106
Non-EV Base Load
100 EVs Uncontrolled Charging 100 EVs Distributed Smart Charging
Figure 2.11: System load with 100 EVs under different charging control algorithms. night valley hours. The effect of flattening the load is more evident with the scenario of 3000 EVs in Figure 2.13.
In order to show the performance of smart charging algorithm on flattening the load curve in a quantitative way, a comparison between the peak and valley load value with different charging algorithms is shown in Table 2.3. The results show the smart charging algorithm can effectively reduce the peak-valley load difference and flatten the load curve.
Table 2.3: Comparison of peak and valley load with different EV charging algorithms.
Base load Uncontrolled Charging Smart Charging
1000 EVs 3000 EVs 1000 EVs 3000 EVs
Peak load Pp 7.3053 8.4768 10.8735 7.3119 7.3218
valley load Pv 2.7193 2.8404 3.0125 4.4372 5.5188
Peak and valley difference Pd
4.5860 5.6364 7.8610 2.8747 1.8030
Pd/Pp % 62.78 66.49 72.30 39.32 24.63
0 4 8 12 16 20 24 Time(h) 2 3 4 5 6 7 8 9 Load(W) 106
Non-EV Base Load
1000 EVs Uncontrolled Charging 1000 EVs Distributed Smart Charging
Figure 2.12: System load with 1000 EVs under different charging control algorithms.
0 4 8 12 16 20 24 Time(h) 2 3 4 5 6 7 8 9 10 11 Load(W) 106
Non-EV Base Load
Load with Uncontrolled Charging Load with Distributed Smart Charging
2.5.2
V2G enabled smart charging control
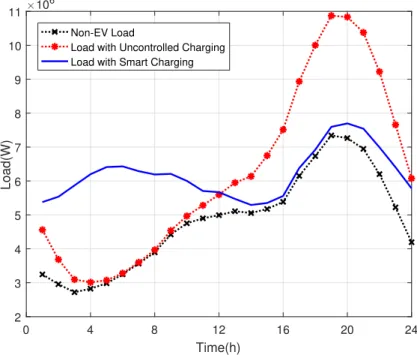
For the V2G enabled smart charging, the same test system in Table 2.2 is used, the results in last section show the difference under different EV integration ratio, so this case only focus on the 3000 EVs scenario. With the V2G enabled smart charging control, electric vehicles could discharging energy into the grid to earn the revenue, if the related revenues large enough. The optimization objective of the centralized aggregator is to minimize the total cost in Equation 2.31, which is the cost of charging and battery degradation minus the revenues from V2G discharging. The system load with this V2G enabled smart charging is shown in Figure 2.14.
0 4 8 12 16 20 24 Time(h) 2 3 4 5 6 7 8 9 10 11 Load(W) 106 Non-EV Load
Load with Uncontrolled Charging Load with Smart Charging
Figure 2.14: System load with 3000 EVs under different charging control algorithms.
The results shows this algorithm can also flatten the load curve very well, especially it can reduce the system load peak at 9 pm a lot. Because the smart pricing mechanism is also used in this algorithm, this charging pricing mechanism is very sensitive to the load variation, especially during the peak load hour. If there is no smart charging control, the increased peak load caused by uncontrolled EV charging can cause a very high price for EV charging, which is shown in Figure 2.15. However,
with the smart charging, the charging load is transfered from the peak load hour to the night hour, so the charging price at the peak hour also decrease a lot.
0 2 4 6 8 10 12 14 16 18 20 22 24 Time(h) 0 100 200 300 400 500 600 700 Charging price(Cent/kWh) Uncontrolled Charging V2G enabled Smart Charging
Figure 2.15: The charging price for different charging control algorithms.
As mentioned before, the EV can discharging energy into the grid with V2G technology, so for the specific load model, the net charging power of aggregated 3000 EVs is shown in Figure 2.16. The results show the charging loads are mainly con-centrate on the night valley load period, and the net charging load of aggregated EV during the peak load hours is minus, which means the aggregated EV at this period is playing the role of distributed generation. With more attractive discharging price, the amount of discharging power can be much larger. And there are many potential applications with aggregated and V2G enabled EVs, such as frequency regulation, providing operating reserve. The application of providing operating reserve for the power system and its effects on reliability will be discussed in Chapter 4.
0 2 4 6 8 10 12 14 16 18 20 22 24 Time(h) -0.5 0 0.5 1 1.5 2 2.5 3 3.5 4 4.5 Charging Load(W) 106
Chapter 3
The effects of large scale
integration of EVs into the grid on
power system reliability
3.1
Power system reliability analysis introduction
The power system is the largest man-made system that ever existed on the earth, it’s so complex and delicate that requires the electric power is produced by the generating units and transmitted to the end users through transmission system in real time, because there is no economic and convenient method for electric power storage.
The power system reliability is often defined as the probability of power system could deliver electric power to the end user on a continuous period with acceptable service quality [62]. According to the characteristics of power system, the reliability analysis is based on hierarchical levels, all three major parts of power system are included and combined into different hierarchical levels, as the Figure 3.1 shows. The hierarchical level 1 analysis only including the generating system, hierarchical level
2 includes both the generating and transmission system, which is often called the composite system or bulk power system, and hierarchical level 3 includes all three major parts of power system. However, the hierarchical level 3 analysis is not usually done because of its complexity.
Generation
System
Transmission
System
Distribution
System
Hierarchical
Level 1
Hierarchical
Level 2
Hierarchical
Level 3
Figure 3.1: Hierarchical levels of power system reliability assessment [63].
The reliability evaluation plays important roles in both the planning and oper-ating process. Long term reliability analysis is usually used in the relatively long term system planning, for example, determining whether the system has sufficient generat-ing capacity to meet the load demand, determingenerat-ing whether the transmission system has sufficient capacity to transfer the energy to the customers on end points. However, for the power system operating, the uncertainty and contingencies will endanger the safe and reliable operation of the power system and then affect the customers, so the short term power system reliability which could assist the system operator is needed, such as determining the capacity of operating reserve. This chapter will discuss the effects of smart charging on the long term power system reliability.
3.1.1
Methods of reliability evaluation
The power system has used the deterministic methods for the planning and operation for decades. However, the system nature is stochastic, this characteristics is more evident in recent years with an increasing integration ratio of intermittent
![Table 2.1: Charging characteristics of representatives EVs [57]. Toyota Prius PHEV ChevroletVoltPHEV Nissan LeafBEV Tesla RoadsterBEV Battery Capacity 4.4 kWh 16 kWh 24 kWh 53 kWh](https://thumb-us.123doks.com/thumbv2/123dok_us/10977315.2985709/32.918.170.805.145.582/charging-characteristics-representatives-chevroletvoltphev-leafbev-roadsterbev-battery-capacity.webp)