1
Abstract—
Economic Load Dispatch (ELD) proves to be a vital
optimization process in electric power system for allocating
generation amongst various units to compute the cost of generation,
the cost of emission involving global warming gases like sulphur
dioxide, nitrous oxide and carbon monoxide etc. In this dissertation,
we emphasize ramp rate constriction factor based particle swarm
optimization (RRCPSO) for analyzing various performance
objectives, namely cost of generation, cost of emission, and a dual
objective function involving both these objectives through the
experimental simulated results. A 6-unit 30 bus IEEE test case
system has been utilized for simulating the results involving
improved weight factor advanced ramp rate limit constraints for
optimizing total cost of generation and emission. This method
increases the tendency of particles to venture into the solution space
to ameliorate their convergence rates. Earlier works through
dispersed PSO (DPSO) and constriction factor based PSO (CPSO)
give rise to comparatively higher computational time and less good
optimal solution at par with current dissertation. This paper deals
with ramp rate and constriction factor based well defined ramp rate
PSO to compute various objectives namely cost, emission and total
objective etc. and compares the result with DPSO and weight
improved PSO (WIPSO) techniques illustrating lesser computational
time and better optimal solution.
Keywords—
Economic load dispatch, constriction factor based
particle swarm optimization, dispersed particle swarm optimization,
weight improved particle swarm optimization, ramp rate and
constriction factor based particle swarm optimization.
I.
I
NTRODUCTIONNTERCONNECTED electric utility is basically meant for
attaining minimum cost of generation and emission through
a combined objective function satisfying the equality and
inequality constraints involving well defined down ramp rate
limits and up ramp rate limits with proper constriction factor
nonlinear behavior of cost and emission function. The impact
of valve point loading gives rise to more perturbation in cost
function which can be piecewise-linearized using conventional
dispatch techniques. Advanced constriction factor based well
defined ramp rate particle swarm optimization (PSO) [17]
approach employing heuristic principle is a population-based
evolutionary programming technique employing flocks of
birds. The added feature through an improved constriction
factor has been used to optimize the cost of generation and
environmental emission for reducing global warming to great
extent. The feasibility of proposed method was demonstrated
Saroj Kumar Dash is with the Gandhi Institute for Technological Advancement, India (e-mail: [email protected]).
for a 6-generating unit system through 30 bus IEEE test case
systems. The results obtained through the proposed method
were compared with various conventional methods like
Lagrange multiplier method [6], [7], mixed integer linear
programming method, evolutionary programming method
[8]-[10] and quadratic programming method, etc. References
[1]-[5] as well with various heuristic methods like PSO, DPSO,
WIPSO, etc.
II.
M
ETHODOLOGYThis section forecasts the objective function viz. cost,
emission, and combined objective function satisfying equality
and inequality constraints involving price penalty factor
F
i.
The basic ELD problem is formulated through (1) and (2),
2
(
)
sin( (
))
i i i i i i i i i iZ
a PG
bPG C
K
l P PG
(1)
2(
)
i i i i i iJ
h PG
g PG
q
(2)
where
Z
iand
J
iare the cost and emission objective
functions, and
a
i,
b
i,c
i,K
i,l
iand
h
i,
g
i,
q
iare the cost
and emission objective function coefficients. In this
dissertation, the emission function involves global warming
gases like NO
2and SO
2. The ultimate objective function
involving combined objective formulation encompassing cost
as well as emission objective function through price penalty
factor
F
iis formulated as (3).
i i i iS
Z
F
J
(3)
where
max max i i iZ
F
J
(4)
2(
)
sin( (
))
i i i i i i i i i iZ
a PG
b PG
C
K
l P
PG
(5)
2(
)
i i i i i iJ
h PG
g PG
q
(6)
The constraints involved in this work are
i.
Equality constraint
Ramp Rate and Constriction Factor Based Dual
Objective Economic Load Dispatch Using Particle
Swarm Optimization
Himanshu Shekhar Maharana, S. K .Dash
I
1 n D i
PGi
P
TL
(7)
where
P
D= net power demand.
TL=
6 6 1 1 m n mn m nPG
PG
B
where TL is transmission loss.
ii.
Inequality constraint
i i j
P PG P
(8)
where
PG
irepresents the output power of
i
thgenerating unit,
i
P
and
P
jare the minimum and maximum output power of
th
i
generating unit, respectively.
III.
O
VERVIEW OFR
AMPR
ATEC
ONSTRICTIONF
ACTORB
ASEDPSO
PSO [11], [12] first propounded by Kennedy and Ebert
formed the behavior of evolutionary techniques for ELD
optimization. Intersecting the valve point strategy employed in
the multi objective generation dispatch the nonlinear
characteristics of cost objective function and that of emission
objective function as well become a challenging issue for ELD
optimization. So, in order to obtain optimistic results of
nonlinear optimization technique, we incorporate here a ramp
rate limit that outsmarts the ordinary inequality constraints
through advanced constriction factor based well defined ramp
rate PSO technique. This method involves dispersed particles,
i.e. swarms [13], [14] in search space randomly updating their
position using their velocity heuristically resembling their
neighbors so as to obtain position and velocity vectors viz.
best
P
and
g
best, i.e. (
P
1best,
P
2best…..
P
ibest) and
(
g
1best,g
2best…..
g
ibest) respectively. The updated values of
position and velocity are computed using (9) and (10).
( 1) 2
[
1 1 1(
0)
2 2(
)]
k k k k n n i best iY
WY
C Rand L
S
C Rand g
S
(9)
1 1 1 k k k n i iS
S
V
(10)
where
C
1,
C
2are acceleration coefficients, W = Inertia
weight,
k1i
V
= Updated velocity of the k+1 iteration, L
0=
best
P
function,
k iS
= Initial
thi
particle after
thk
iteration,
1C
R and 1
(
k)
i bestS
P
= Particle’s Private thinking,
C
2R
and 2
(
k)
i best
S
g
= Collaboration amongst particles
max min max
W
W
W
W
n
k
(11)
K = Maximum number of iterations, n = Iteration number,
max
W
= Initial Weight in per unit = 0.85,
W
min= Final
Weight in per unit = 0.35. To optimize the valve point loading
effect, the ramp rate constraints are imposed upon the iteration
inequality constraints as under.
min 0 max 1
(
i,
i i)
inew(
i,
i i)
Max PG
P
DR
PG
Min PG
P
UR
(12)
Subject to condition that
P
gi
P
i0
UR
i(Generation
increases)
0 1
i i i
P
P
D R
(Generation decreases) (13)
where
P
i1= Power generation of
thi
unit in the current
interval and
P
i0= Power generation of
thi
unit just before the
interval
Looking into the valve point loading, a constriction factor
finds use in advanced constriction factor-based well defined
ramp rate PSO algorithm given by,
CF=
3 2
4
4
3
2.2
(14)
where
lies between 2.1 and 3.1.
As
rises, CF decreases giving rise to slower convergence
because of diminished population velocity up-gradation using
(14)
( 1) 2[
1 1 1(
0)
2 2(
)]
k k k k n n i best iY
CF WY
C Rand L
S
C Rand g
S
(15)
A.
RRCPSO Algorithm
Step 1)
Initialize parameters like:
6 5 4 3 2 1
,
PG
,
PG
,
PG
,
PG
,
PG
PG
Step 2)
If
L
iis better than
L
0, then
new
i
L
L
0Else
L
i
L
0oldStep 3)
Initialize
g
bestvalues for generating units
PG
1to
6
PG
Step 4)
Assign best of
L
inewand
L
0oldto
g
bestStep 5)
Current position
S
i
Z
i
F
i
J
iand current
velocity
)
()(
max min min 1 i i i nU
Randi
U
U
Y
Step 6)
Update position for each particle
) 1 ( 2 1
(
1
)
k n k i nk
S
Y
S
where
k21 nY
is the update velocity for each particle
Step 7)
If particle position is greater than or equal to bounds
in (12) then stop otherwise go to step 2.
IV.
R
ESULTA
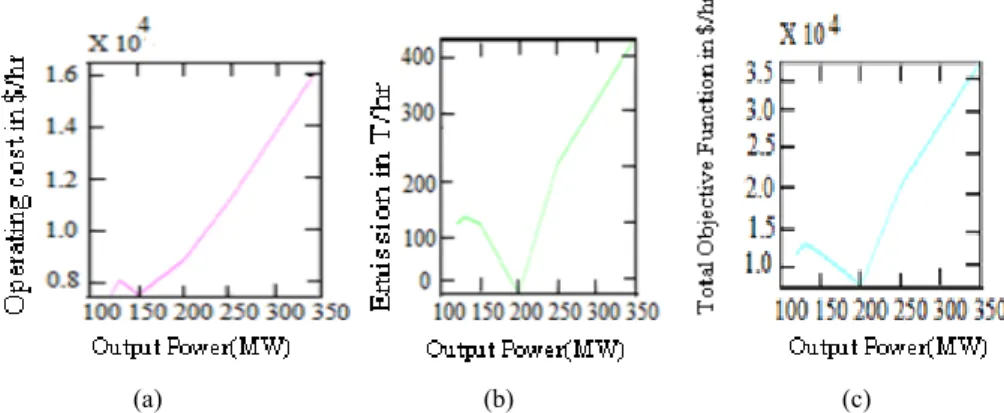
NALYSISThe results obtained for the proposed RRCPSO method
(Fig. 1) for various objectives viz. cost, emission [16] and
combined objective for the IEEE 30 bus test case system
through Fig. 1 suggest that beyond 200 MW cost as well as
emission objective yields better performance over the classical
methods like lambda iteration, mixed integer with linear
programming method, and quadratic method, etc. It also
outperforms heuristic methods like PSO [15], WIPSO, and
DPSO, etc. as illustrated through results obtained in Table III
The Simulink model (Fig. 2) and simulated results (over 30
sec) for these objectives (Figs. 3-5) for a thermal power plant
yield better performance over other heuristic method.
TABLE I
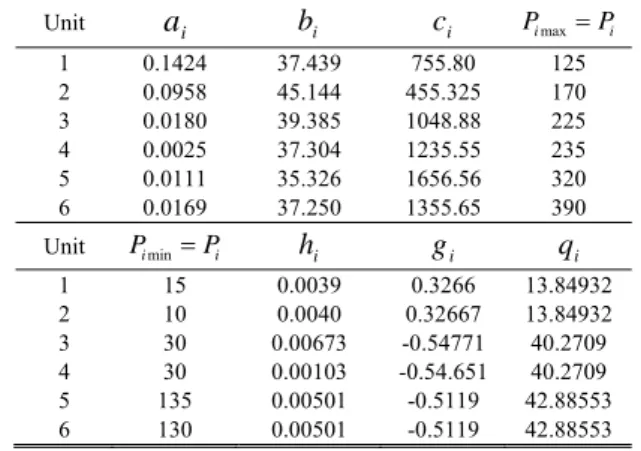
COST COEFFICIENTS,UNIT CAPACITY AND EMISSION COEFFICIENTS FOR IEEE 30BUS TEST CASE SYSTEM WITH 6GENERATING UNIT
Unit
a
ib
ic
iP
imax
P
i 1 0.1424 37.439 755.80 125 2 0.0958 45.144 455.325 170 3 0.0180 39.385 1048.88 225 4 0.0025 37.304 1235.55 235 5 0.0111 35.326 1656.56 320 6 0.0169 37.250 1355.65 390 UnitP
imin
P
ih
ig
iq
i 1 15 0.0039 0.3266 13.84932 2 10 0.0040 0.32667 13.84932 3 30 0.00673 -0.54771 40.2709 4 30 0.00103 -0.54.651 40.2709 5 135 0.00501 -0.5119 42.88553 6 130 0.00501 -0.5119 42.88553 TABLE IIRESULT OF 6-UNIT SYSTEM FOR A LOAD DEMAND OF 1200MW INCORPORATING TRANSMISSION LOSS
Unit Power Output PSO WIPSO DPSO ACWRRPSO PG1 (MW) 49.22 50.02 93.02 120 PG2 (MW) 18.84 20.88 100.02 130 PG3 (MW) 108.85 110.09 95.00 150 PG4 (MW) 58.88 60.34 150.47 200 PG5 (MW) 208.81 210.62 200.05 250 PG6 (MW) 307.13 308.58 270.55 350 Loss (MW) 55.78 58.89 62.57 46.69 Total Power output 807.51 819.42 971.68 1200 Fuel cost($/h) 61115.0 62120.09 63629.22 59626 Emission(T/h) 1026.23 1033.477 1043.458 1020.307 Total cost($/h) 100702 100719 100922 100611
TABLE III
PARAMETERS OF A 6-UNIT TEST CASE THERMAL SYSTEM
Frequency (f) = 60 HZ Tg1=Tg2=0.8 s P tie max=350 MW Tr1=Tr2= 10 s Kr1=Kr2 = 0.5 Tt1=Tt2= 0.3 Kp1=Kp2=120 Hz/ PU MW Tp1=Tp2 = 1 S, a = -0.5; a12 = -0.5 TABLE IV
OPTIMAL SYSTEM PARAMETERS INCORPORATING RRCPSOTECHNIQUE
Areas under
interconnections Parameters Optimal
Optimal System Parameters using ACWRRPSO technique Thermal Power system-1 Kp1 120 Ki1 0.02 B1 1 R1 1 Thermal Power system-2 Kp2 120 Ki2 0.02 B2 1 R2 1 Thermal Power system- 3 Kp3 120 Ki3 0.02 B3 1 R3 1 Thermal Power system- 4 Kp4 120 Ki4 0.02 B4 1 R4 1 Thermal Power system- 5 Kp5 120 Ki5 0.02 B5 1 R5 1 Thermal Power system- 6 Kp6 120 Ki6 0.02 B6 1 R6 1 TABLE V
OPTIMAL PARAMETERS FOR RRCPSOTECHNIQUE FOR 6UNIT TEST CASE
THERMAL SYSTEM
Sl. No. Description of parameters Symbol used Optimal value of parameters 1 Constriction factor CF 2.9 2 Acceleration coefficients C1,C2 2.1 3 Minimum Inertia weight W min 0.35
4 Maximum Inertia weight W max 0.85
5 Number of iterations K 100 6 Random values R1,R2,Ri 0.3,0.7,0.5 7 Power Demands PD 1200 MW 8 Power generation of th
i
unit just before the current interval
Pi0 80
9 Down Ramp rate limit of th
i
unit DRi 4410 UP Ramp rate limit of
i
th unitUR
i 1244TABLE VI
TRANSMISSION LOSS COEFFICIENTS FOR 6-UNIT TEST
CASE THERMAL SYSTEM
Unit B coefficients (Bi j) 1 2 3 4 5 6 1 1.39 0.16 0.14 0.18 0.25 0.21 2 0.16 0.59 0.12 0.15 0.14 0.19 3 0.141 0.12 0.64 0.16 0.23 0.18 4 0.18 0.15 0.16 0.61 0.29 0.24 5 0.25 0.14 0.23 0.29 0.68 0.31 6 0.21 0.19 0.18 0.24 0.31 0.84
A.
Various Objective Functions
(a)
(b) (c)
Fig. 1 (a) Operating cost function vs Output Power, (b) Emission level vs Output Power, (c) Total objective function vs. Output power for 30
number of iterations
B.
Simulink Model
Fig. 2 Simulink Model of various objectives for a thermal power plant
Time (12 seconds)
Fig. 3 Fuel cost function of the RRCPSO for 6-generator 30 bus
IEEE test case system for demand of 1200 MW
Time (12 seconds)
Fig. 4 Emission function for 6-unit 30 bus IEEE test case system
Time (12 seconds)
Fig. 5 Combined objective function for 6-unit 30 bus IEEE test case
system
V.
C
ONCLUSIONThe proposed method RRCPSO presented advanced PSO
technique involving valve point loading, ramp rate constraints,
constriction factor based swarm optimization tool box for
analyzing the economic dispatch problem. The results of this
analysis (Tables I-VI) outperform classical methods like
lambda iteration method, mixed integer linear programming
method (MILP), quadratic programming method, etc., and
heuristic methods like PSO, WIPSO, DPSO, etc. in terms of
computational time for better optimal solution.
R
EFERENCES[1] M. L Jose, L.T Alicia and S.R Jesus, “Short term hydrothermal coordination based on interior point nonlinear programming and genetic Algorithm”, EE Porto power Tech conference, 2001.
[2] M. G. CW, Aganagic JG, Tony M Jose B and Reeves S, “Experience with mixed integer linear programming based approach on short term hydrothermal scheduling, IEEE transaction on power system, Vol.16 (4), pp.743-749.
[3] Ng and G. Shelby, “Direct load control –a profit-based load management using linear programming, IEEE transaction on power system, Vol.13
(2), pp.688-694, 1998.
[4] Shi C C, Chun H.C, Fomg I. K and Lah PB , “Hydroelectric generation scheduling with an effective differential dynamic programming algorithm”, IEEE transaction on power system, Vol.5(3),pp.737-743, 1990.
[5] Erion Finardi C, Silva Edson LD and Laudiasagastizabal CV. “Solving the unit commitment problem of hydropower plants via Lagrangian relaxation and sequential quadratic programming”, Computational &
Applied Mathematics, Vol. 24(3), pp. .317- 341, 2005.
[6] D I sun, B Ashley, B Brewer, A Hughes and W.F. Tinney, “Optimal power flow by Newton Approach”. IEEE transaction on power system, Vol 103(10), pp.2864-2880, 1984.
[7] Santos and G.R. da Costa, “Optimal power flow by Newton’s method applied to an augmented Lagrangian function” IEE proceedings generations, Transmission & distribution, Vol 142(1), pp.33-36, 1989. [8] N Sinha, R. Chakrabarti and PK Chattopadhayay, “Evolutionary
programming techniques for Economic load Dispatch. IEEE
transactions on Evolutionary Computations,” Vol 7(1), pp.83-94, 2003.
[9] K. P. Wong and J Yuryevich, “Evolutionary based algorithm for environmentally constraints economic dispatch”, IEEE transaction on
power system. ” Vol 13(2), pp. 301-306, 1998.
[10] L Lai & Mata Prasad. Application of ANN to economic load dispatch.
Proceeding of 4th international conference on advance in power system
control, operation and management, APSCOM-97,
Hong-Kongpp.pp707-711, nov-1997.
[11] J. Kennedy and R. C. Ebert, “Particle Swarm Optimization,” proceeding
of IEEE international conference on Neural networks, Vol.4,
pp.1942-1948, 1995.
[12] C.H. Chen& S.N. Yeh, “PSO for Economic power dispatch with valve point effects,” IEEE PES transmission & Distribution conference and
Exposition, pp.1-5Latin America, Venezuela, 2006.
[13] K. S. Swarup, “Swarm intelligence Approach to the solution of optimal power flow,” Indian Institute of science, pp.439-455, oct- 2006. [14] K. T. Chaturvedi, M. panditand L .Srivastava, “Self organizing
Hierarchical PSO for non-convex economic load dispatch,” IEEE
transaction on power system,Vol.23(3), pp.1079-1087,Aug.2008.
[15] P. T. V. Dinhlunge and Joef, “A Novel weight-improved Particle swarm optimization algorithm for optimal power flow and economic load dispatch problem.” IEEE Transaction, pp.1-7, 2010.
[16] K. S. Kumar, V.Tamilselvan, N. Murali, R. Rajaram , N.S.Sundaram and T. Jayabharathi , “Economic Load Dispatch with Emission Constraints using Various PSO Algorithms”, WEAS Transactions on power
systems,Vol3(9),pp.598 607,September 2008.
[17] Hardiansyah, “Solving Economic Dispatch Problem with Valve-Point Effect using a Modified ABC Algorithm”, International Journal of
Electrical and Computer Engineering, Vol 3(3), pp.377-385, June 2013.
Himanshu Shekhar Maharana completed his B. Tech degree in EEE from JITM, Paralakemundi under BPUT university, Rourkela, Odisha in 2010 and Completed M. Tech degree in Power System Engineering from GITA, Bhubaneswar under BPUT, Rourkela,, Odisha in the year 2014. Prior to it he worked in industry and then worked as an Asst. Professor in the Dept. of Electrical Engineering at Einstein Academy Of Technology & Management, Bhubaneswar for 4 years. Now he is working as an Asst. Professor in the Dept. of EEE at Gandhi Institute Of Excellent Technocrats, Ghangapatna, Bhubaneswar. At present he is continuing Ph.D. degree in BPUT, Rourkela, Odisha under the guidance of professor Dr . S. K. Dash.
S. K. Dash received the UG degree in Electrical Engineering from I.E, India in 1991 and accomplished Masters’ Program in electrical engineering from UCE, Burla (Sambalpur University), India, in 1998 and the Ph.D. degree from Utkal University, Odisha, India in the year 2006. He has been with the Electrical Engineering Department, Gandhi Institute for Technological Advancement as a Professor and Head of the Department since 2005.Prior to it he worked in industry for 5 years and in OSME, Keonjhar, for 2 years and in Krupajal Engineering College for 4 years. His research interests are power system planning, operation, and optimization techniques applied to power systems. Dr. Dash received Pandit Madan Mohan Malaviya award, Union Ministry of Power Prize and gold medals thereof for his research papers on Multi Objective Generation Dispatch. He too authored two books entitled ‘Fundamentals of Electromagnetic Field Theory’ and ‘Basic Electrical Engineering’ under the umbrella of PHI Publication and YESDEE publication in the year 2010 and 2016 respectively. Dr. Dash is engaged as a reviewer of EPCS, and EPSR journals of IEEE.