The Quantitative Methods Boot Camp:
Teaching Quantitative Thinking
and Computing Skills to Graduate
Students in the Life Sciences
The Harvard community has made this
article openly available.
Please share
how
this access benefits you. Your story matters
Citation
Stefan, Melanie I., Johanna L. Gutlerner, Richard T. Born, and
Michael Springer. 2015. “The Quantitative Methods Boot Camp:
Teaching Quantitative Thinking and Computing Skills to Graduate
Students in the Life Sciences.” PLoS Computational Biology
11 (4): e1004208. doi:10.1371/journal.pcbi.1004208. http://
dx.doi.org/10.1371/journal.pcbi.1004208.
Published Version
doi:10.1371/journal.pcbi.1004208
Citable link
http://nrs.harvard.edu/urn-3:HUL.InstRepos:15034770
Terms of Use
This article was downloaded from Harvard University’s DASH
repository, and is made available under the terms and conditions
applicable to Other Posted Material, as set forth at http://
nrs.harvard.edu/urn-3:HUL.InstRepos:dash.current.terms-of-use#LAA
EDUCATION
The Quantitative Methods Boot Camp:
Teaching Quantitative Thinking and
Computing Skills to Graduate Students in the
Life Sciences
Melanie I. Stefan1, Johanna L. Gutlerner2, Richard T. Born1, Michael Springer3*
1Department of Neurobiology, Harvard Medical School, Boston, Massachusetts, United States of America,
2Department of Biological Chemistry and Molecular Pharmacology, Harvard Medical School, Boston, Massachusetts, United States of America,3Department of Systems Biology, Harvard Medical School, Boston, Massachusetts, United States of America
Abstract
The past decade has seen a rapid increase in the ability of biologists to collect large
amounts of data. It is therefore vital that research biologists acquire the necessary skills dur-ing their traindur-ing to visualize, analyze, and interpret such data. To begin to meet this need, we have developed a“boot camp”in quantitative methods for biology graduate students at Harvard Medical School. The goal of this short, intensive course is to enable students to use computational tools to visualize and analyze data, to strengthen their computational thinking skills, and to simulate and thus extend their intuition about the behavior of complex biological systems. The boot camp teaches basic programming using biological examples from statistics, image processing, and data analysis. This integrative approach to teaching programming and quantitative reasoning motivates students’engagement by demonstrat-ing the relevance of these skills to their work in life science laboratories. Students also have the opportunity to analyze their own data or explore a topic of interest in more detail. The class is taught with a mixture of short lectures, Socratic discussion, and in-class exercises. Students spend approximately 40% of their class time working through both short and long problems. A high instructor-to-student ratio allows students to get assistance or additional challenges when needed, thus enhancing the experience for students at all levels of mas-tery. Data collected from end-of-course surveys from the last five offerings of the course (be-tween 2012 and 2014) show that students report high learning gains and feel that the course prepares them for solving quantitative and computational problems they will encoun-ter in their research. We outline our course here which, together with the course maencoun-terials freely available online under a Creative Commons License, should help to facilitate similar efforts by others.
OPEN ACCESS
Citation:Stefan MI, Gutlerner JL, Born RT, Springer M (2015) The Quantitative Methods Boot Camp: Teaching Quantitative Thinking and Computing Skills to Graduate Students in the Life Sciences. PLoS Comput Biol 11(4): e1004208. doi:10.1371/journal. pcbi.1004208
Editor:Joanne A. Fox, University of British Columbia, Canada
Published:April 16, 2015
Copyright:© 2015 Stefan et al. This is an open access article distributed under the terms of the Creative Commons Attribution License, which permits unrestricted use, distribution, and reproduction in any medium, provided the original author and source are credited.
Funding:This work was supported by the Bertarelli Program in Translational Neuroscience and Neuroengineering and by NSF grant 1349248. The funders had no role in study design, data collection and analysis, decision to publish, or preparation of the manuscript.
Competing Interests:The authors have declared that no competing interests exist.
This is part of thePLOS Computational BiologyEducation collection.
Background
Modern biology increasingly requires computational and quantitative methods to collect, pro-cess, and analyze data, as well as to understand and predict the behavior of complex systems. Whereas throughout much of the 20th century computational and mathematical biology were niche disciplines, their methods are now becoming an integral part of the practice of biology across all fields [1]. It is therefore increasingly important that life scientists receive appropriate quantitative and computational training [2,3]. The importance of such training has been recog-nized at all levels from K–12 to continuing professional development [1,3–10]. Unfortunately, biologists’competencies in computational and mathematical techniques often lag far behind the demands of the discipline [1,3,11].
To address this skill and knowledge deficit, doctoral training programs in biology need to offer computational and quantitative instruction that supports students’research work and scholarship and sets them up for careers after graduate school. Biology majors have articulated their need for training in the skills of algorithmic thinking, problem solving, data analysis, and statistics [3]. Postgraduate education faces the additional challenge that incoming students vary widely in their background knowledge in these areas. Designing and offering instruction that accommodates such a diverse group of students is therefore a major challenge in graduate education within the biological and biomedical sciences.
In an attempt to address the need for quantitative and computational education at the grad-uate level, students are often directed to computer science or statistics courses. This strategy has several drawbacks. First, a typical programming or statistics course goes into more theoreti-cal depth than many life scientists will need. Second, and more problematic, multiple courses are needed to obtain the basic quantitative and programming skills that are essential for solving real biological problems. This involves an extensive time commitment that most trainees can-not accommodate. In addition, typical programming and quantitative courses often teach con-cepts without linking them to possible applications in the life sciences, making it difficult for students to recognize their value in the context of their own research, and thereby missing an opportunity to motivate and engage these students.
A number of successful initiatives to increase quantitative and computational education for biologists have been launched in recent years, most of them at the undergraduate level. They often share common characteristics that promote their success: computational methods are taught in the context of biological examples [4,12,13], courses use active and hands-on learning methods [4,12,14,15], and quantitative instruction is coordinated across courses into integrated interdisciplinary curricula [13–16]. Here, we describe a course in quantitative methods offered to biology graduate students at Harvard Medical School that makes use of many of the ap-proaches successful at the undergraduate level while creating a unique experience for graduate students.
The Quantitative Methods Boot Camp course (QMBC) is an approximately 50-hour, hands-on course that introduces students to the fundamentals of programming, statistics, and image and data analysis through the use of MATLAB [17]. Throughout the course, students apply the concepts they learn to examples from biology, including, if they choose, their own re-search data. In this paper, we present the course learning goals and the design and pedagogical methods we employ. Finally, we discuss data from the postcourse surveys from the last five of-ferings, which reveal that students enjoy the course overall, report high learning gains, and are inspired to use quantitative and computational methods in the future.
Learning Goals and Objectives
QMBC is guided by a set of overarching learning goals that we want our students to achieve and retain in the long term. We broadly categorize these goals into three domains,“thinking,”
“doing,”and“feeling.”This reflects our belief that developing practical programming skills (“doing”) is of limited use if one does not also develop both the ability to think about problems algorithmically (“thinking”) and a positive attitude towards computing (“feeling”).
“Thinking”goals include skills such as breaking a complex problem into simpler steps, re-casting questions in a way that makes them amenable to computational analysis, and develop-ing strategies to validate a specific problem-solvdevelop-ing approach.
We use the category of“doing”to describe the practical programming skills students need to implement their problem-solving strategies. The course introduces them to MATLAB [17] as a tool for achieving this, but nearly all of the skills and concepts are transferable to other computer programming languages.
In the domain of“feeling,”our goals focus on fostering a positive attitude towards quantita-tive and computational thinking. A major challenge in this arena is helping the students over-come their initial apprehension towards computer programming. By the end of the course, we want students to be comfortable with computational tools and quantitative reasoning, and to recognize their value in a biological research context. Throughout the course, we encourage students to experiment and play with the code and to follow their curiosity.
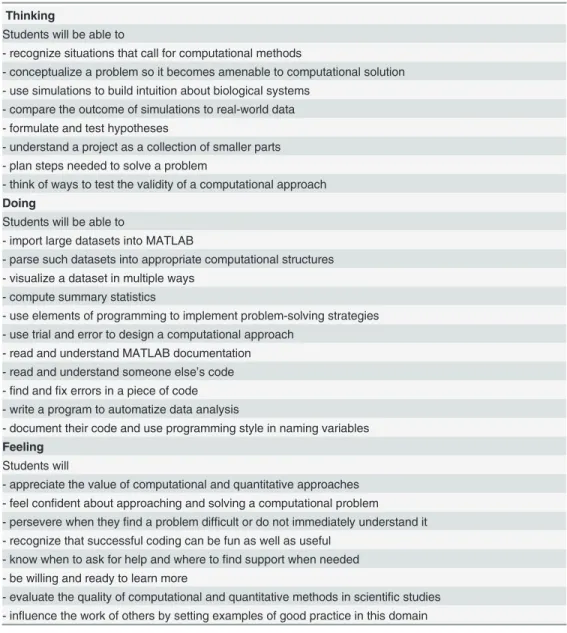
An overview of our goals in all three domains is given inTable 1.
The course consists of five full days of instruction: Days 1 and 2 provide an introduction to programming using MATLAB, Day 3 is devoted to approaches to probability and statistics, in-cluding common misconceptions and possible pitfalls [18], Day 4 to image analysis, and Day 5 to students’own data or other special topics (Tables2and3andS5 Text). The topics covered in the course were chosen based on a combination of student interest, didactic benefit, and cur-ricular need. Independent of their specific research field and topic, all our students will need to know about statistics and data analysis, both for their own projects and in order to understand the scientific literature. Likewise, data in many areas of biology comes in the form of images (often in large numbers), so most of our students will benefit from a knowledge of how to pro-cess images and extract information. To match changing demand over the past few years we have introduced, and plan to continue to develop, more bioinformatics exercises. Because any concept can be understood at different levels [19,20], and students start the journey towards more sophisticated understanding at different entry points and progress at different rates [21], being mindful of these individual differences is key to offering a course that benefits all students.
For each day, we have defined a set of learning goals and objectives (S1 Text). Students com-plete exercises that help them attain those learning goals. Wherever possible, we draw on exam-ples from biological research, as illustrated in the following example from the first day.
Comparing Galactose Metabolism in Two Yeast Strains
The first day of the course serves to introduce students to the MATLAB environment and to teach them to analyze single data points, work with arrays of data points, and visualize and ex-plore data. At the end of the day, students attempt an hour-long exercise that serves to synthe-size these concepts and to apply them to a problem commonly encountered in biological research: the analysis of images from a microscope.
The biological question for this exercise concerns the ability of two different yeast strains to metabolize galactose. The strains are distinguished by the expression of different fluorescent proteins (red and blue), and galactose production is read out by a third (yellow) fluorescent
protein (YFP). The students are given three images corresponding to the three different fluo-rescent channels. They must first select cells according to which yeast strain (red or blue) they belong, and then measure YFP levels for each strain and compare them.
The experiment is first described by the instructor, and there is an in-class discussion that helps students understand the problem and plan the steps needed in solving it. Students then work at their own pace, either individually or with a partner. They can tackle the problem crea-tively, or follow a set of written guidelines (S2 Text, page 1). Instructors and teaching assistants walk around the classroom to answer questions and offer feedback. This is a purposefully diffi-cult exercise, and we do not expect most students to complete it within class. The completion of the exercise is one of the homework assignments for Day 1.
Table 1. Learning goals for QMBC. Thinking
Students will be able to
- recognize situations that call for computational methods
- conceptualize a problem so it becomes amenable to computational solution - use simulations to build intuition about biological systems
- compare the outcome of simulations to real-world data - formulate and test hypotheses
- understand a project as a collection of smaller parts - plan steps needed to solve a problem
- think of ways to test the validity of a computational approach
Doing
Students will be able to
- import large datasets into MATLAB
- parse such datasets into appropriate computational structures - visualize a dataset in multiple ways
- compute summary statistics
- use elements of programming to implement problem-solving strategies - use trial and error to design a computational approach
- read and understand MATLAB documentation - read and understand someone else’s code -find andfix errors in a piece of code - write a program to automatize data analysis
- document their code and use programming style in naming variables
Feeling
Students will
- appreciate the value of computational and quantitative approaches - feel confident about approaching and solving a computational problem - persevere when theyfind a problem difficult or do not immediately understand it - recognize that successful coding can be fun as well as useful
- know when to ask for help and where tofind support when needed - be willing and ready to learn more
- evaluate the quality of computational and quantitative methods in scientific studies - influence the work of others by setting examples of good practice in this domain
Learning goals for QMBC, categorized into the three domains of thinking, doing, and feeling.
Working through the yeast metabolism exercise, students have to load and visualize images, work with data arrays, extract information from them and compute summary statistics, all of which are learning goals for Day 1. The exercise also reinforces some of our overarching course goals in the“thinking,” “doing,”and“feeling”domains, such as planning the steps needed to solve a problem, using trial and error to solve a computational problem, and persevering through a complex problem.
A more detailed description of the context, delivery, and learning goals for this exercise is provided inS2 Text(page 2 onward).
A similar discussion of an exercise from the Statistics module of the course is presented in
S3 Text(text of the exercise and detailed description of context, delivery, and learning goals), andS1 Code(MATLAB code). In this exercise, known as“Rattus binomialis,”students are pre-sented with data from a behavioral experiment in which a rat must identify which of two odors was presented on a given trial [22]. They are asked to calculate how likely it is that the rat guessed correctly on 31 (or more) trials out of a total of 50. They calculate a p-value using Monte Carlo simulations [23], which reinforces key programming skills such as for-loops and logical indexing, as well as the use of MATLAB functions for generating random numbers.
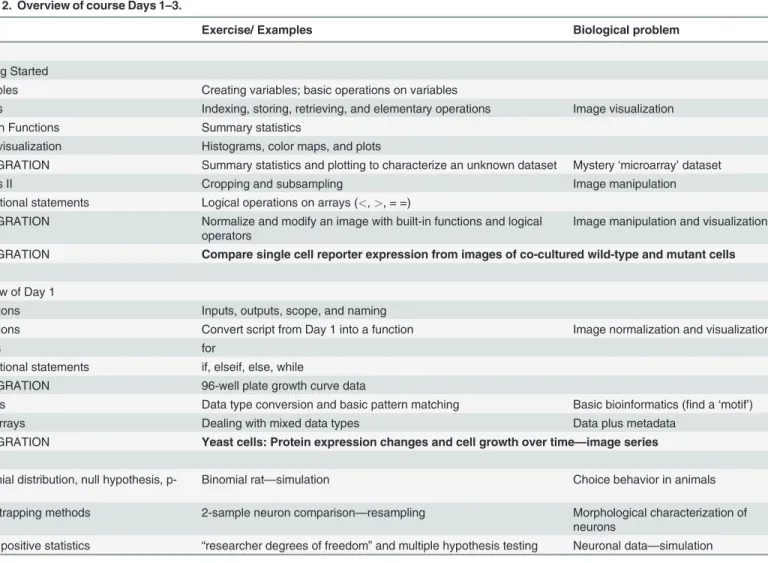
Table 2. Overview of course Days 1–3.
Topic Exercise/ Examples Biological problem Day 1
Getting Started
Variables Creating variables; basic operations on variables
Arrays Indexing, storing, retrieving, and elementary operations Image visualization Built-in Functions Summary statistics
Data visualization Histograms, color maps, and plots
INTEGRATION Summary statistics and plotting to characterize an unknown dataset Mystery‘microarray’dataset
Arrays II Cropping and subsampling Image manipulation
Conditional statements Logical operations on arrays (<,>, = =)
INTEGRATION Normalize and modify an image with built-in functions and logical operators
Image manipulation and visualization INTEGRATION Compare single cell reporter expression from images of co-cultured wild-type and mutant cells Day 2
Review of Day 1
Functions Inputs, outputs, scope, and naming
Functions Convert script from Day 1 into a function Image normalization and visualization
Loops for
Conditional statements if, elseif, else, while
INTEGRATION 96-well plate growth curve data
Strings Data type conversion and basic pattern matching Basic bioinformatics (find a‘motif’) Cell arrays Dealing with mixed data types Data plus metadata
INTEGRATION Yeast cells: Protein expression changes and cell growth over time—image series Day 3
Binomial distribution, null hypothesis, p-value
Binomial rat—simulation Choice behavior in animals Bootstrapping methods 2-sample neuron comparison—resampling Morphological characterization of
neurons
False positive statistics “researcher degrees of freedom”and multiple hypothesis testing Neuronal data—simulation Summary of the topics covered in Days 1–3 of the course, the examples and exercises, and the biological motivation.
Course Structure and Pedagogy
QMBC is offered twice a year in order to accommodate both beginning and advanced graduate students. Incoming graduate students can take the course before the start of fall semester and thus be exposed to quantitative and computational training early in graduate school. Students who realize the need for such training later in their studies can take the spring offering of the course.
The course is co-taught by two faculty course directors, a team of teaching assistants, and a curriculum fellow. Curriculum fellows are PhD level scientists who support curriculum design, improvement, and innovation [24]. Teaching assistants are recruited from graduate students in our departments who use MATLAB in their research work. This means that they are both pro-ficient in MATLAB, and also that they can speak to the applications of computational tools in their scientific area of interest, thus serving as peer role models to our students. Many of our teaching assistants have taken QMBC before, and are thus familiar with the course structure and content. TAs prepare for the course by going through the course material online and at-tending a one-hour training session prior to the course.
Because our teaching approach requires hands-on exercises and individualized support, we have found a ratio of approximately one instructor for every seven students to be ideal given the resources available to us. However, we have found that certain parts of the course require more intensive assistance than others, and this knowledge could be used to more effectively al-locate a smaller number of TAs.
The course is structured as a two-week intensive“boot camp”in which five full, mandatory days alternate with four optional half-day sessions (16 additional contact hours) that allow stu-dents to reinforce core skills and concepts. Student enrollment for the past five offerings is shown inTable 4.
Instruction in QMBC is focused on practice, with short lecture segments interspersed with self-paced problems like the one discussed above to allow students to implement, reinforce,
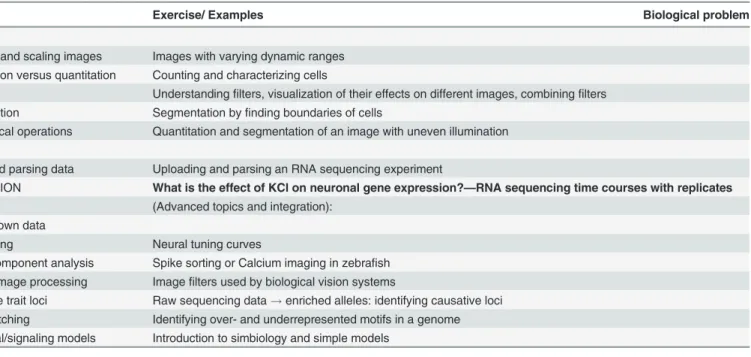
Table 3. Overview of course Days 4 and 5.
Topic Exercise/ Examples Biological problem Day 4
Visualizing and scaling images Images with varying dynamic ranges Segmentation versus quantitation Counting and characterizing cells
Filtering Understandingfilters, visualization of their effects on different images, combiningfilters Edge detection Segmentation byfinding boundaries of cells
Morphological operations Quantitation and segmentation of an image with uneven illumination
Day 5
Loading and parsing data Uploading and parsing an RNA sequencing experiment
INTEGRATION What is the effect of KCl on neuronal gene expression?—RNA sequencing time courses with replicates Options (Advanced topics and integration):
Bring your own data
Bootstrapping Neural tuning curves
Principal component analysis Spike sorting or Calcium imaging in zebrafish Biological image processing Imagefilters used by biological vision systems
Quantitative trait loci Raw sequencing data!enriched alleles: identifying causative loci Pattern matching Identifying over- and underrepresented motifs in a genome Biochemical/signaling models Introduction to simbiology and simple models
Summary of the topics covered on Days 4 and 5 of the course, the examples and exercise, and the biological motivation.
and synthesize new content. All concepts in QMBC are taught using MATLAB [17]. While stu-dents are solving these problems, instructors and teaching assistants walk around the room to answer questions, discuss possible solutions, and provide feedback. In addition, we encourage students to work together in small groups.
The interaction with instructors provides students and instructors with continuous feedback on their work. To further facilitate this type of formative assessment, lecture segment and prac-tice modules are supported by Learning Catalytics, an online platform through which students can answer questions in real time, provide feedback on their understanding of the course mate-rials, and complete exercises (S4 Text) [25]. Students can find course schedules, exercises, and other information on our course website athttp://springerlab.org/qmbc/. Course content and
Table 4. Student enrollment in QMBC.
Spring 2012 Summer 2012 Spring 2013 Summer 2013 Spring 2014
74 94 37 74 44
Student enrollment in QMBC, Spring 2012 to Spring 2014
doi:10.1371/journal.pcbi.1004208.t004
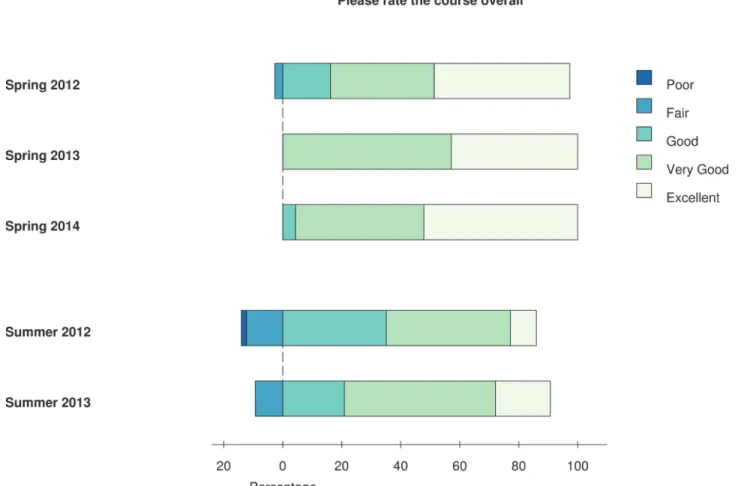
Fig 1. Overall course experience.Students were asked after each course to rate their overall experience on a five-point scale (Poor, Fair, Good, Very Good, or Excellent). Diverging stacked bars are centered between Fair and Good. To allow comparison between different course offerings, data for each year was normalized by the total number of respondents. Spring 2012:n= 37, Spring 2013:n= 21, Spring 2014:n= 24, Summer 2012:n= 57, Summer 2013:n= 43.
exercises can also be accessed on GitHub underhttps://github.com/MelanieIStefan/QMBC. The materials are licensed under a Creative Commons Attribution-NonCommercial-ShareA-like 4.0 International License (http://creativecommons.org/licenses/by-nc-sa/4.0/). The course is graded on a pass/fail scale and students are assigned a passing grade based on attendance at all full-day sessions and completion of all in-class and homework exercises.
Course Evaluation
We ask students to complete postcourse surveys after every offering. Results from the last five offerings (Spring 2012 to Spring 2014; see S9 for details), reveal that students report a positive course experience overall (Fig 1), with a large majority of respondents rating the course as
“good,” “very good,”or“excellent.”Overall ratings are better for spring courses (97%, 100%, and 100% of ratings“good”or better) than for summer courses (86% and 91%). Spring courses are offered to upper-division graduate students and a few postdoctoral researchers, while sum-mer courses are offered to incoming graduate students (and participation is highly recom-mended by some of the graduate programs). This results in the summer offering usually having a larger class size. In addition, students who elect to take the class in spring are often motivated by a concrete research problem they want to solve and are typically beginners or near-begin-ners at programming. In summary, our spring classes tend to be smaller, more motivated, and more homogeneous, all of which might contribute to increased student satisfaction. In both spring and summer offerings, we see a general trend of improvement in students’ratings over the years the course has been offered, reflecting the success of iterative improvements in course structure, material, and delivery (S5 Text).
In terms of learning outcomes, students show significant gains in their self-assessed pro-gramming ability (Fig 2andS5 Text). They report a good understanding of programming skills taught early in the course, and find some of the concepts around statistics most challenging (Fig 3andS5 Text).
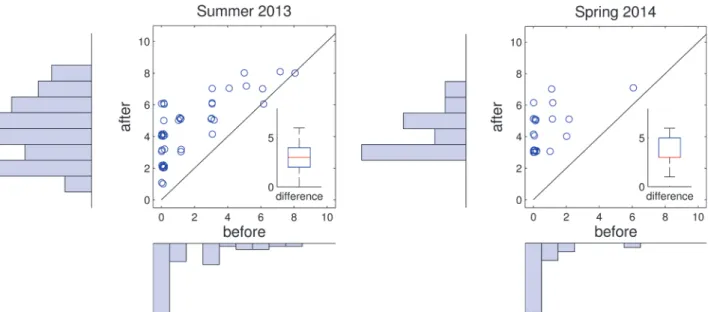
Fig 2. Increase in self-reported MATLAB programming skills.In the postcourse survey, students were asked:“Rate your ability to program in MATLAB before the course,”and“Rate your ability to program in MATLAB after the course.”Answers were given on a scale from 0 (novice) to 11 (expert). Upper panel: Summer 2013, lower panel: Spring 2014. Scatter plot: Each student is represented by a circle. The diagonal represents no improvement in skill. Insert: Increase in self-reported skill (after-before). Summer 2013:n= 43, Spring 2014:n= 24.
The postcourse survey also asked students to evaluate the potential impact of the course on their research and scholarship. This allows us to see whether we are likely to have met our lon-ger-term learning goals and to gauge students’attitudes towards using computational tools and quantitative reasoning in their future careers. Survey responses indicate that students feel they have acquired practical and cognitive skills that prepare them to use quantitative and computa-tional methods in their work and scholarship, recognize the value of computacomputa-tional and quan-titative approaches, feel confident using them, and would encourage others to learn more about them (Fig 4andS5 Text).
Continuing Support
After completion of QMBC, students have regular opportunities to maintain and develop their quantitative skills. Computational modules are increasingly included across the curriculum in
Fig 3. Self-assessed understanding of concepts and skills.Data shown is for the Spring 2014 offering of the course. Students were asked to rate their understanding of specific skills on a five-point scale (Poor to Excellent, as above). Skills are listed in the order in which they are introduced at QMBC.n= 24.
the Harvard Medical School’s Programs in Graduate Education. Students also have the oppor-tunity to take computationally oriented“nanocourses”offered at Harvard Medical School [26]. In addition, we have initiated a weekly data club/help desk session where students can bring quantitative and computational questions that have arisen in their research. Thus QMBC is embedded within a wider quantitative curriculum for graduate students. We hope that this will be part of a community effort to develop material that can be shared between courses across universities.
Students wanting to improve their quantitative and computational skills now have unprece-dented access to training materials and courses online, including through dedicated learning platforms such as codecademy (http://www.codecademy.com/about) or the Software Carpen-try project (http://software-carpentry.org), and through a wide range of Massive Open Online Courses [7,8]. With our two-week boot camp, we want to teach basic concepts, increase stu-dents’confidence and awaken their curiosity and willingness to learn more, so that they can benefit from other educational opportunities, both on and off campus. Ideally, QMBC will be the beginning of a lifelong learning journey in this particular field.
Conclusion
QMBC offers targeted instruction in quantitative and computational skills for life science grad-uate students at Harvard Medical School. The course benefits from a hands-on approach to programming, ample opportunity for practice in dedicated sessions, and structured exercises that appeal to beginners and advanced students alike. We are fortunate enough to be able to
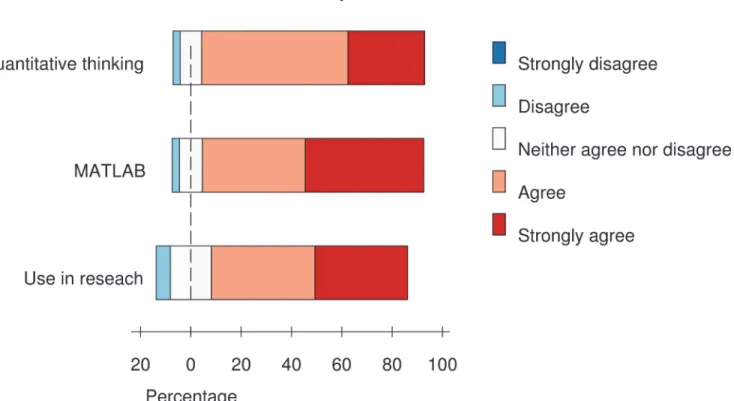
Fig 4. Future impact of the course.Students were asked to rate their agreement with the following three questions:“This course provided a practical base and starting point for using MATLAB in my own work,” “The workshop provided me with a practical base/starting point for analyzing quantitative problems,” and“This course has increased the likelihood I will use quantitative methods in my research.”Rating was on a five-point scale (Strongly disagree to strongly agree). Data shown are pooled responses from the last four offerings of the course (Summer 2012 to Spring 2014).n= 141.
run the course with a high instructor-to-student ratio (about 1:7), which we feel is helpful, but not indispensable for reaching our course goals. Evidence from postcourse surveys indicates that the course helps students to develop their quantitative problem-solving skills, increase their programming ability, and develop a positive attitude towards quantitative thinking. While our course is geared for graduate level biologists, we believe the approaches we take are widely applicable both to other graduate disciplines and at the undergraduate level. Additional-ly, we believe the content and approaches we use here could be adapted to a semester-long course that employs classroom time for independent and group work on programming exercises.
As described here, this course helps to lower the activation barrier for students to engage with computational methods and has increased the number of students using computation ap-proaches in our graduate programs. However, the course alone is not a panacea. To be truly successful, computational problems and approaches must be integrated throughout the gradu-ate curriculum that follows the boot camp, so that students continue to gain proficiency and expertise throughout their graduate career. If we can succeed in this effort, our graduate stu-dents will be well positioned to grapple with the experimental questions of the 21st century.
Supporting Information
S1 Code. Solution to the Rattus binomialis exercise.
(ZIP)
S1 Text. Daily learning goals and objectives for QMBC.
(ZIP)
S2 Text. Text of the yeast metabolism exercise and detailed description of the exercise.
(PDF)
S3 Text. Text of the Rattus binomialis exercise and detailed description of the exercise.
(PDF)
S4 Text. Why we use Learning Catalytics.
(PDF)
S5 Text. Details on course assessment and students’rating of QMBC.Includes Figures S1– S20.
(PDF)
Acknowledgments
We thank Till Hartmann, Douglas Ruff, Alexandra Smolyanskaya, and Jue Wang for help with developing the Rattus exercise; Kueh Hao, Jue Wang, and Zeba Wunderlich for help develop-ing the programmdevelop-ing course packet; and Renan Escalante Chong, Rishi Jajoo, and Jue Wang for help with the yeast metabolism exercise. We thank Tamara Brenner for helpful comments on the manuscript.
References
1. Steen LA. The‘Gift’of Mathematics in the Era of Biology. In: Steen LA, editor. Math and Bio 2010: Link-ing Undergraduate Disciplines. WashLink-ington DC: Mathematical Association of America; 2005. p. 13– 25.
2. On Undergraduate Biology Education to Prepare Research Scientists for the 21st Century NRCUC, et al. BIO2010: Transforming undergraduate education for future research biologists. National Acade-mies Press ( US); 2003.
3. Brewer CA, Smith D. Vision and change in undergraduate biology education: a call to action. American Association for the Advancement of Science, Washington, DC. 2011.
4. Smolinski TG. Computer literacy for life sciences: helping the digital-era biology undergraduates face today’s research. CBE Life Sci Educ. 2010; 9(3):357–363. doi:10.1187/cbe.10-03-0050PMID: 20810969
5. Windish DM, Huot SJ, Green ML. Medicine residents’understanding of the biostatistics and results in the medical literature. JAMA. 2007 Sep; 298(9):1010–1022. PMID:17785646
6. Eglen SJ. A quick guide to teaching R programming to computational biology students. PLoS Comput Biol. 2009 Aug; 5(8):e1000482. doi:10.1371/journal.pcbi.1000482PMID:19714211
7. Searls DB. Ten simple rules for online learning. PLoS Comput Biol. 2012; 8(9):e1002631. doi:10.1371/ journal.pcbi.1002631PMID:23028268
8. Searls DB. An online bioinformatics curriculum. PLoS Comput Biol. 2012; 8(9):e1002632. doi:10.1371/ journal.pcbi.1002632PMID:23028269
9. Via A, De Las Rivas J, Attwood TK, Landsman D, Brazas MD, Leunissen JAM, et al. Ten simple rules for developing a short bioinformatics training course. PLoS Comput Biol. 2011 Oct; 7(10):e1002245. doi:10.1371/journal.pcbi.1002245PMID:22046119
10. Vaux DL. Research methods: Know when your numbers are significant. Nature. 2012 Dec; 492 (7428):180–181. doi:10.1038/492180aPMID:23235861
11. Gross LJ. Education for a biocomplex future. Science. 2000 May; 288(5467):807. PMID:10809649
12. Speth EB, Momsen JL, Moyerbrailean GA, Ebert-May D, Long TM, Wyse S, et al. 1, 2, 3, 4: infusing quantitative literacy into introductory biology. CBE Life Sci Educ. 2010; 9(3):323–332. doi:10.1187/ cbe.10-03-0033PMID:20810965
13. Colon-Berlingeri M, Burrowes PA. Teaching biology through statistics: application of statistical methods in genetics and zoology courses. CBE Life Sci Educ. 2011; 10(3):259–267. doi: 10.1187/cbe.10-11-0137PMID:21885822
14. Depelteau AM, Joplin KH, Govett A, Miller HA 3rd, Seier E. SYMBIOSIS: development, implementation, and assessment of a model curriculum across biology and mathematics at the introductory level. CBE Life Sci Educ. 2010; 9(3):342–347. doi:10.1187/cbe.10-05-0071PMID:20810967
15. Thompson KV, Cooke TJ, Fagan WF, Gulick D, Levy D, Nelson KC, et al. Infusing quantitative ap-proaches throughout the biological sciences curriculum. International Journal of Mathematical Educa-tion in Science and Technology. 2013; 44(6):817–833.
16. Madlung A, Bremer M, Himelblau E, Tullis A. A study assessing the potential of negative effects in inter-disciplinary math-biology instruction. CBE Life Sci Educ. 2011; 10(1):43–54. doi: 10.1187/cbe.10-08-0102PMID:21364099
17. The MathWorks, Inc. MATLAB; 2013. Natick, Massachusetts, United States.
18. Simmons JP, Nelson LD, Simonsohn U. False-positive psychology: undisclosed flexibility in data col-lection and analysis allows presenting anything as significant. Psychol Sci. 2011 Nov; 22(11):1359– 1366. doi:10.1177/0956797611417632PMID:22006061
19. Bloom B. A taxonomy of cognitive objectives. New York: McKay. 1956;.
20. Fuller U, Johnson CG, Ahoniemi T, Cukierman D, Hernán-Losada I, Jackova J, et al. Developing a computer science-specific learning taxonomy. ACM SIGCSE Bulletin. 2007; 39(4):152–170.
21. Costa MJ, Galembeck E, Marson GA, Torres BB. A quick guide for computer-assisted instruction in computational biology and bioinformatics. PLoS Comput Biol. 2008 Apr; 4(4):e1000035. doi:10.1371/ journal.pcbi.1000035PMID:18437234
22. Uchida N, Mainen ZF. Speed and accuracy of olfactory discrimination in the rat. Nat Neurosci. 2003 Nov; 6(11):1224–1229. PMID:14566341
23. Efron B, Tibshirani RJ. An introduction to the bootstrap. vol. 57. CRC press; 1994.
24. Gutlerner JL, Van Vactor D. Catalyzing curriculum evolution in graduate science education. Cell. 2013 May; 153(4):731–736. doi:10.1016/j.cell.2013.04.027PMID:23663771
25. Schell J, Lukoff B, Mazur E. Catalyzing Learner Engagement Using Cutting-Edge Classroom Re-sponse Systems in Higher Education. In: Wankel C, editor. Increasing Student Engagement and Reten-tion using Classroom Technologies: Classroom Response Systems and Mediated Discourse
Technologies. Cutting-edge Technologies in Higher Education. Emerald; 2013. p. 233–261.
26. Bentley AM, Artavanis-Tsakonas S, Stanford JS. Nanocourses: a short course format as an education-al tool in a biologiceducation-al sciences graduate curriculum. CBE Life Sci Educ. 2008; 7(2):175–183. doi:10. 1187/cbe.07-07-0049PMID:18519608