Queen Elizabeth House (QEH), University of Oxford
This study has been prepared within the OPHI theme on multidimensional measurement.
OPHI gratefully acknowledges support for its research and activities from the Government of Canada through the International Development Research Centre (IDRC) and the Canadian International Development Agency (CIDA), the Australian Agency for International Development (AusAID), and the United Kingdom Department for International
1
OPHI
W
ORKING
P
APER
N
O
. 38
Acute Multidimensional Poverty:
A New Index for Developing Countries
Sabina Alkire
1and Maria Emma Santos
2July 2010
Abstract
This paper presents a new Multidimensional Poverty Index (MPI) for 104 developing countries. It is the first time multidimensional poverty is estimated using micro datasets (household surveys) for such a large number of countries which cover about 78 percent of the world´s population. The MPI has the mathematical structure of one of the Alkire and Foster poverty multidimensional measures and it is composed of ten indicators corresponding to same three dimensions as the Human Development Index: Education, Health and Standard of Living. The MPI captures a set of direct deprivations that batter a person at the same time. This tool could be used to target the poorest, track the Millennium Development Goals, and design policies that directly address the interlocking deprivations poor people experience. This paper presents the methodology and components in the MPI, describes main results, and shares basic robustness tests.
Keywords: Poverty Measurement, Multidimensional Poverty, Capability Approach, Multidimensional Welfare, Human Development, HDI, HPI.
JEL classification: I3, I32, D63, O1
1 Oxford Poverty & Human Development Initiative (OPHI), Queen Elizabeth House (QEH), Department of International
Development, 3 Mansfield Road, Oxford OX4 1SD, UK +44 1865 271915, [email protected]
2 Oxford Poverty and Human Development Initiative, UK and Consejo Nacional de Investigaciones Científicas y Técnicas,
Queen Elizabeth House (QEH), University of Oxford
This study has been prepared within the OPHI theme on multidimensional measurement.
OPHI gratefully acknowledges support for its research and activities from the Government of Canada through the International Development Research Centre (IDRC) and the Canadian International Development Agency (CIDA), the Australian Agency for International Development (AusAID), and the United Kingdom Department for International
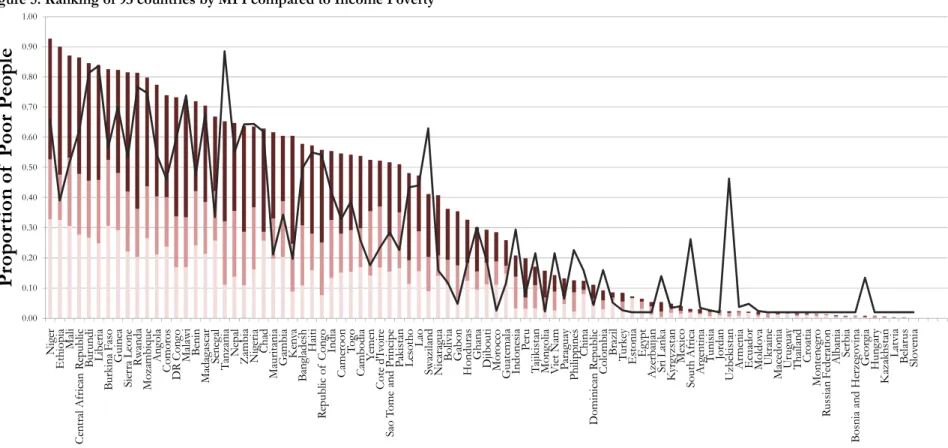
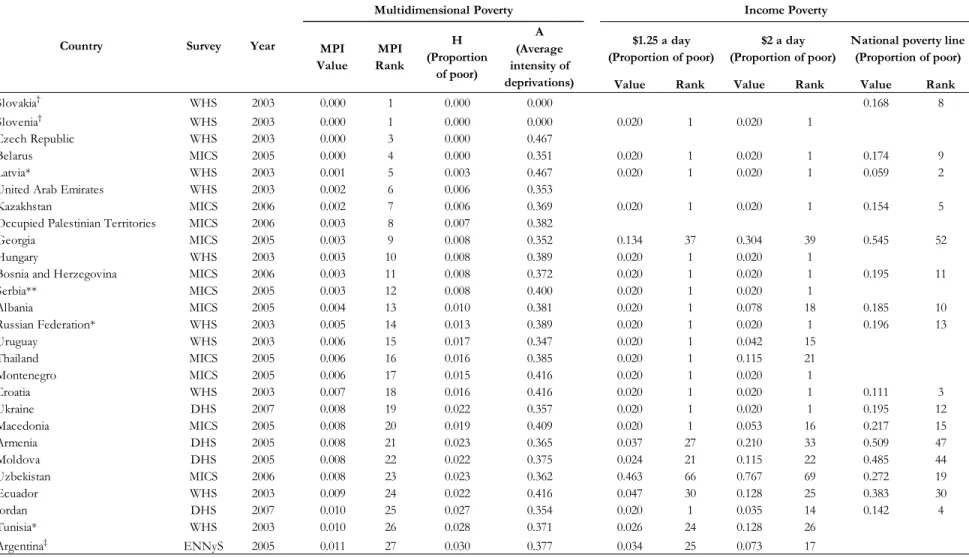
2 0. 00 0.10 0.20 0.30 0.40 500. 0.60 0.70 0.80 0.90 1.00 Niger Ethiopia Mali Central African Republic Burundi Liberia Burkina Faso Guinea Sierra Leone Rwanda Mozambique Angola Comoros DR Congo Malawi Benin Madagascar Senegal Tanzania Nepal Zambia Nigeria Chad Mauritania Gambia Kenya Bangladesh Haiti Republic of Congo India Cameroon Togo Cambodia Yemen Cote d'Ivoire Sao Tome and Principe Pakistan Lesotho Lao Swaziland Nicaragua Bolivia Gabon Honduras Ghana Djibouti Morocco Guatemala Indonesia Peru Tajikistan Mongolia Viet Nam Paraguay Philippines China Dominican Republic Colombia Brazil Turkey Estonia Egypt Azerbaijan Sri Lanka Kyrgyzstan Mexico South Africa Argentina Tunisia Jordan Uzbekistan Armenia Ecuador Moldova Ukraine Macedonia Uruguay Thailand Croatia Montenegro Russian Federation Albania Serbia Bosnia and Herzegovina Georgia Hungary Kazakhstan Latvia Belarus Slovenia
Proportion of Poor People
Co ntr ib uti on e duc at io n Co nt ributi on hea lth Co nt ributi on l ivi ng st anda rd s $1. 25 a da y po or
Queen Elizabeth House (QEH), University of Oxford
This study has been prepared within the OPHI theme on multidimensional measurement.
OPHI gratefully acknowledges support for its research and activities from the Government of Canada through the International Development Research Centre (IDRC) and the Canadian International Development Agency (CIDA), the Australian Agency for International Development (AusAID), and the United Kingdom Department for International
3 Acknowledgements
We warmly acknowledge the contribution of many colleagues and co-workers in this project. In particular, we are grateful to our colleagues at the HDRO and UNDP for their substantive engagement at every step. We are grateful for competent calculations of the MPI to: Mauricio
Apablaza, Yele Batana, Marta Barazzetta, Mauro Caselli, Ivan Gonzalez De Alba, Enrique Hennings, Salvatore Morelli, Juan Pablo Ocampo Sheen, Jose Manuel Roche, Suman Seth, Shabana Singh, Babak Somekh, Ana Vaz, Rosa Vidarte, Zheng Zhi, Shuyang Ren. We are grateful for support and research assistance from: Gisela Robles Aguilar, Uma Pradhan, and Alejandro Ratazzi. We wish to acknowledge special contributions from: Yele Batana (Dominance analysis to changes in k), Juan Pablo Ocampo Sheen and Mauricio Apablaza (estimates of MPI for previous points in time), Jose Manual Roche (Cluster Analysis), Suman Seth (India, Kenya and Bolivia Decompositions), Shabana Singh (MPI and Income Poverty). Gisela Robles compiled the Tables, and Uma Pradhan managed the databases. We also wish to thank other OPHI team members for their support and substantive input: Gaston Yalonetzky, Sarah Valenti, Natalie Cresswell, Paddy Coulter, Moizza Sarwar, Emma Samman, Aparna John, Ann Barham and John Hammock. In selecting the indicators from the datasets, we had very useful conversations with Shea Rutstein and Ann Way at DHS, Attila Hacioglu at MICS, Somnath Chaterjee at WHS. As the health indicators were particularly problematic, we were grateful for the input from Lincoln Chen, Chris Murray, Tim Evans, Colin Mathers, Ritu Sadhana, and Proochista Ariana; we are also grateful to Rolf Luyendijk for advice on the sanitation variable. Very useful comments were received from many including Sudhir Anand, Tony Atkinson, Francois Bourguignon, James Foster, Amie Gaye, Stephan Klasen, Jeni Klugman, Michael Noble, Francisco Rodriguez, Amartya Sen, Frances Stewart, Xiaolan Wang, Gemma Wright, the Advisory Group to the UNDP HDRO, the Statistical Advisory Group for the UNDP HDRO, and
participants in the Harvard Consultation and OPHI workshop. This paper uses data from the Demographic and Health Surveys (USAID), UNICEF Multiple Indicator Cluster Surveys, and WHO World Health Surveys. In addition to the HDRO, this project was funded by the
Queen Elizabeth House (QEH), University of Oxford
This study has been prepared within the OPHI theme on multidimensional measurement.
OPHI gratefully acknowledges support for its research and activities from the Government of Canada through the International Development Research Centre (IDRC) and the Canadian International Development Agency (CIDA), the Australian Agency for International Development (AusAID), and the United Kingdom Department for International
4
CONTENTS
1. Introduction ... 6
1.1 Multidimensional Poverty Index: Basic Overview ... 7
2. Methodology ... 9
2.1 Alkire Foster Method ... 9
2.2 Choice of Dimensions ... 11
2.3 Choice of Indicators and Unit of Analysis ... 13
2.4 Cutoffs for each Indicator ... 17
2.5 IndicatorWeights ... 18
2.6 Poverty cutoff k ... 19
3. Data ... 20
3.1 Surveys used ... 20
3.2 Available information in each survey ... 22
3.3 Treatment of households with non-applicable population ... 26
3.4 Treatment of missing data and sample sizes ... 27
4.Results ... 28
4.1 Who is poor? Global Overview ... 30
4.2 Income poverty, wealth poverty, and the MPI ... 39
4.3 Regional Analysis ... 45
4.4 Decompositions by state and ethnic group ... 48
4.5 Clustered Deprivations ... 51
4.6 Changes of MPI over time ... 53
4.7 Robustness of country rankings to changes in indicators’ cutoffs ... 57
4.8 Robustness of country rankings to changes in the cross-dimensional cutoff……….58
4.9 Robustness of country rankings to changes in the indicators' weights………..62
5.Concluding Remarks ... 63
References ... 66 List of Figures
Figure 1: Tracking Improvements in Child Nutrition Figure 2: Dimensions and Indicators of MPI
Figure 3: Dimensions, Indicators, Cutoffs and Weights of the MPI Figure 4: Diagram of Dimensions and Indictors of the MPI
Figure 5: Ranking of 93 countries by MPI compared to Income Poverty Figure 6: Distribution of the MPI poor vs. Total Population
Figure 8: Composition of MPI by H and A
Figure 9: Categorisation of countries by their combination of H and A Figure 10: Contribution by Dimension to MPI
Figure 11: Correlations of Income Poverty Headcounts with MPI and dimensional headcounts Figure 12: Scatter plot of MPI vs. $1.25/day headcount
Figure 13: Scatter plot of GDP per capita vs. MPI Headcount Figure 14: Crosstab of Income and MPI Poverty
Figure 15: Income Poverty vs. MPI Poverty in Sri Lanka, China and Chad
Figure 16: Income Poverty vs. MPI Poverty: insightful mismatches
Figure 17: DHS Wealth Index vs. MPI Poverty: insightful mismatches
Figure 18: Summary MPI and income poverty estimates by UN regions Figure 19: Map of India MPI by State
Figure 20: MPI Estimates of Kenyan States Compared with Aggregate MPI in other countries Figure 21: Composition of Poverty in Two Indian States
Figure 22: MPI Composition Patterns
Figure 23: Five ‘Types’ of poverty found across countries
Figure 24: Malnutrition and Child Mortality in Sub-Saharan Africa and South Asia Figure 25: MPI in two points in time in Bangladesh, Ethiopia and Ghana
Figure 26: Decomposition of changes in MPI over time in Bangladesh, Ethiopia and Ghana
Figure 27: Decomposition of changes in MPI over time in Bangladesh, Ethiopia and Ghana - Rural and Urban Figure28: Ratio of Rural MPI to Urban MPI in two points in time in Bangladesh, Ethiopia and Ghana
Figure 29: Changes in Deprivation in each Indicator - Bangladesh, Ethiopia and Ghana
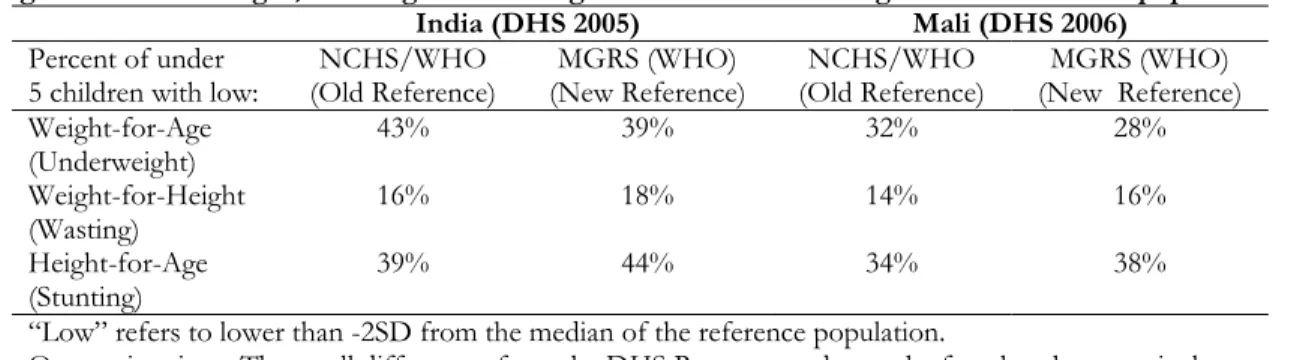
Figure 30: Underweight, Stunting and Wasting in India and Mali using different reference populations Figure 31: Examples of Robustness to the k-cutoff for countries by UN Regions
List of Appendices
Appendix 1: Tables of Estimation Results
Appendix 2: Tables of Sample Sizes and Non-Response Rates
Appendix 3: Decomposition results for India, Kenya and Bolivia
Appendix 4: Differences in children´s nutritional reference populations
Appendix 5: Correlations between different specifications of MPI
Acronyms:
A: The intensity of Multidimensional Poverty, measured by the proportion of weighted indicators in which the average Multidimensional-poor person is deprived.
CHNS: China Health and Nutrition Survey (here using 2006)
DHS: Demographic and Health Survey
ENSANUT: National Survey of Health and Nutrition for Mexico (Encuesta Nacional de Salud y Nutricion,
2006
ENNyS: National Survey of Nutrition and Health, for Argentia (Encuesta Nacional de Nutricion y Salud,
2004-2005
H: Headcount, or the proportion of the population who are identified as poor
MPI: Multidimensional Poverty Index
MICS: Multiple Indicator Cluster Survey
WHS: World Health Survey
HDI: Human Development Index
HPI: Human Poverty Index
UN: United Nations
WHO: World Health Organization
1.
I
NTRODUCTION
In June 2010, the UNDP released an assessment of What it would take to reach the Millennium
Development Goals (MDGs hereafter) based on detailed studies in 50 countries. Its first key message is that we need to address the deprivations that trap people in poverty together. Because they are interconnected: “acceleration in one goal often speeds up progress in others…. Given these synergistic and multiplier effects, all the goals need to be given equal attention and achieved simultaneously.” In doing so, the report echoed and strengthened an insight from the 2001 UN Roadmap towards the Implementation of the MDGs, which pointed out that “all the issues around poverty are interconnected and demand crosscutting solutions” (p 3). But how are the interconnections to be seen, and how can they inform ‘crosscutting’ solutions?
Amartya Sen, Nobel Laureate in Economics whose work underpins the concept and measures of human development, has argued powerfully for the need to take a multidimensional approach to poverty as well as development: “Human lives are battered and diminished in all kinds of different ways, and the first task… is to acknowledge that deprivations of very different kinds have to be accommodated within a general overarching framework” (Sen 2000). Sen’s perspective has implications for poverty measurement. “The need for a multidimensional view of poverty and deprivation,” Anand and Sen wrote in 1997, “guides the search for an adequate indicator of human poverty.”3
Informed and inspired by previous work,4 this paper implements a new international measure of acute multidimensional poverty for 104 countries. What is distinctive about this multidimensional poverty index, or MPI, is that it reflects the overlapping deprivations that members of a household experience. By providing information on the joint distribution of deprivations related to the MDGs – which shows the intensity and the composition of several aspects of poverty at the same time – we have tried to explore how better measures could support efforts to accelerate the reduction of multidimensional poverty.
Map of paper. The paper proceeds as follows. First, we set the context for the MPI by describing the main differences between MPI and income poverty measures, and MDG indicators. Next, we describe the construction of the MPI, focusing on the normative selection of dimensions, indicators, cutoffs and weights; on the influence of data limitations; and on the methodology for identifying who is poor and aggregating data into a poverty index. We signal the main axiomatic properties of the MPI which make it particularly suited for the policy analysis that follows. Next, we introduce the data sources used to calculate the MPI and the particular considerations and adaptations we have made for each indicator. Following this, we present the main results of the MPI. First, we present the MPI findings and undertake key comparisons. Second, we drill down to explore more finely the relationship between MPI and income data. Third, we illustrate further features of the MPI that can inform policy analysis: we decompose the MPI in greater detail for certain countries; we identify distinct ‘types’ of poverty that begin to illustrate different regular patterns of deprivation, or poverty traps; and we explore changes in the MPI over time using time series data for three countries. Finally, we present a set of robustness tests for the MPI that focus on its robustness to changes in poverty cutoffs, to changes in certain variables, and in the cross-dimensional cutoff k. We close by
3 See also Sen 1992, Sen 1993, Foster and Sen 1997
4 In particular, the works cited above and also Bourguignon and Chakravarty (2003), Atkinson (2003), and Brandolini &
identifying additional avenues for further scrutiny, such as the relationship between MPI and household size and composition, or robustness tests on the indicator weights.
1.1 Multidimensional Poverty Index: Basic Overview
The MPI is an index of acute multidimensional poverty. It reflects deprivations in very rudimentary services and core human functionings for people across 104 countries. Although deeply constrained by data limitations, the MPI reveals a different pattern of poverty than income poverty, as it illuminates a different set of deprivations. The MPI has three dimensions: health, education, and standard of living. These are measured using ten indicators. Poor households are identified and an aggregate measure constructed using the methodology proposed by Alkire and Foster (2007, 2009). Each dimension is equally weighted; each indicator within a dimension is also equally weighted. The MPI reveals the combination of deprivations that batter a household at the same time. A household is identified as multidimensionally poor if, and only if, it is deprived in some combination of indicators whose weighted sum is 30 percent or more of the dimensions. The dimensions, indicators, and deprivation criteria are presented below and explained with detail in the following section.
1. Health (each indicator weighted equally at 1/6)
Child Mortality: If any child has died in the family
Nutrition: If any adult or child in the family is malnourished 2. Education (each indicator weighted equally at 1/6 )
Years of Schooling If no household member has completed 5 years of schooling Child School Attendance If any school-aged child is out of school in years 1 to 8 3. Standard of Living (each of the six indicators weighted equally at 1/18)
Electricity If household does not have electricity
Drinking water If does not meet MDG definitions, or is more than 30 mins walk Sanitation If does not meet MDG definitions, or the toilet is shared
Flooring If the floor is dirt, sand, or dung
Cooking Fuel If they cook with wood, charcoal, or dung
Assets If do not own more than one of: radio, tv, telephone, bike, motorbike or refrigerator and do not own a car or truck.
The MPI is the product of two numbers: the Headcount H or percentage of people who are poor, and the Average Intensity of deprivation A – which reflects the proportion of dimensions in which households are deprived. Alkire and Foster show that this measure is very easy to calculate and interpret, is intuitive yet robust, and satisfies many desirable properties.
1.2 Millennium Development Goals (MDGs)
Since 2000, the United Nations and World Bank have compiled and reported data on the progress of nations and regions with respect to a uniform set of targets and indicators. These targets and indicators were agreed upon within the MDG framework, and countries’ progress towards them has been monitored. The additional quantitative targets are needed because income poverty measures provide vitally important but incomplete guidance to redress multidimensional poverty.
Figure 1: Tracking the MDGs by percentage of developing countries
The MDGs catalysed the collection and compilation of comparable international data related to the agreed goals and targets. The MDG statistics are presented annually and have been tremendously useful in providing feedback regarding improved development outcomes and in creating incentives to address core deprivations.
Unlike the MPI, however, the international MDG reports invariably report progress on each indicator singly. No composite MDG index has been developed, and few studies have reflected the interconnections between indicators. The reason that no composite MDG index has been developed is plain to see: the ‘denominator’ or base population of MDG indicators differ. In some cases it is all people (malnutrition, income); in some cases children (primary school, immunization), or youth 15-24 (literacy), or childbearing women (maternal mortality), or households (access to secure tenure), and so on. Some environmental indicators do not refer to human populations at all. Given this diversity of indicators, it is difficult to construct an index that meaningfully brings all deprivations into the same frame.
What the MPI does in relation to the MDGs is the following. First, it employs indicators that relate to the MDGs: 8 of the 10 indicators are directly linked to MDGs; the other two (electricity, flooring) are plausibly related. Second, the MPI establishes the ‘base’ population as being the household. People live in households, the suffering of one member affects other members, and similarly the abilities of one member (e.g. literacy) often help other household members. Third, within these parameters, insofar as data permit, the MPI illuminates the simultaneous deprivations of households. This enables us to identify different ‘types’ of deprivations – clusters of deprivations that occur regularly in different countries or groups. Such a measure can thus contribute to a better understanding of the interconnectedness among deprivations, can help identify poverty traps, and can thus strengthen the composition and sequencing of interventions required to meet the MDGs. It is indeed our hope that the MPI will support efforts to accelerate progress towards the MDGs.
A final comment on the MPI analysis in comparison with the MDG reports is that in this paper we have often focused our results on people rather than nations. Many MDG reports identify the percentage of countries that are ‘on target’ to meet the MDGs. Such analyses do not present any information on the actual number of people who are deprived – although the MDGs were deemed feasible at a global not national level. Reporting the MDGs entirely in terms of countries deeply under-emphasises poor people in large countries. India has 3,000 times as many people as the Maldives, but each contribute equally as one South Asian country. In effect, this means that each Indian citizen’s life is weighted 1/3000th as much as a citizen of the Maldives. This aspect of the MDG reporting system is pervasive, affecting all Global Monitoring Reports (the above figure is from p 25 of the 2010 Report), for example, and summary tables on progress to achieving the MDGs. Yet in a human rights-based approach and many other ethical approaches, every human life is to be given equal weight. For this reason, our analysis of MPI emphasizes the number of people whose lives are
diminished by multiple deprivations – not the number of countries. Naturally, because many policies are constructed at the national level, we also report the percentage of people in different countries who are deprived and the intensity of their poverty, as these data are tremendously useful to incentivize and celebrate progress.
2.
M
ETHODOLOGY
2.1
Alkire Foster Method
As a measure, the MPI has the mathematical structure of one member of a family of multidimensional poverty measures proposed by Alkire and Foster (2007, 2009). This member of that family is called M0 or Adjusted Headcount Ratio. M0 is the appropriate measure to be used whenever one or more of the dimensions to be considered are of ordinal nature, meaning that their values have no cardinal meaning.5 In this section, we describe this mathematical structure which is actually a methodology for poverty measurement. For accuracy, we refer to the measure as M0. The MPI is the M0 measure with a particular selection of dimensions, indicators and weights, which will be explained below.
M0 measures poverty in ddimensions across a population of nindividuals.6 Let y yij denote the n d matrix of achievements for ipersons across j dimensions. The typical entry in the achievement yij ≥0 represents individual i’s achievement in dimension j. Each row vector yi (yi1,yi2,....,yid) gives individual i’s achievements in the different dimensions, whereas each column vector
) ,...., ,
(
.j y1j y2j ynj
y gives the distribution of achievements in dimension jacross individuals. M0 allows weighting each dimension differently. In fact, this is the procedure followed by the MPI, which has ‘nested weights’. For that purpose, we define a weighting vector w. The element wj
represents the weight that is applied to dimension j. Note that
dj1wj d, that is, the dimensional weights sum to the total number of dimensions. In the case of the MPI d=10.To identify who is poor among the population, a two-step procedure is applied using two different kinds of cutoffs. First we identify all individuals who are deprived in any dimension. Let zj0 be the poverty line (or deprivation cut-off) in dimension j, and z be the vector of poverty lines for each of the dimensions of multidimensional poverty. Define a matrix of deprivations 0 [ 0]
ij g g , whose typical element 0 ij g is defined by 0 ij j g w when yij zj, and 0 0 ij
g when yij zj. That is, the
th
ij entry of the matrix is equivalent to the dimensional weight wj when person i is deprived in
dimension j, and is zero when the person is not deprived.
5 For example, the type of source of drinkable water can be coded as 4 if the water source is some form of piped water,
3 if it is a public tap or standpipe, 2 if it a tube well, borehole or protected well, and 1 if it is some unprotected source. However the values 1, 2, 3, 4 have no meaning in themselves: having a value of 3 does not mean that the person is three times better off than another that has a value of 1.
6 Note that Alkire and Foster term ‘dimensions’ is what we have referred to as ‘indicators’ in this paper. The MPI is
composed of ten indicators, and the weighting vector takes the value of 0.56 for the living standard indicators and 1.67 for the indicators of health and education.
From the matrix g0we construct a column vector cof deprivation counts, whose ith entry 0 1 d i j ij c
g represents the sum of weighted deprivations suffered by person i7. Second, we need to identify who is to be considered multidimensionally poor. To do so, we select a second cutoff k>0 and apply it across this column vector c. More formally, let :Rd Rd
0,1 , k be the identification function that maps from person i´s achievement vector d
i
y R and cutoff vector z in Rd
to an indicator
variable. k takes the value of 1 when cik, and k(yi,z)0 when cik. That means that a
person is identified as poor if her weighted deprivation count is greater than or equal to k. This is called a dual cutoff method, because it uses the within dimension cutoffs zj to determine whether a person is deprived or not in each dimension, and the cross-dimensional cutoff k to determine who is to be considered poor.
To aggregate information about poor persons into the population-wide measure MPI, we focus on poor people by censoring the deprivations of persons who are deprived but non-poor given k. To do that we construct a second matrix g k0( ), obtained from g0 by replacing its ith
row 0 i
g with a vector of zeros whenever k= 0. This matrix contains the weighted deprivations of all persons who have been identified as poor and excludes deprivations of the non-poor. From this censored matrix we construct the censored vector of deprivation counts c k( )which differs from vector c in that it counts zero deprivations for those not identified as multidimensionally poor.8 M
0 is simply the mean of the matrix g k0( ), that is 0
0 ( ( ))
M g k , where μ denotes the arithmetic mean operator. In words, M0 is the weighted sum of the deprivations the poor experience divided by the total number of people times the total number of dimensions considered.9
Interestingly, it can be verified that M0 can also be expressed as the product of two intuitive measures: the (multidimensional) headcount ratio (H) and the average deprivation share among the poor (A). H is simply the proportion of people that are poor. That is, H q n where q is the number of poor people; it represents the incidence of multidimensional poverty. To understand A, we first notice that c k di( ) / indicates the fraction of weighted indicators in which the poor person i is deprived. The average of that fraction among those who are poor (q), is precisely A, where its expression is given by A
ni1c k dqi( ) . A represents the intensity of multidimensional poverty. In this way, the M0 measure summarises information on the incidence of poverty and its intensity, hence its name of Adjusted Headcount Ratio. As a consequence of combining both H and A, M0 satisfies dimensional monotonicity10: if a poor individual becomes deprived in an additional dimension, the M0 will increase. This is a very important advantage over the multidimensional headcount, which
7 Note that ci is simply the sum of all the entries in the ith row of matrix g0.
8 Note that 0( ) 0 ( , ) ij ij i
g k g y z and c ki( )ci( , )y zi .
9 In a more conventional notation: 0
0 1 1
n d ij i j
M
g nd.10 Alkire and Foster (2007) define the axiom formally and explain the intuition thus: “Dimensional monotonicity specifies
that poverty should fall when the improvement removes the deprivation entirely.” In other words, if a person who was deprived in four dimensions is now deprived in three dimensions only, by dimensional monotonicity, poverty should fall.
does not vary when the poor become poor in another dimension. Yet a society that has 30 percent of its population in poverty where –on average – the poor are deprived on average in six out of ten dimensions seems poorer than a society that although also having 30 percent of its population in poverty, the poor are deprived on average in three out of ten dimensions. M0 reflects this higher intensity, H does not.
Another important characteristic of M0 is that it is decomposable by population subgroups. Given two distributions x and y, corresponding to two population subgroups of size n(x) and n(y), the weighted sum of the subgroup poverty levels (weights referring to the population shares) equals the overall poverty level obtained when the two subgroups are merged (with the total population noted as n(x,y): 0 0 0 ( ) ( ) ( , ; ) ( , ) ( , ) ( , ) ( , ) n x n y M x y z M x z M y z n x y n x y
Additionally, after identification, M0 can be broken down by dimension. To see this, note that the measures can also be expressed in the following way: 0
0 1 ( * ( )) / d j j M
g k d, where 0 *j( ) g k isthe jth column of the censored matrixg k0( ). The contribution of dimension j to multidimensional
poverty can be expressed as 0
* 0
( ( ( )) / )
j j
Contr g k d M . Itemizing the contribution of each
dimension provides information that can be useful to reveal a group or region’s particular configuration of deprivations and to target poor persons. This is a second advantage of M0 over H, which does not allow such break-down.
The intuition of M0 – the proportion of the poor adjusted by the intensity of their poverty– together with its convenient properties of dimensional monotonicity and decomposability makes it a suitable measure to be adopted in an index that intends to be internationally comparable and robust as the MPI, and this is why we use the M0 structure in the MPI.11
The Alkire Foster M0 methodology does not specify dimensions, indicators, weights, or cutoffs; it is flexible and can be adapted to many contexts. The MPI, in contrast, has specified dimensions, indicators, weights, and cutoffs. In the remainder of this section, we explain how and why these were chosen.
2.2
Choice of Dimensions
Sen has argued that the choice of relevant functionings and capabilities for any poverty measure is a value judgment rather than a technical exercise. “There is no escape from the problem of evaluation in selecting a class of functionings in the description and appraisal of capabilities, and this selection problem is, in fact, one part of the general task of the choice of weights in making normative evaluation…. The need for selection and discrimination is neither an embarrassment, nor a unique difficulty, for conceptualizing functionings and capabilities” (Sen 2008).12
11 M
0also satisfies other properties: replication invariance, symmetry, poverty focus, deprivation focus, weak
monotonicity, non-triviality, normalisation, and weak re-arrangement.
12 As is well known, Nussbaum argues that a list of central human capabilities must be specified for the purpose of
constitutional guarantees. Her argument and Sen’s rejoinder arguing against the creation of one list of capabilities in general, can be found in these articles: Nussbaum 2003, Sen 2004a.
The potential dimensions that a measure of poverty might reflect are quite broad and include health, education, standard of living, empowerment, work, environment, safety from violence, social
relationships, and culture among others. In the context of choosing capabilities that have a moral weight akin to human rights, Sen has suggested focusing on dimensions that are of a) special importance to the society or people in question, and b) social influenceable – which means that they are an appropriate focus for public policy, rather than a private good or a capability like serenity which cannot be influenced from outside.13
In practice, the selection of the 2010 HDR dimensions has relied on the following mechanisms: a. The first is the literature arising from participatory exercises, which engage a representative
group of participants as reflective agents in making the value judgments to select focal capabilities. All of the dimensions for the MPI have been regularly identified as important elements of ill-being by communities.
b. The second is the use of some enduring consensus, particularly surrounding human rights and the Millennium Development Goals (MDGs).
c. The third is theory based, as in the many philosophical or psychological accounts of basic needs, universal values, human rights, and so on.
d. The fourth and the binding constraint is whether the data exist. Due to data constraints (as well as, perhaps, interpretability) we have had to severely limit the dimensions. For example, we do not have sufficient data on work or on empowerment. Yet each of these dimensions should arguably be considered in a human development-based multidimensional poverty measure.14
The MPI includes three dimensions: health, education, and the standard of living. The dimensions mirror the HDI. Why is this? Now, as then, data form the binding constraint. The construction of the HDI was driven to a great extent by the cross-country data available in 1990, as well as the need to generate a simple compelling policy message. It included three dimensions and four indicators. The Human Poverty Index (HPI) released in 1997 maintained the same three dimensions, but defined the indicators differently. Both the HDI and the HPI have been criticized for not including additional dimensions, such as those identified as human rights or within the MDGs. We very much wished the MPI to include additional vital dimensions. Unfortunately, we can state categorically that comparable data of sufficient quality are not available from the same survey in the public domain for 100+ less developed countries to consider any other dimensions, nor to include consumption data.15 However there are several arguments in favor of the chosen dimensions. First, parsimony: having only three dimensions simplifies comparisons with income poverty measures. Second, consensus: while there could be some disagreement about the appropriateness of including work, empowerment, or physical safety in a poverty measure, the value of health, education, and basic standard of living variables is widely recognized. Third, interpretability: there are substantial literatures and fields of expertise on each of these topics, which will make analysis of the MPI easier. Fourth, data: while some data are poor, the validity, strengths, and limitations of various indicators are well documented; such documentation is not as developed in domains such as empowerment. Fifth, inclusivity: human development appreciates both the intrinsic and the instrumental value of these dimensions. These same dimensions are emphasized in human capital approaches that seek to
13 Sen 2004b. 14 Alkire 2008.
clarify how each dimension is instrumental to income growth. In sum, there are good reasons for releasing the first version of the MPI with these three dimensions.
At the same time, because data are a binding constraint, a key priority for future work on multidimensional poverty must be gathering more and better data around core areas such as informal work, empowerment, safety from violence, and human relationships (social capital and respect versus humiliation) (Alkire 2007). This will enable empirical explorations of whether such dimensions add value to a multidimensional poverty measure. There is also growing interest in understanding potential contributions
from data on subjective and psychological well-being.
2.3
Choice of Indicators and
Unit of Analysis
The MPI has ten indicators: two each for health and education, and six for living standard. Ideally, the MPI would have used the person as a unit of analysis, which is possible to do with the AF measurement methodology. Such an analysis would have
enabled us to compare across gender and age groups, and to document intra-household inequalities. The reason we were not able to do this is that the data required for such comparisons across 100+ developing countries are not available. For example, the DHS gathers nutritional information for children younger than five years and for women in reproductive age; MICS collects nutritional information for children only whereas WHS focuses on adults only. The only indicators for which individual level data are available for all household
members are years of education and the living
standard variables which naturally apply to all household members. Therefore the MPI uses the household as a unit of analysis. This means that the indicators differ systematically from traditional indicators constructed from the same data, and these differences are explained below. The ten indicators (displayed in Figure 2) are almost the only set of indicators that could have been used to compare around 100 countries.16 In fact, one of the main lessons of this first exercise of estimating multidimensional poverty for developing countries is the urgent need to start collecting information on key internationally comparable indicators at the individual level (Alkire and Eli, 2010).
Within the education dimension we use two indicators that complement each other: whether someone in the household has fiveyears of education and whether all children of school age are
16For a detailed survey of the academic literature on each indicator please see Alkire and Eli (2010). Note that as an empirical exploration of different indicators and cutoffs, we constructed eight trial measures and presented these in mid-December to UNDP HDRO staff and statistical advisors, together with a draft background paper, and one set of indicators was selected. In March 2010, we presented four additional trial measures for 47 countries, and in April, an additional five measures for 108 countries. The March and April measures had the same three dimensions; the cutoffs and the precise indicators were varied.
attending school.Years of schooling acts as a proxy for the level of knowledge and understanding of household members. While years of schooling is an imperfect proxy, not capturing the quality of education nor the level of knowledge attained, nor skills, it is a robust indicator, widely available, and provides the closest feasible approximation to levels of education for household members. It can be conceived as a relatively good proxy of functionings that require education: literacy, numeracy, and understanding of information. Because the unit of analysis is the household, all household members are considered non-deprived if at least one person has five years of schooling. This variable follows the idea of effective literacy of Basu and Foster (1998) that all household members benefit from the abilities of a literate person in the household, regardless of each person’s actual level of education. It is also linked to the idea of external capabilities (Foster and Handy, 2008).
Similarly all household members are considered deprived if any of their school-age children are not attending grades 1 to 8 of school. Once again, school attendance does not capture completion, quality of schooling, or skills. But it is the best indicator possible to indicate whether or not school-aged children are being exposed to a learning environment. Given the data restrictions, we consider it to be a sufficiently good proxy of educational functionings. The intuition of considering all household members deprived if one or more children are not attending school relates to external effects. When a child is not in school, the household’s current and future knowledge and abilities are reduced. Note that households with no school-aged children are considered non-deprived. Hence incidence of deprivation in this indicator will reflect the demographic structure of the household and country as well as the educational attainments. Empirical studies suggest that this indicator provides different and complementary information to mean years of schooling (Santos et al, 2010). Furthermore, this indicator will be immediately sensitive to policy changes, whereas mean years of schooling will change more slowly. Moreover the indicator of children attending school is justified by a number of distinct sources that have attained a high degree of consensus: the MDGs include achieving universal primary education; ‘echoing’ the MDGs, UNESCO’s Education For All 2010 report specifically analyzes possible solutions for making sure that no children are excluded from schooling; and the Unsatisfied Basic Needs approach typically includes this indicator.
Health was the most difficult dimension to measure. Comparable indicators of health for all household members are generally missing from household surveys. Yet the capability to live a long and healthy life is a basic capability and is also the prerequisite for much of human development. We use two health indicators that, although related, depart significantly from standard health indicators. The first identifies a person as deprived in nutrition if anyone in their household is malnourished. Malnutrition is a direct indicator of functionings. For children, malnutrition can have life-long effects in terms of cognitive and physical development. Adults or children who are malnourished are also susceptible to other health disorders; they are less able to learn and to concentrate and may not perform as well at work.
This being said, malnutrition indicators (BMI for adults, weight for age for children) are imperfect; they do not reflect micronutrient deficiencies. Also, we do not consider the problem of obesity. Moreover, some people may appear to be technically malnourished who are not (due to body type) or their nutritional status may be not be due to poverty (it may be due to alimentary disorders or fashion norms or a recent illness for example).
We wish to emphasise one key feature of our indicators on nutrition that might confuse the reader and which relates to the special construction of our measure. In the MPI all household members are considered to be deprived in nutrition if at least one undernourished person is observed in the
household.17 Therefore, it is fundamental to note that when we present deprivation rates by indicator (censored headcounts), these estimates depart from the standard nutritional statistics. The standard measures refer to the percentage of undernourished population (number of malnourished people divided by total set people under consideration, such as percentage of underweight children). In our measure they refer to those identified as multidimensionally poor and who live in a household where at least one member is undernourished (both the numerator and the denominator of our indicators are different). Our estimate can be either higher or lower than the standard nutritional indicator because a) it counts as deprived people who are not undernourished themselves but in a household where somebody else is; b) it depends on the distribution of malnutrition in the population and the size of the households with malnourishment;18 and c) we consider as non-deprived people in households where no one was measured.19 Once again, note that although considering the household as the unit of analysis is not ideal, it is intuitive: the household experiences an external negative effect by the presence of a malnourished person.
The second indicator uses data on child mortality. The death of a child is a total health functioning failure – one that is direct and tragic, and that influences the entire household. Most, although not all, child deaths are preventable, being caused by infectious disease or diarrhea; child malnutrition also contributes to child death.
This indicator is particularly problematic. It is a stock indicator, because the year of death of the child is not recorded in most surveys – so the death could have happened many years ago. However given the absence of health functioning information on household members, it provides at least rudimentary information on health functionings.
In the MPI all household members are considered to be deprived if there has been at least one observed child death (of any age) in the household.20 It is fundamental to note that this indicator differs from the standard mortality statistics. The standard under-five mortality rate is the number of deaths of children 0-5 years per 1000 children born alive. Here, it is the percentage of people
17 Unfortunately the exact definition of the deprived in nutrition varies depending on the survey used: when we use
DHS, it refers to child or women in reproductive age being undernourished; when we use MICS, the household is considered deprived if there is at least one undernourished child (this survey does not provide information on adults’ nutrition); when we use the WHS, the household is considered deprived when the respondent (either men or women, any age) is undernourished (this survey does not provide information on children’s nutrition).There are two country-specific surveys used, in Argentina, and Mexico. In Argentina the indicator coincides with that used with DHS. In the Mexican survey all household members were measured, so the household is deprived if there is any undernourished member.
18 If the malnourished are concentrated in a few households and the size of these households is not excessively large, our
estimates will tend to be lower than the standard measure. On the other hand, if the malnourished are distributed one-per household (as it could happen with a very unequal distribution of food resources within the household), our estimates will tend to be higher than the standard measure.
19 Given that the information on nutrition was limited in each survey to a particular group, we have had to follow this
assumption. Otherwise we would have had to drop all households where no-one was measured, which would have implied a significant loss of information and representativeness in the other indicators.
20 The ‘eligible’ population for the mortality questionnaire varies slightly from one survey to the other, but on the basis
of our analysis we think that – although not ideal – the comparison across the surveys is not unreasonable. In DHS, the mortality data are obtained from women 15-49 and – in most countries – it is also obtained from men aged 15-59. In MICS it is obtained from all women 15-49 who are currently married or were married at some point. In WHS it is obtained from the respondent, when this is a woman between 18 and 52 years of age. In WHS we have also used a small part of the information provided by the questionnaire on sibling’s death, which is obtained from all respondents. This is explained in the Data section.
identified as poor and who live in a household where at least a child died. Our estimate can be either higher or lower than the mortality rate because a) it counts as deprived all people in households with a child death and not the actual children that died (both the numerator and the denominator are different); b) it depends on the distribution of child mortality in the population and the size of the households with child mortality;21 c) we consider as non-deprived households where no one was interviewed on mortality.22 Once again, note that although considering the household as the unit of analysis is not ideal, it does have some intuitive meaning, because the household experiences an external negative effect by the death of a child.
The MPI considers and weights standard of living indicators individually. It would also be very important and feasible to combine the data instead into other comparable asset indices and explore different weighting structures. The present measure uses six indicators which, in combination, arguably represent acute poverty. It includes three standard MDG indicators that are related to health, as well as to standard of living, and particularly affect women: clean drinking water, improved sanitation, and the use of clean cooking fuel. The justification for these indicators is adequately presented in the MDG literature. It also includes two non-MDG indicators: electricity and flooring material. Both of these provide some rudimentary indication of the quality of housing for the household. The final indicator covers the ownership of some consumer goods, each of which has a literature surrounding them: radio, television, telephone, bicycle, motorbike, car, truck and refrigerator. We are aware that all the living standard indicators are means rather than ends; they are not direct measures of funtionings. Yet, they have two strengths. In the first place, unlike income, which can serve an incredibly wide range of purposes (and one never knows whether it is used effectively to accomplish the needs considered to be basic), these are means very closely connected to the end (functioning) they are supposed to facilitate. Access to safe drinking water serves directly to satisfy the need of hydration and hygiene (hygiene is also facilitated by the access to improved sanitation and flooring material). Clean cooking fuel prevents respiratory diseases, which are a leading cause of preventable death, and contributes to a healthy home environment. Electricity is fundamental to pursue a number of activities. It allows lighting, which in turn allows people to be independent during the night time. Power also enables a wide range of work and leisure activities ranging from refrigeration to drilling to blending, sewing, and so forth. Electricity is also usually a safer means of lighting. And the set of considered assets are directly linked to the ability to communicate with other people, to be mobile, and even to have access to safe food. Secondly, most of the indicators are related to the MDGs, which provides stronger grounds for their inclusion in our index.
Of the ten indicators, all but one are relatively sensitive to policy change and measure ‘flow’, which means they will reflect changes in-country with as little as one year between surveys. The exception to this is the stock indicator of child mortality. More direct measures of household health functioning were simply not available. Other relatively stable indicators are years of schooling – which will be stable for many households who have no one in full-time education.
21 If mortality is concentrated in a few households and the size of these households is not excessively large, our estimates
will tend to be lower than the standard measure. On the other hand if mortality is distributed one-per household, our estimates will tend to be higher than the standard measure. For specific examples, please see the section on results.
22 As explained by describing the eligible population for the mortality questionnaire in each survey (see footnote 22),
many households in each survey were not asked the mortality questionnaire, and they are considered non-deprived in this indicator. If we had restricted the information only to households were the mortality questionnaire was asked, we would have missed significant information in the other indicators.
As we said before, it would have been ideal to estimate the measure at the individual level. Measures created using individual level data have significant strengths: for example, they can be decomposed to compare poverty between men and women, and between different age groups. However, working at the household level (a forced choice given the availability of data23) is not all counter-intuitive. It allows for interaction, smoothing, and mutual sharing within the household regarding the different indicators considered. We are aware that household size may affect results: large households are more likely to be deprived in child school attendance, nutrition, and mortality simply because they have more people who are ‘eligible’ to report these deprivations. For better or worse, this may be less of a problem in practice than in theory, particularly for health deprivations, as data are rarely available for all household members. However large households are less likely to be deprived in years of schooling. In subsequent versions of this paper, we will present decompositions and correlations of poverty and household size to explore vigorously any potential biases.
To capture the poverty differences between social and regional groups in Bolivia, Kenya, and India, we have decomposed the MPI by state and by ethnic group (see Appendix 3 on Decomposition). We find that large differences do emerge, so groups are clearly a key variable to consider in analyzing the causes of and responses to multidimensional poverty. The MPI allows these group differences to be seen and studied in detail, in order to design effective policies.24
2.4 Cutoffs for each Indicator
We have chosen cutoffs for each indicator that are based to a large extent on international standards such as the Millennium Development Goals. Where no standard was possible, we consulted the literature and also implemented multiple cutoffs to explore the sensitivity of the overall ranking to them.
The indicators and cutoffs are summarized in the figure below.
Figure 3: Dimensions, indicators, cutoffs and weights of the MPI
Dimension Indicator Deprived if… Related to… Relative Weight Education Years of Schooling No household member has completed five years of schooling MDG2 Child School 16.7%
Attendance Any school-aged child is not attending school in years 1 to 8 MDG2 16.7%
Health Mortality Nutrition Any child has died in the familyAny adult or child for whom there is nutritional information MDG4 16.7%
is malnourished* MDG1 16.7%
Standard of Living
Electricity The household has no electricity 5.6%
Sanitation The household´s sanitation facility is not improved
(according to the MDG guidelines), or it is improved but shared with other households
MDG7 5.6%
Water The household does not have access to clean drinking water
(according to the MDG guidelines) or clean water is more than 30 minutes walking from home.
MDG7
MDG7 5.6%
Floor The household has dirt, sand or dung floor 5.6%
Cooking Fuel The household cooks with dung, wood or charcoal. MDG7 5.6%
Assets The household does not own more than one of: radio, TV,
telephone, bike, motorbike or refrigerator, and does not own
a car or truck.
MDG7 5.6%
Note: MDG1 is Eradicate Extreme Poverty and Hunger, MDG2 is Achieve Universal Primary Education, MDG4 is Reduce Child Mortality, MDG7 is Ensure Environmental Sustainability.
* Adults are considered malnourished if their BMI is below 18.5. Children are considered malnourished if their z-score of weight-for-age is below minus two standard deviations from the median of the reference population.
23 Note that to compute the poverty measure at the individual level, we would have needed nutritional information of
every household member (and not just children/women/respondent – depending on the survey used). Analogously, we would have needed information on whether each adult experienced the death of a child.
2.5
Indicator
Weights
Weights can be applied in three ways in multidimensional poverty measures: i) between dimensions (the relative weight of health and education), ii) within dimensions (if more than one indicator is used), and iii) among people in the distribution, for example to give greater priority to the most disadvantaged.
It is important to note that the choice of dimensions, of cutoffs, and of weights between dimensions is interconnected. For example, dimensions might be chosen such that they were of relatively equal weight. This, indeed, is the recommendation given by Atkinson et al (2002) in their work on social indicators in Europe: “the interpretation of the set of indicators is greatly eased where the individual components have degrees of importance that, while not necessarily exactly equal, are not grossly different.”25 At the same time, in the MPI the standard of living has a higher effective weight because the deprivation headcounts tend to be higher than they are in health or education, so although the explicit weights are equal, in practice standard of living is weighted more highly.
In the capability approach, because capabilities are of intrinsic value, the relative weights on different capabilities or dimensions that are used in society-wide measures are value judgments. Weights can represent
1) the enduring importance of a capability relative to other capabilities or 2) the priority of expanding one capability relative to others in the next phase.
Weights may be set by a number of processes, such as participatory processes or expert opinion that are informed by public debate. Alternatively, weights may be drawn from survey questions such as socially perceived necessities or interpreted using data on subjective evaluations.26 The important feature to consider is that the weights are meant to represent a ‘reasoned consensus’ of the relevant community.
It is thus crucial to ask in any evaluative exercise of this kind how the weights are to be selected. This judgmental exercise can be resolved only through reasoned evaluation. …[I]n arriving at an agreed range for social evaluations (e.g., in social studies of poverty), there has to be some kind of a reasoned consensus on weights or at least on a range of weights. This is a social exercise and requires public discussion and a democratic understanding and acceptance (Sen 1996: 397).
Empirically, the relative weights are influenced by the cutoffs, the normalization (if any) of the variable, and the explicit weights. The MPI explicitly weights each dimension equally and each indicator within the dimension equally. Equal weighting between the dimensions follows the HDI convention, upon which a critical literature has developed (e.g., Chowdhury and Squire 2006), yet largely substantiated this weighting structure. Equal weights for indicators within dimensions are not necessary– for example HDI places a 2/3 weight on adult literacy and 1/3 on Gross School attendance Ratio. In the case of health indicators, it seems that malnutrition and mortality are both important deprivations and it is not clear which is the more important indicator. In the case of
25 Atkinson, Cantillon, Marlier, Nolan and Vandenbroucke 2002, p 25.
26 Papers from a May 2008 workshop on setting weights in the capability approach are available as working papers on www.ophi.org.uk. For example Decanq and Lugo sketch the landscape of statistical and normative approaches to weighting; Fleurbaey and Schokkaert propose the use of subjective weights; Wright discusses the use of socially perceived questionnaires; and Dibben et al. discuss discrete choice experiments.
education, it could be argued that having one person with five or more years of schooling was the most important outcome; yet child school attendance is a time-sensitive input with long future returns, hence again we have weighted them equally. Weighting the six asset indicators equally is admittedly more difficult to justify and is also particularly important given that this is the dimension that contributes most to poverty in the poorest countries. Further research on the best comparable asset measures that can be constructed from multiple datasets would be useful in the future.27
2.6 Poverty cutoff
k
The MPI reflects the number of deprivations a poor household experiences at the same time. But what qualifies a household as being multidimensionally poor? One could consider a household as poor if it were deprived in any of the ten indicators. Yet one deprivation may not represent poverty. For example, a household containing a slim fashion model or a grandfather who wants to cook only on a woodstove would have one MPI deprivation but perhaps should not be considered poor. At the other end of the extreme, one could require a household to be deprived in all ten indicators in order to be considered poor. This, however, seems overly demanding; surely a household that has many but not all of these basic deprivations should be considered poor. The MPI requires a household to be deprived in a few indicators at the same time. Concretely, we report two values of the MPI.
The variable k reflects the sum of weighted indicators in which a household must be deprived in order to be considered multidimensionally poor. Simply put, k is a policy variable that governs the range of simultaneous deprivations each poor household necessarily must have. As k goes up, the number of households who will be considered poor goes down, but the intensity or breadth of deprivations in any poor household goes up.
We report two values for k: k = 3 and k = 2. When k = 3, a person has to be deprived in at least the equivalent of 30 percent of the weighted indicators (two to six indicators) in order to be considered multidimensionally poor. This amounts to six asset indicators or two health or education indicators. If we choose instead cutoff value k = 2 then all poor people must be deprived in at least 20 percent of the weighted indicators (two to four indicators).
A person is multidimensionally poor if the weighted indicators in which he or she is deprived sum up to 30 percent.
Example: There are 10 indicators. Weight of Health = 3.33; Education = 3.33; and Standard of Living = 3.33 Any person whose deprived indicators’ weights sum to 3 or more is considered poor. Health and Education: 1.67 each (1/6 of 10)
Standard of Living: 0.55 each (1/18 of 10)
Poor if deprived in: * any 2 health/education indicators or * all 6 standard of living indicators or
* 1 health/education indicator plus 3 standard of living indicators.
Consider Tabitha and her household, living in a Nairobi slum.28
27 Ferguson et al. 2003
Figure 4: Diagram of dimensions and indictors of the MPI
The diagram above shows the five indicators in which Tabitha is deprived. The height of the indicators corresponds to their weight. To identify whether Tabithais poor, we sum up the weighted indicators and see if they come up to the equivalent of 30 percent of indicators. In the right column, we
see that indeed Tabitha is deprived in over 30 percent of indicators and is thus multidimensionally poor. Consider some other examples:29
Ana is deprived in nutrition and child school attendance. Is Ana multidimensionally poor? 1.67 + 1.67 = 3.34 (> 3) Yes
Ali is deprived in electricity, water, sanitation, and has a dirt floor. Is Ali multidimensionally poor?
0.55+0.55+0.55+0.55= 2.20 (<3) No
Win is deprived in years schooling, sanitation, assets, and cooking fuel. Is Win multidimensionally poor? 1.67 + 0.55 + 0.55 + 0.55 = 3.33 (>3) Yes
We now turn to the data sources description and then to the results of the MPI.
3. Data & Results
3.1 Surveys used
Three main datasets were used to compute the MPI: the Demographic and Health Survey (DHS hereafter), the Multiple Indicators Cluster Survey (MICS hereafter), and the World Health Survey (WHS hereafter). Ideally we would have liked to use the same dataset for all countries, but this was not possible as none of the mentioned surveys (or others) were performed in a sufficiently high number of developing countries at a relatively recent point in time. However, the three surveys used have two primary advantages. In the first place, the countries implementing each of these surveys follow standardized guidelines and receive technical assistance, in terms of the questionnaire, sampling procedure, and training of the enumerators, so that within each survey there is greater homogeneity and comparability than between other national multi-topic household surveys. Second,
29 The particular weights on indicators vary for countries which do not have data on all of the ten indicators; this will
they are the only currently available surveys that contain relevant information on health indicators such as nutrition and mortality in an internationally comparable way.30
A second problem is that although we would have liked to estimate poverty for exactly the same year in all countries to enable a strict cross-country comparison, this was not possible given that the different surveys have been performed in different years in each country. We followed a combined criterion of using (a) the most recent available dataset for each country (never before the year 2000) and (b) whenever more than one survey dataset was available from the year 2000 onwards, we privileged DHS over MICS, and MICS over WHS, because of data quality and indicator availability.31 The MEASURE DHS project started in 1984 and is funded mainly by the US Agency for International Development (USAID) and has conducted surveys in 84 countries. Over the years, the questionnaires have had some changes in some variables and that is why there are different DHS Phases, Phase 1 (surveys carried out between 1984 and 1989) through Phase 6 (surveys between 2008 and 2013). We used DHS datasets for 49 developing countries. All the DHS datasets used in this study correspond to Phase 4 or higher.32 This favors cross-country comparability in the indicators used for this study. Moreover, all the questions used to construct the ten indicators that compose the MPI were homogenized one-by-one, so as to have the same recoding of categories.33 The MICS is financially and technically supported by the United Nations Children´s Fund (UNICEF) and it is implemented in each country in collaboration with some government office such as the Statistical Institutes or the Ministry of Health.34 The program started in the mid-1990s. Up to present, there have been three rounds of MICS: MICS 1 conducted in 1995 in about 65 countries, MICS 2 was conducted in 2000 in about 65 countries, and MICS 3 was conducted in 2005-06 in 50 countries. For this study we used MICS 2 or MICS 3 datasets for 35 developing countries.35 As with DHS datasets, all the questions used to construct the ten indicators that compose the MPI were homogenized for each country individually, so as to have the same recoding of categories.
30 See Alkire and Eli (2010) for a discussion on bottlenecks of availability of internationally comparable indicators. 31 For example, for Cameroon, Cote d´Ivoire, Guyana, and Malawi, the DHS datasets of either 2004 or 2005 are
available, as well as the 2006 MICS dataset. We used the DHS datasets. There are a few exceptions to the mentioned rule. One is Nicaragua. For this country, we had DHS 2001 and 2006. Although we estimated the MPI for both years, we decided to use the estimates in 2001 (despite being older) because the dataset in 2006 lacks information on mortality. We indicate the difference in the estimates in the section of Results. The second exception is Angola. Although we prefer DHS data over MICS, in the case of Angola we used MICS because DHS does not contain information on nutrition and education for all household members (only for women and children). Third, although we prefer MICS data over WHS data, for Chad we used WHS because the MICS dataset had a very high percentage of households with missing data which produced an unacceptable sample size reduction.
32 We use DHS 2008 (Phase 6) for three countries. We also use DHS 2007 for ten countries, DHS 2006 for nine
countries, DHS 2005 for twelve countries, DHS 2004 and DHS 2003 for six countries each; all the aforementioned correspond to Phase 5. Finally, we use DHS 2002, DHS 2001, and DHS 2000 for one country each, which correspond to Phase 4.
33 For example, when there were differences in country datasets, the type of toilet question was recoded to match a
general standard coding. The same was done with type of drinking water source, cooking fuel, etc.
34 It is common that other international and national agencies contribute to financing the implementation of DHS or
MICS in each country. One example is the United Kingdom Department for International Development (DFID).
35 We used MICS 2 for seven countries (six conducted the survey in 2000 and one in 2001) and MICS 3 for the other 28