Procedia Computer Science 95 ( 2016 ) 237 – 244
1877-0509 © 2016 The Authors. Published by Elsevier B.V. This is an open access article under the CC BY-NC-ND license (http://creativecommons.org/licenses/by-nc-nd/4.0/).
Peer-review under responsibility of scientific committee of Missouri University of Science and Technology doi: 10.1016/j.procs.2016.09.321
ScienceDirect
Complex Adaptive Systems, Publication 6
Cihan H. Dagli, Editor in Chief
Conference Organized by Missouri University of Science and Technology
2016 - Los Angeles, CA
A New Multilevel Input Layer Artificial Neural Network for
Predicting Flight Delays at JFK Airport
Sina Khanmohammadi
a,*, Salih Tutun
a,c, Yunus Kucuk
b,caDepartment of Systems Science and Industrial Engineering, State University of New York at Binghamton, New York, 13850, USA bDepartment of Computer Science, State University of New York at Binghamton, New York, 13850, USA
c
Defense Sciences Institute, Turkish Military Academy, Ankara, 06420, Turkey
Abstract
One of the biggest problems for major airline is predicting flight delay. Airlines try to reduce delays to gain the loyalty of their customers. Hence, a prediction model that airliners can use to forecast possible delays is of significant importance. In this regards, artificial neural network (ANN) techniques can be beneficial for this application. One of the main challenges of using ANNs is handling nominal variables. 1-of-N encoding is widely used to deal with this problem, however, this method is known to reduce the performance of ANN’s by introducing multicollinearity. In this paper, we introduce a new type of multilevel input layer ANN that can handle nominal variables and is interpretable in a sense that one can easily see the relationships between different input variables and output variables. As a case study, the proposed method was applied to predict the delay of incoming flights at JFK airport, where the neurons of each sublayer of the input layer symbolize the delay sources at different levels of the system, and the activation of each neuron represents the possibility of being the source of overall delay. Finally, we compared the proposed approach with the traditional gradient descent back propagation ANN model and the proposed model was able to outperform the traditional backpropagation method in terms of the prediction error (root mean squared error) and time required to train the ANN model.
© 2016 The Authors. Published by Elsevier B.V.
Peer-review under responsibility of scientific committee of Missouri University of Science and Technology. Keywords:Artificial Neural Networks; Defect of Modules Prediction; Systems Modeling; Flight Delay; Scheduling
* Corresponding author.
E-mail address: [email protected]
© 2016 The Authors. Published by Elsevier B.V. This is an open access article under the CC BY-NC-ND license (http://creativecommons.org/licenses/by-nc-nd/4.0/).
1. Introduction
Air transportation has become one of the fundamental methods of transport [1-3]. One of the biggest problems for major airline is predicting flight delay. Nearly 30% of the jet operator flights for US airlines were delayed in 2000, and almost 3.5% of these flights were cancelled [2]. Airlines try to reduce the delays in order to gain the loyalty of their customers. However, reducing delay time is not always possible; hence, a prediction model which airliners can use to inform their clients about possible delays is important. Another application of delay prediction is the Air Traffic Management systems (ATM). Each year many new flights are introduced to the air traffic system. However, few airports are built to cope with this increasing traffic. Hence, the increase in demand for empty runways is much higher than the growth of the capacity. Therefore, to optimize the performance of current airports, predicting the probable delay of a given flight can be very useful as the unused airspace and airport capacity can be assigned to a different flight [4, 5].
Several models have been developed to solve this problem based on probability, statistics, and operations research [4-7]. For example, Dou Long and his colleagues developed an air traffic management system based on the Queuing Network Model for two National Aeronautics and Space Administration (NASA) programs [4], and James V. Hansen has analyzed genetic search algorithms to solve certain complexities associated with air traffic control [6]. However, considering the nature of this problem using the artificial neural network (ANN) techniques can be beneficial as artificial neural networks are very practical in solving nonlinear problems. Also, due to their supervised learning capability they can easily adapt to the dynamics of air traffic capacity and demand [12].
One of the main challenges of using artificial neural networks is handling nominal variables. Converting nominal variables to numeric variables introduces order to the variable which is not desired. Hence, one of the main methods used to deal with nominal variables in artificial neural networks is 1-of-N encoding. However this method deters the performance of ANN models by introducing multicollinearity that could potentially lead to ill-conditioning. Furthermore, this method increases the complexity of input datasets, which makes it more difficult to interpret the resulted neural network model that already suffers from lack of interpretability due to being a black box model. In this paper, we introduce a new type of multilevel input layer ANN that can handle nominal variables and is interpretable in a sense that one can easily see the relationships between different input variables and output variables. As a case study, the proposed method was applied to predict the delay of incoming flights at JFK airport, where the neurons of each sublayer of the input layer symbolize the delay sources at different levels of the system, and the activation of each neuron represents the possibility of being the source of overall delay. The neurons of each input sublayer are connected to the neurons of the terminal layer, where the neurons of the terminal layer represent different types of delays.
The rest of the paper is organized as follows. In Section 2, the new proposed approach called Multi-Level Input Layer Neural Networks is explained in detail. Section 3 shows how the proposed method can be applied to transportation problems. In Section 4, the results of applying the proposed method to a sample dataset from JFK airport is provided followed by its comparison with traditional gradient descent based back propagations approach. Finally, the paper is concluded in Section 5.
2. Multi-Level Input Layer Neural Network
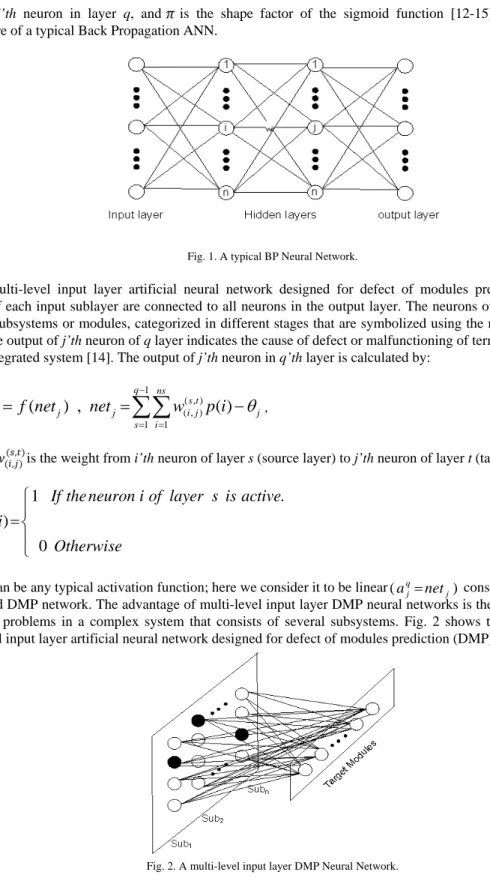
Artificial neural networks comprise a combination of neurons each capable of certain functions, and this gives neural networks their outstanding parallel computation capabilities [7, 12-15]. In traditional feed-forward networks such as Back Propagation, the output of j’th neuron in q’th layer is calculated by
( 1) 1
1
(
) ,
1
j n q q j ij i j j net inet
w a
a
e
WT
u¦
, (1)where netj is the net value of neuron j, is the output of neuron i in layer (q-1), is the weight of i’th neuron from the layer (q-1) (source layer) to j’th neuron of layer q(target layer), is the threshold value, is the output
value of j’th neuron in layer q, and is the shape factor of the sigmoid function [12-15]. Fig. 1 shows the architecture of a typical Back Propagation ANN.
Fig. 1. A typical BP Neural Network.
In a multi-level input layer artificial neural network designed for defect of modules prediction (DMP), the neurons of each input sublayer are connected to all neurons in the output layer. The neurons of the DMP represent different subsystems or modules, categorized in different stages that are symbolized using the network’s input sub-layers. The output of j’th neuron of q layer indicates the cause of defect or malfunctioning of terminal modules of the overall integrated system [14]. The output of j’th neuron in q’th layer is calculated by:
1 ( , ) ( , ) 1 1
(
) ,
( )
q ns q s t j j j i j j s ia
f net
net
w
p i
T
¦¦
, (2)where is the weight from i’thneuron of layer s (source layer) to j’th neuron of layer t (target layer), and
1
.
( )
0
If the neuron i of layer s is active
p i
Otherwise
°
®
°
¯
(3)f
(.) can be any typical activation function; here we consider it to be linear( q j)j net
a considering the nature of the applied DMP network. The advantage of multi-level input layer DMP neural networks is their ability to identify faults and problems in a complex system that consists of several subsystems. Fig. 2 shows the architecture of a multi-level input layer artificial neural network designed for defect of modules prediction (DMP).
3. Modelling Transportation Problems using DMP-ANN
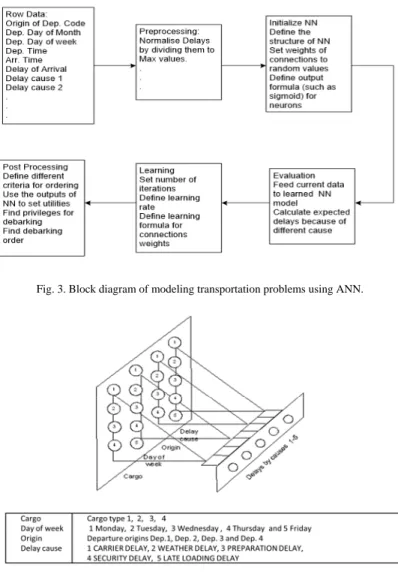
For real world applications such as transportation problems, the input of artificial neural networks need to be preprocessed, and the output needs to be post-processed in order to obtain useful information from the model. Fig. 3 shows a block diagram of an ANN model for a transportation problem. In certain problems such as the transportation problem, we have some nominal variables that could not be easily processed in the traditional ANN models. For example, we cannot say that the 25th day of the month is more significant than the 3rd day. In these cases, binary neurons (active 1 or inactive 0) may be useful [15]. In the problems that include nominal variables, the proposed multi-level input layer DMP-ANN model can be very helpful. Day of month 1 to 31, day of week 1 to 7, five digit ID code of origin airport, scheduled departure time from origin airport, actual departure time from origin airport, delay at departure from origin airport, scheduled arrival time to destination airport (JFK), actual arrival time to destination airport (JFK) as inputs and delay at arrival in destination airport (JFK) as output are used to predict flight delay in the airport. Fig. 4 represents the structure of the DMB-ANN model for a flight-delay prediction problem.
Fig. 3. Block diagram of modeling transportation problems using ANN.
Now, suppose that after the learning process is complete the weights of connections in Fig.4 are: W1: 0.8147 0.9058 0.1270 0.9134 0.6324 0.0975 0.2785 0.5469 0.9575 0.9649 0.1576 0.9706 0.9572 0.4854 0.8003 0.1419 0.4218 0.9157 0.7922 0.9595 W2: 0.6557 0.0357 0.8491 0.9340 0.6787 0.7577 0.7431 0.3922 0.6555 0.1712 0.7060 0.0318 0.2769 0.0462 0.0971 0.8235 0.6948 0.3171 0.9502 0.0344 0.4387 0.3816 0.7655 0.7952 0.1869 W3: 0.4898 0.4456 0.6463 0.7094 0.7547 0.2760 0.6797 0.6551 0.1626 0.1190 0.4984 0.9597 0.3404 0.5853 0.2238 0.7513 0.2551 0.5060 0.6991 0.8909 W4: 0.9593 0.5472 0.1386 0.1493 0.2575 0.8407 0.2543 0.8143 0.2435 0.9293 0.3500 0.1966 0.2511 0.6160 0.4733 0.3517 0.8308 0.5853 0.5497 0.9172 0.2858 0.7572 0.7537 0.3804 0.5678
Where wi (see in Table 2) represents the connection weights from sublayer i of input layer to neurons of the target layer. Now suppose that on Wednesday four cargos arrive at thedestination. Table 1 represents the sample data for these cargos.
Table 1. Cargos from different sources.
Cargo No Type Sch. Arr. Origin Delay Causes
1 2 15:30 1 2,4,5
2 1 18:20 3 2,4
3 3 10:45 4 1,3
4 3 12:18 2 1,3,4
The model of the input layer of these cargos is represented in Table 2 where each column in each cargo type represents the four input sub-layers of the proposed ANN model (Cargo Type, Day of the week, Origin and Delay Cause).
Table 2.Input neurons for different input layers.
Cargos Cargo 1 Cargo 2 Cargo 3 Cargo 4
Input sub layer 1 0 0 1 0 1 0 0 0 0 0 0 1 0 0 0 1 Input sub layer 2 1 0 0 1 0 0 0 1 0 0 0 0 0 0 1 0 Input sub layer 3 0 1 0 0 0 1 1 0 0 1 0 1 1 1 0 1 Input sub layer 4 0 0 0 1 0 0 0 1 1 0 1 0 0 0 0 1 Input sub layer 5 0 0 0 1 0 0 0 0 0 0 0 0 0 0 0 0
The estimated possible delays are predicted by DMB-ANN model as shown in Table 3.
Table 3. Predicted delays considering initial random weights of connections.
Cargos Delay Cause 1 Delay Cause 2 Delay Cause 3 Delay Cause 4 Delay Cause 5 Total Delay
Cargo 1 2.7716 2.5982 3.6234 2.8867 4.2310 16.1109
Cargo 2 3.2115 2.9825 2.1438 2.3381 2.7998 13.4757
Cargo 3 2.9085 1.4525 2.0883 2.3028 2.6783 11.4304
Cargo 4 2.8006 3.2568 2.8642 2.0092 2.6644 13.5952
Note that even if there is no delay of Type 1 in the testing set, there is a predicted possible delay of Cause 1 in the results. This is because of interrelations between different causes denoted by weights of connections that are learned from the training set. The priority of cargoes by a first in first out (FIFO) strategy based on scheduled arrival times in
Table 1 will be 3>4>1>2.
.However, if we take into account the five estimated delays as criteria with weights equal to [-0.7590 0.0540 0.5308 0.7792 0.9340 0.1299], the priority will be 1>4>3>2 based on the following multi-criteria decision-making analysis:
0.759 0.8455 0.8630 0.7978 1.0000 1.0000 1.0000 0.0540 1.0000 1.0000 0.9158 0.5917 0.8099 0.6617 0.5308 0.5864 0.9056 0.4460 0.5763 0.7977 0.6330 0.7792 0.6709 0.8721 1.0000 0.7905 0.6960 0.6297 0.9340 0.1299 dv ª « ª º « » « »u « » « » ¬ ¼ ¬ 1.6715 1.0846 1.1170 1.4165 º » ª º « » « » « » « » « » « » « » « » « » ¬ ¼ « » « »¼ (4) 4. Results
The inbound flights of JFK airport in January 2012 are considered as our case study. The small size of the dataset is for easier interpretation and representation of the results. The flight info is retrieved from The Bureau of Transportation Statistics (BTS) [16]. There were 1099 flights from 53 airports to JFK in January 2012. The following variables were used to train the proposed ANN model.
1: Day of month 1 to 31 2: Day of week 1 to 7
3: Five digit ID code of origin airport
4: Scheduled departure time from origin airport 5: Actual departure time from origin airport 6: Delay at departure from origin airport
7: Scheduled arrival time at destination airport (JFK) 8: Actual arrivaltime at destination airport (JFK) 9: Delay of arrival at destination airport (JFK) 10: Reason 1 for arrival delay - CARRIER DELAY 11: Reason 2 for arrival delay - WEATHER DELAY 12: Reason 3 for arrival delay - NAS DELAY 13: Reason 4 for arrival delay - SECURITY DELAY 14: Reason 5 for arrival delay - LATE AIRCRAFT DELAY
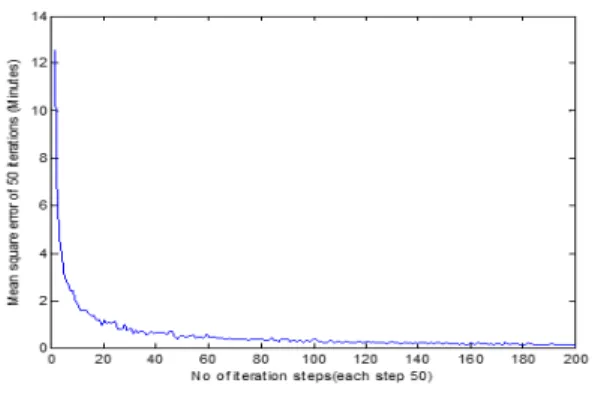
These data are normalized using the following procedure: Variable 3 (ID code of origin airport) is converted to a value between 1 and 53 (the total number of origin airports in the data set). Variables 10-14 (Delay times) are normalized by dividing them by the maximum value of each variable. For example, for Delay Type 1 (CARRIER DELAY), each item of data is normalized by dividing it to 546 (the maximum number of CARRIER DELAY). Finally, the DMP-ANN model is trained for 10000 epochs. Fig. 5 shows the convergence of the DMB-ANN model (i.e. the mean squared error versus the number of epochs).
Fig. 5. Mean square errors of actual and predicted errors by DMP-ANN model for 10000 iterations.
After the network had been trained, the model was used for predicting the delays at time 18:30 on Day 21 of January. Five flights were presented for landing with scheduled arrival times from 18:15 to 18:45. The estimated possible normalized values of delays of these flights based on the previously mentioned five cases are presented in Table 4 where dif represents the difference between scheduled arrival time and current time 18:30.
Table 4. Flights with estimated possible delays. Flights Origin No. Origin value Sch. Arr. Dif. (minutes)
Delay 1 Delay 2 Delay 3 Delay 4 Delay 5
Flight 1 2 0.8284 18:30 0 0.1201 0.1536 0.1659 0.1568 0.1811
Flight 2 14 0.5962 18:30 0 0.0844 0.0830 0.0856 0.0768 0.0944
Flight 3 4 0.7822 18:00 0 0.0911 0.0844 0.1027 0.0848 0.0919
Flight 4 2 0.8284 18:40 10 0.1201 0.1536 0.1659 0.1568 0.1811
Flight 5 6 0.5572 18:32 2 0.0540 0.0486 0.0512 0.0436 0.0663
The landing priority (ordering of landing) of flights based on scheduled arrival times is 3>1>2>5>4. Considering origin values (weighting of departure airport), Dif, and Delays 1 to 5 as different criteria with typical weightings (it depending on airport management strategies) [0.3990 -0.2839 0.3139 0.7183 0.0878 0.9446 0.2795], the new priority (4>1>3>2>5) is calculated as follows:
1.0000 0.0000 1.0000 1.0000 1.0000 1.0000 1.0000 0.7197 0.0000 0.7028 0.5400 0.5158 0.4895 0.5211 0.9442 0.0000 0.7589 0.5497 0.6188 0.5406 0.5075 1.0000 1.0000 1.0000 1.0000 1.0000 1.0000 1.0000 0.6726 0.20000 0.4494 0.3165 0.27 dv 0.3990 0.2839 1.9451 0.3193 0.9972 0.7183 1.0302 0.0878 2.2290 80 0.2780 0.3659 0.9446 0.5748 0.2795 ª º « » ª º « » ª º « » « » « » « » « » « » « »u« » « » « » « » « » « » « » « » « » « » ¬ ¼ « » ¬ ¼ « » ¬ ¼ (5)
Table 5. Comparison of the proposed approach and gradient descent backpropagation with RMSE error, memory usage and run time.
ANN Approaches / Evaluation Metrics
RMSE Prediction Error: Memory Usage (MegaBytes): Run Time (Secs):
DMP (the proposed approach) 0.1366 0.8699 2.7121
According to the comparison between the approaches, as seen in Table 5, the DMP approach predicts with less Root Mean Square Error (RMSE) error, and has a better run time than the gradient descent backpropagation approach. Hence, the proposed approach predicts the delay of incoming flights at JFK airport better results in short time.
5. Conclusions
A new ANN structure (DMP-ANN) is introduced which is suitable for prediction of defects such as delays in operations. This structure is appropriate for problems with nominal variables, where traditional ANN models have difficulties. For example, the types of cargo or ID number of origin of departure are variables that cannot be directly used in a traditional ANN. The input layer in proposed DMP-ANN consists of several sublayers in which one or more neurons are active (output=1) and others where they are inactive (output=0). Hence, the learning process involves updating the weights of active neurons. The introduced ANN model is applied to a system of airport traffic control where the arriving flights are prioritized for landing based on the expected possible delays. The results suggest that the proposed method can be effective for specific problems that include many nominal variables, such as the transportation problem. One of the limitations of this study that needs to be addressed in our future work is the complexity of the proposed method (as the number of variables increases the number of connections also significantly increase). Furthermore, we will consider the integration of the proposed method with fuzzy logic to expand the real-world applications of the proposed method.
References
1. Nolan, Michael S. Fundamentals of air traffic control. Delmar Pub, 2010.
2. Monma, C. L., and M. Stoer. Handbook in operations research and management science, 1993.
3. Richetta, Octavio, and Amedeo R. Odoni. "Dynamic solution to the ground-holding problem in air traffic control." Transportation Research Part A: Policy and Practice 28, no. 3 (1994): 167-185.
4. Long, Dou, David Lee, Jesse Johnson, Eric Gaier, and Peter Kostiuk. Modeling air traffic management technologies with a queuing network model of the national airspace system. No. NAS 1.26: 208988, National Aeronautics and Space Administration, Langley Research Center, 1999.
5. Shorrock, Steven T., and Barry Kirwan. "Development and application of a human error identification tool for air traffic control." Applied Ergonomics 33, no. 4 (2002): 319-336.
6. Hansen, James V. "Genetic search methods in air traffic control." Computers & Operations Research 31, no. 3 (2004): 445-459.
7. Bertsimas, Dimitris, Guglielmo Lulli, and Amedeo Odoni. "An integer optimization approach to large-scale air traffic flow management." Operations research 59, no. 1 (2011): 211-227.
8. Ariyawansa, Chamath Malinda, and Achala Chathuranga Aponso. Review on state of art data mining and machine learning techniques for intelligent Airport systems. In 2nd International Conference on Information Management (ICIM); IEEE 2016. p.134-138.
9. RaJ Bandyopadhyay and Rafael Guerrero. Predicting airline delays. http://cs229. stanford. edu/proj2012/BandyopadhyayGuerrero-PredictingFlightDelays. pdf (2012).
10. Juan Jose Rebollo, and Hamsa Balakrishnan. Characterization and prediction of air traffic delays. Transportation research part C: Emerging technologies 2014; 44: 231-241.
11. Nikolas Pyrgiotis, Kerry M. Malone, and Amedeo Odoni. Modelling delay propagation within an airport network. Transportation Research Part C: Emerging Technologies 2013; 27: 60-75.
12. Fausett, Laurene V. Fundamentals of neural networks: architectures, algorithms, and applications. Englewood Cliffs, NJ: Prentice-Hall, 1994. 13. Zhang, Ming, ed. Artificial Higher Order Neural Networks for Modeling and Simulation. Information Science Reference, 2012.
14. Chrisina Jayne, Shigang Yue, Lazaros S. Iliadis, Engineering Applications of Neural Networks, 13th International Conference, Eann 2012, London, UK, September 20-23, 2012.
15. Nobuo Funabiki, Binary Neural Network Approaches to Combinatorial Optimization Problems in Communication Networks, in Soft Computing in communications, Springer, 2004
16. Bureau of Transformation Statistics, http://www.transtats.bts.gov/DL_SelectFields.asp?Table_ID=236&DB_Short_Name=On-Time rticle. J SciCommun2000; 163:51-9.