University of Arkansas, Fayetteville
ScholarWorks@UARK
Theses and Dissertations
8-2014
Incentives and Firm Behaviors
Thu Hien Thi NguyenUniversity of Arkansas, Fayetteville
Follow this and additional works at:http://scholarworks.uark.edu/etd Part of theFinance and Financial Management Commons
This Dissertation is brought to you for free and open access by ScholarWorks@UARK. It has been accepted for inclusion in Theses and Dissertations by an authorized administrator of ScholarWorks@UARK. For more information, please [email protected], [email protected].
Recommended Citation
Nguyen, Thu Hien Thi, "Incentives and Firm Behaviors" (2014).Theses and Dissertations. 2237.
Incentives and Firm Behaviors
A dissertation submitted in partial fulfillment of the requirements for the degree of Doctor of Philosophy in Business Administration
by
Thu Hien Nguyen
Hochiminh City University of Technology Bachelor of Engineering in Electrical Engineering, 2004
Boston University
Master of Science in Information Systems, 2008 Boston University
Master of Business Administration, 2008
August 2014 University of Arkansas
This dissertation is approved for recommendation to the Graduate Council.
Dr. Craig Rennie Dissertation Director
Dr. Wayne Lee
ABSTRACT
My research interests focus on the economic behavior, choices, and actions of
organizations as well as individuals given their incentives, and analyze the consequences of such decisions to the financial health of firms and the macro economy. A firm is incentivized by the value investors place on its operations; while employees, particularly the management team, is incentivized by the private benefits the firm gives them. Understanding the impact of such incentives will help alleviate the classic agency costs in modern organizations.
Stock illiquidity raises the cost of share ownership to outside investors. The sizable adverse price impact of trading increases transactions costs and stock volatility. The reduced gains from informed trading discourages the acquisition of private information and impedes the price discovery process. The first essay substantiates that shares of financially constrained firms are significantly more illiquid than shares of similar but financially unconstrained firms. Acting as buyers of last resort for their own shares, share repurchases by financially constrained firms enhance stock liquidity, which alleviates the cost of external financing and underinvestment. Increased stock liquidity improves information efficiency, inducing higher value-added from incremental capital investments. Further, higher stock liquidity lowers stock volatility and allows financially constrained firms to issue equity.
In the second and third essays, I investigate whether the incentives given to the employees and the management team at banks contribute to the financial crisis. I provide evidence that CEO compensation is weakly related to bank risk measures and risky bank activities. However, when looking at banks with regards to their reward cultures, I find that during the 2008 crisis period, banks either at the high or low reward culture groups perform worse, and are more risky than banks in the average reward culture group. The reward culture
score represents the common factor in incentives across all levels of the bank, from CEO, Vice Presidents to all other employees. The findings are consistent with the problems of adverse selection and moral hazard associated with incentive misalignment when incentives are too low or too high. This shows the importance of reward culture in understanding the role of
ACKNOWLEDGEMENTS
I would like to thank all who supported me to complete this dissertation for their valuable encouragement and dedication during my study in the Ph.D. program.
I would like to express my deepest appreciation to my committee chair, Dr. Craig Rennie, who, having been working with me since I first started the program, always supported and
guided me throughout the whole process. I would like to thank my committee member, Dr. Wayne Lee, who motivated and inspired me with various research projects. In addition, I would like to thank my other committee member, Dr. Timothy Yeager, whose role was very important in my journey during the program. His constructive suggestions and comments provided much improvement in my works. I am very grateful to have such a dedicated dissertation committee. Without their help and guidance, this dissertation would not have been possible.
In addition, a thank you to Dr. Pu Liu, Finance Department chair, for his support and reliability. I am lucky to be a part of the department.
Moreover, I would like to thank all the Finance professors and my Ph.D. fellows for their amount of support. Their kindness and friendship helped me go through every step of the
program.
Last but not least, I own much gratitude to my family and friends, who encouraged me and were always there when I needed them the most. I am grateful for my husband, Huy-Nhiem Nguyen, whose willingness to take over household chores helped me tremendously during the final stage of the program. I am thankful for my daughter, Tu-Yen Nguyen, who provided me much needed distraction in my down time. A thank you to my parents, Truong-Hai Nguyen and Thanh-Minh Dinh, for their valuable life lessons and unconditional love.
DEDICATION
TABLE OF CONTENTS
I. INTRODUCTION 1
II. STOCK MARKET LIQUIDITY: FINANCIALLY CONSTRAINED FIRMS AND SHARE
REPURCHASE 4
A. Introduction 5
B. Testable Hypotheses 15
C. Data and Methodology 16
1. Sample Design 16
2. Measuring Stock Market Liquidity 17
3. Measuring Financial Constraint 18
4. Measuring Share Repurchase 21
5. Control Variables and Descriptive Statistics 23
D. The Impact of Share Repurchase on Financial Constraint 24
1. Univariate Analysis 24
2. Cross-sectional Regression Analyses 26
E. The Impact of Share Repurchase on Market Liquidity 28 F. The Impact of Market Liquidity on Corporate Decisions and Market Perception 31
1. External Financing 33
2. Internal Investment 35
3. Value Added from Market Perception 36
4. Risk 38 G. Conclusions 40 H. References 42 I. Appendix 49 J. Figures 50 K. Tables 52
III. BANK CEO COMPENSATION INCENTIVES AND RISK: EVIDENCE FROM
RECENT CREDIT CRISIS 65
A. Introduction 66
B. Literature Review and Testable Hypotheses 71
1. CEO Compensation Incentives, Policy, and Risk 71
2. Bank CEO Compensation, Policy, and Risk 73
3. Testable Hypotheses 76
C. Sample Selection, Variables, Methodology, and Summary Statistics 78
1. Sample Selection 78
2. Variable Definitions 79
3. Methodology 81
1. Sample Description 83
2. CEO Incentives and Investment and Debt Policy 86
3. CEO Incentives and Simultaneous Determination of Investment and Debt Policy 87
4. CEO Incentives and Bank Risk 90
5. CEO Incentives and Simultaneous Determination of Bank Policies and Risk 91
E. Robustness Tests 92
1. Common Factor Analysis Applied to Bank Risk Measures 92 2. Bank CEO Incentives, Bank Investment and Debt Policy, and Bank Risk 94
F. Discussion and Conclusion 95
G. References 97
H. Figures 100
I. Tables 109
IV. REWARD CULTURE IN BANKS AND THE FINANCIAL CRISIS 123
A. Introduction 124
B. Literature Review 128
1. Incentive Misalignment 128
2. Reward Culture 130
C. Sample Selection and Methodology 132
1. Sample Selection 132
2. Reward Culture Factor 135
D. Bank Return and Risk 137
1. Univariate Analysis of Bank Return and Bank Risk 137
2. Multivariate Analysis of Bank Return 138
3. Multivariate Analysis of Bank Risk 140
E. Conclusion 141
F. References 143
G. Figures 146
H. Tables 151
LIST OF FIGURES
Figure 1.1 – Stock market liquidity, share repurchase and equity issuance over time 50
Figure 1.2 – Stock liquidity and repurchase intensity on financial constraint status 51
Figure 2.1 – Bank Executive Compensation over Time 100
Figure 2.2A – Bank and Industrial Executive Compensation over Time 101
Figure 2.2B – Bank and Industrial Executive Compensation over Time 102
Figure 2.2C – Bank and Industrial Executive Compensation over Time 103
Figure 2.3 – Executive Compensation for Banks and Matched Industrial Firms 104
Figure 2.4 – Distribution of CEO Incentives 105
Figure 2.5 – Bank Policy Measures over Time 106
Figure 2.6 – Bank Risk Measures over Time 107
Figure 2.7 – Bank Risk Factors over Time 108
Figure 3.1 – Bank CEO Incentives 146
Figure 3.2 – Bank VP Pay Gap 147
Figure 3.3 – Compensation per Employee 148
Figure 3.4 – Bank Returns 149
LIST OF TABLES
Table 1.1 – Firm distribution 52
Table 1.2 – Financial constraint and firm characteristics 53
Table 1.3 – Financial constraint and corporate payouts 54
Table 1.4 – Predicting Firms’ “Financial Constrained” Status in 1992 55
Table 1.5 – Predicting Firms’ “Financial Constrained” Status in 2006 56
Table 1.6 – Illiquidity and Repurchase Intensity 57
Table 1.7 – Illiquidity and External Financing 59
Table 1.8 – Illiquidity and Investments 61
Table 1.9 – Illiquidity and Value Added 62
Table 1.10 – Illiquidity and Risk 63
Table 2.1 – Descriptive Statistics of Banks and Matched Industrial Firms 109
Table 2.2 – CEO Incentives and Bank Investment and Debt Policy 111
Table 2.3 – CEO Incentives and Investment and Debt Policy Simultaneously 113
Table 2.4 – CEO Incentives and Bank Risk 115
Table 2.5 – CEO Incentives and Investment, Debt Policy and Firm Risk 117
Table 2.6 – Common Factor Analysis of Bank Risk 119
Table 2.7 – CEO Incentives and Bank Risk Factor 121
Table 3.1 – Correlation Matrix 151
Table 3.2 – Summary Statistics 153
Table 3.3 – Factor Analysis of CEO Incentives 155
Table 3.4 – Factor Analysis of Reward Culture 156
Table 3.5 – Reward Culture Factor Score 157
Table 3.6 – List of Banks by Reward Culture Factor 159
Table 3.7 – Bank Returns and Reward Culture Groups 161
Table 3.8 – Bank Returns and Reward Culture 163
Table 3.9 – Bank Risk and Reward Culture Groups 164
1
I. Introduction
There is an intensive market microstructure literature focused on stock liquidity. This literature notes two different costs associated with stock illiquidity: adverse selection costs arising from information asymmetry and transactions costs associated with holding inventory. Investors require additional compensation for holding less liquid stocks, either in terms of greater stock returns or risks. Increased stock liquidity that reduces the adverse selection and transaction costs to shareholders reduces the firm’s cost of capital. By increasing the marginal value of private information, stock liquidity motivates market participants to engage in private information production. The reduction in information asymmetry contributes to stock price efficiency. If managers wish to maximize firm value, they should pursue financial policies that improve the liquidity of their stock.
In the first essay, I investigate whether firms attempt to enhance their stock liquidity via share repurchase programs, and the implications of this activity on other firm behavior. This is done in the context of firms that face costly external financing and have illiquid stocks and hence, would be expected to value stock liquidity more than other firms. Specifically, I draw upon the existing literature on financial frictions to identify a set of firms that have a higher cost of capital and less stock liquidity: financially constrained firms. I show how financially
constrained firms with illiquid stocks utilize share repurchases to improve their liquidity, helping them issue additional equity, increasing investments, increasing value added from market
perception per incremental investments, and reducing idiosyncratic risk.
The 2008 financial crisis raised questions about performance-based compensation practices at financial institutions. The public widely believed that excesses in compensation prevalent among banks were a catalyst to the crisis. Since then, academic research has studied
2
the link between compensation practices and risk-taking behaviors extensively, mostly focusing on CEO and the top management team compensation. Their findings are inconclusive. One branch of the literature finds that banks with better shareholder-aligned CEO compensation plans did worse in the crisis, generating significantly lower stock returns and returns on equity.
Moreover, CEOs of better shareholder-aligned banks realized larger losses in their stock and option portfolios. But as other branches of the literature point out, the losses that CEOs suffered in the crisis were disproportionately less than the high compensation CEOs received prior to the crisis. There has been evidence about a positive relationship between a CEO’s stock and option grants and bank risk.
In the second and third essays of this dissertation, I study whether incentives at banks are a contributing factor to the recent credit crisis. The second paper shows that bank CEO
compensation incentives to increase risk, and to increase risk relative to increase stock price, lead to comparatively risky investment and debt policies and increased risk. It shows that the relation between bank CEO compensation risk taking incentives tends to change between non-crisis vs. crisis periods. Bank CEO risk taking incentives lead CEOs to adopt riskier investments,
including asset growth, loans to core deposits, and commercial real estate loans, to implement riskier debt policy by increasing leverage, and to increase bank risk, where bank risk is measured by the volatility of stock returns, non-performing loans to assets, and a bank risk factor score. I conclude that recent efforts by the press, politicians, and regulators, to portray bank CEO compensation incentives as the cause of excessive risk taking and financial collapse are
premature. In the third paper, I construct and examine whether the “reward culture” of banks was a contributing factor to the 2008 credit crisis. Reward culture reflects three dimensions: (i) CEO incentives – total CEO compensation and the incentive effects of CEO stock and option
3
portfolios; (ii) tournament incentives – pay gap in total compensation between CEOs and Vice Presidents; and (iii) employee incentives – total compensation per employee. A reward culture factor score, constructed by applying factor analysis to the CEO, VP, and employee incentives, represents the common factor in incentives across all levels of the bank. I employ the reward culture factor to examine the impact of reward culture on bank performance and risk. First, I find strong evidence of a nonlinear relationship between reward culture and bank returns and risk. Second, classifying banks into high, average, and low reward culture groups in the pre-crisis year 2006, I find that during the 2008 crisis period, banks either at the high or low reward culture groups performed worse, and were more risky than banks in the average reward culture group. The findings are consistent with the problems of adverse selection and moral hazard associated with incentive misalignment when incentives are too low or too high.
4
II. Stock Market Liquidity: Financially Constrained Firms and Share Repurchase Abstract: Stock illiquidity raises the cost of share ownership to outside investors. The sizable
adverse price impact of trading increases transactions costs and stock volatility. The reduced gains from informed trading discourages the acquisition of private information and impedes the price discovery process. This study substantiates that shares of financially constrained firms are significantly more illiquid than shares of similar but financially unconstrained firms. Acting as buyers of last resort for their own shares, share repurchases by financially constrained firms enhance stock liquidity, which alleviates the cost of external financing and underinvestment. Increased stock liquidity improves information efficiency, inducing higher value-added from incremental capital investments. Further, higher stock liquidity lowers stock volatility and allows financially constrained firms to issue equity.
5
A. Introduction
There is an extensive market microstructure literature focused on stock liquidity (see Vayanos and Wang, 2012, for a survey). This literature notes two different costs associated with stock illiquidity: adverse selection costs arising from information asymmetry, and transactions costs associated with holding inventory. Investors require additional compensation for holding less liquid stocks, either in terms of greater stock returns or risks1. Increased stock liquidity that
reduces the adverse selection and transaction costs to shareholders reduces the firm’s cost of capital2. By increasing the marginal value of private information, stock liquidity motivates
market participants to engage in private information production3. The reduction in information
asymmetry contributes to stock price efficiency. If managers wish to maximize firm value, they should pursue financial policies that improve the liquidity of their stock4. During market
downturns, firms can, for instance, utilize share repurchase programs to help increase depth on the sell-side of the market to improve liquidity5. The presence of the firm as a buyer gives
confidence to other market participants and reduces the number of sellers in the market.
Repurchase firms can be thought of as buyers of last resort – supporting their market-makers and
1 Brennan and Subramanyam (1996), Datar et al. (1998), Brennan et al. (1998), and Brennan et
al. (2012) document a positive relationship between average stock returns and liquidity costs. Amihud (2002), Pastor and Stambaugh (2003) and Acharya and Pedersen (2005) argue that illiquidity is a priced risk factor.
2 Amihud and Mendelson (1986), Barclay and Smith (1988), and Acharya and Pedersen (2005)
provide theoretical models that predict a positive relationship between the cost of capital and the bid-ask spread. Empirical work by Brennan and Subrahmanyam (1996), Easley et al. (2002), Amihud (2002), Pastor and Stambaugh (2003), Bekaert et al. (2007), Hasbrouck (2009), Duarte and Young (2009), and Lee (2011) provides support for this prediction.
3 Kyle and Vila (1991), Holmstrom and Tirole (1993), and Maug (1998), to name a few.
4 Amihud and Mendelson (2012) argue that corporate managers should adopt liquidity-increasing
corporate financial policies, including lower leverage ratios, the substitutions of dividends for stock repurchases, more effective disclosure, and increases in investor base.
5 Grullon and Ikenberry (2000) find evidence that repurchases provide liquidity support in a
6
adding downside liquidity. In this paper, I investigate whether firms attempt to enhance their stock liquidity via share repurchase programs, and the implications of this activity on other firm behavior. This is done in the context of firms that face costly external financing and have illiquid stocks and hence, would be expected to value stock liquidity more than other firm.
Specifically, I draw upon the existing literature on financial frictions to identify a set of firms that have a higher cost of capital and less stock liquidity: financially constrained firms. Financial constraints arise due to frictions in the supply of capital, the chief source of friction being information asymmetries between investors and the firm (Tirole, 2006). Supply frictions increase costs of raising external capital, and, in the limit, the firm is shut out of the capital markets6. Since market liquidity captures information asymmetry among market participants,
such firms are more likely to have less liquid stocks (Ascioglu et al., 2008). Researchers hypothesize that these constraints may have substantial effects on a variety of decisions, including firms’ investment and capital structure choices7. Campello et al. (2010) use the 2007
credit crisis as a natural experiment to survey CFOs about the impact of financial constraints on corporate policies. They find financially constrained firms plan to cut more investment,
technology, marketing, and employment relative to financially unconstrained firms during the crisis. Financial constraints also restrict firms’ pursuits of attractive projects, or force them to cancel valuable investments.
I hypothesize that financially constrained firms, facing costly external financing and
6 As Almeida and Campello (2002) put it, “constrained firms are at the point where the supply of
capital becomes inelastic”.
7 See, for example, Fazzari et al. (1988), Whited (1992), Froot et al. (1993), Kaplan and Zingales
(1997), Gomes (2001), Almeida et al. (2004), Whited and Wu (2006), Rauh (2006), Almeida and Campello (2007), Hennessy and Whited (2007), Duchin et al. (2010), and Li (2011), among many others.
7
potential underinvestment, take steps to improve their stock liquidity to reduce information asymmetry and alleviate costs of financial constraint. The more illiquid a firm’s stock is ex-ante, the more valuable the enhanced liquidity is ex-post. Liquidity enhancements for such firms are also likely to have greater value than for other firms. As a corollary, if these firms do raise external financing, it is more likely to be equity financing because of a lower cost of equity. They overcome the underinvestment problem with additional financing. Furthermore, since improved liquidity increases price efficiency, the market will place higher value on their incremental investments. Concurrently, reduced liquidity costs could also result in reduced risk for these firms.
The corporate policy of choice in this paper is share repurchase. The existing literature argues that share repurchase programs can both improve and deteriorate stock liquidity. On the one hand, open market repurchase programs should be detrimental to market dynamics because the firm’s presence in the market increases the fraction of “informed” traders, which in turn gives rise to an adverse selection cost in the form of reduced stock liquidity8. On the other hand, share
repurchases may actually improve stock liquidity by increasing depth on the sell-side of the market. Here firms repurchase shares as a form of disbursing cash to shareholders, acting as a market maker in their own stocks supplying additional liquidity9. Hillert et al. (2013) shed light
on these conflicting results by relying on newly available data on realized share repurchases by
8 Barclay and Smith (1988) for U.S. firms, Brockman and Chung (2001) for Hongkong, and
Ginglinger and Hamon (2007) for France find that repurchases reduce liquidity. Brockman et al. (2008) study the determinants of repurchases with regard to liquidity and document that firms with more liquid stocks tend to distribute more of their excess cash in the form of stock repurchases than dividends.
9 Singh et al. (1994), Wiggins (1994), Miller and McConnel (1995), Franz et al. (1995), Cook et
al. (2004) for U.S. firms, Chung et al. (2007) for Switzerland, Rasbrant and De Ridder (2013) for Sweden, and De Cesari et al. (2012) for Italy, all find a positive relationship between repurchases and liquidity.
8
U.S. firms. They find smaller repurchases consume liquidity; whereas larger repurchases provide liquidity, and liquidity provision is more likely for less liquid stocks.
Figure 1.1 plots average U.S. stock market liquidity based on Amihud’s (2002) illiquidity measure (the left axis) and the average share repurchase amount and equity issuance amount (the right axis) for all publicly traded firms on the CRSP and Compustat databases from 1989 to 2011. This Figure shows U.S. stock markets became more liquid until 2007, then reached a high point in illiquidity during the financial crisis in 2009. At the same time, the repurchase amount increases substantially until 2007, then decreases dramatically to a low in 2009, and increases thereafter. Equity issuance amount follows a generally similar pattern to that of repurchase amount. There is a positive association between stock market liquidity and each of share repurchase and equity issuance amounts.
Insert Figure 1.1 here.
My research design has three parts. First, I confirm the relationship between financially constraint and illiquidity documented in the literature, and explore the impact of share repurchase on the constraint status. Second, I investigate the relationship between share repurchase and stock liquidity in a sample of financially constrained firms only, controlling for the endogeneity between the two. Finally, I study the impact of additional liquidity on different firm decisions in such firms, such as equity and debt issuance, investment, value added from incremental
investments and firm risk.
My sample consists of 183 financially constrained firms from the CRSP and Compustat data over 1992 to 2006. My study starts with 1992 to avoid contaminating effects of the savings and loan crisis that started in 1989, and ends in 2006 to avoid the effects of the credit crisis that started in 2007. Firms selected in the sample must have all data available throughout the sample
9
period in order to alleviate the confounding effects of different factors. I classify firms as
financially constrained by Hadlock and Pierce’s (2010) index (hereafter, HP index)10. I focus on
financially constrained firms because the effect of share repurchases on stock liquidity and the value of enhanced liquidity are likely greatest for financially constrained firms. My variable of chief interest in measuring repurchase activity is repurchase intensity, calculated as repurchase amount divided by the total dollar trading volume over the fiscal year. Intuitively, this variable measures repurchase dollars per trading dollar volume. The higher the value, the greater the intensity of the repurchase.
Figure 1.2 plots Amihud’s (2002) illiquidity measure against repurchase intensity for unconstrained versus constrained firms. The positive relationship between stock illiquidity and repurchase intensity appears more pronounced for constrained firms, helping motivate my focus on constrained firms in this study.
Insert Figure 1.2 here.
Using Amihud’s (2002) illiquidity measure as my primary measure of illiquidity, I first verify that financially constrained firms have less stock liquidity. In 1992, I find a one standard deviation above the mean level of illiquidity decreases the probability of a firm being financially unconstrained from 84.76% to 75.86%, an almost 9% decrease, holding all control variables constant at their mean levels. This is consistent with Ascioglu et al. (2008), who report that the more liquid a company’s stock is, the more likely that firm will be financially unconstrained. This finding suggests illiquidity is a characteristic of financial constraint.
10 Hadlock and Pierce (2010) point out the endogenous nature of common predictors in previous
literature, such as leverage and cash flow, to constraint status, and recommend that researchers rely solely on firm size and age, two relatively exogenous firm characteristics, to identify constrained firms.
10
Since being financially constrained is potentially detrimental to firm value, I hypothesize that financially constrained firms will engage in corporate policies that enhance their liquidity. In particular, these firms could repurchase shares, and the intensity of their repurchase activity could help determine the probability that they will become unconstrained, ex-post. Consistent with this, I find that of 183 constrained firms in 1992, the intensity of cumulative repurchase activity from 1992 to 2006 is a determinant of the probability that these firms will be
unconstrained in 2006. Specifically, a one standard deviation above the mean value of repurchase intensity increases the probability of being unconstrained in 2006 for constrained firms in 1992, from 7.21% to 10.1%, an increase of 2.89%, ceteris paribus.
Firms use share repurchases to improve their stock liquidity to reduce financial constraint. Since financially constrained firms are more likely to have illiquid stocks, share repurchases provide stock liquidity by increasing market depth. Knowing this, firms decide to repurchase when they observe that their stock liquidity is below some threshold. Given that firms make this decision endogenously, I identify evidence of a causal effect of share repurchases on improvements in liquidity by means of a two-stage-least-square (2SLS) model. I also correct for selection bias in decision making using Heckman’s (1979) inverse Mill’s ratio. Using this methodology, I show that the more illiquid a stock was in the prior year, the more likely the firm will repurchase its shares in the current year. This finding is inconsistent with Brockman et al. (2008), who document that higher market liquidity encourages share repurchases, but their analysis lumps financially unconstrained with constrained firms. Consistent with Hillert et al. (2013), I find that while lagged illiquidity prompts firms to repurchase shares, repurchase intensity enhances contemporaneous stock liquidity.
11
effects on a variety of corporate decisions. Specifically, improved liquidity firms are more likely to issue equity. Liquidity lowers costs of capital (Amihud and Mendelson, 1986; Pastor and Stambaugh, 2003; and Acharya and Pedersen, 2005), especially in raising equity, because flotation costs and investment banking fees are reduced (Butler et al., 2005). I test for and find evidence of this using Heckman’s inverse Mill’s ratio to control for selection bias in the decision to issue equity. Further, I find no such effect on debt issuance, suggesting improved stock
liquidity is more likely to be beneficial for equity issues than bonds, consistent with Lipson and Mortal (2009) and Bharath et al. (2009).
With improved liquidity, formerly financially constrained firms are able to issue more equity, presumably to fund investments. As a result, improved stock liquidity should be accompanied by increased investments. Higher trading volume, a proxy for liquidity, is associated with higher investment (Munoz, 2013). This relationship is greater for firms with tighter financial constraints and better investment opportunities. Stock liquidity is significantly correlated with R&D activity (Vo, 2013). I find evidence supporting this prediction.
As stock liquidity improves, information asymmetry between informed and uninformed investors decreases, and prices become more informative for managers, investors, and other stakeholders. This implies markets now value the firm’s investments more than when their stocks were less liquid. I test for this by constructing a variable called value added (per dollar of incremental investments), measuring the increase in market value of assets, adjusting for net equity issuance and debt issuance, per dollar of investments. The intuition for this variable is that as a firm chooses to invest in different projects, the market observes this and reflects its
perception of the values of such investments through stock price. When information asymmetry is reduced, the market is more informed and more likely to place higher value on those
12
investments, increasing the market value of assets. The increase in the market value of assets due to investments will be greater for firms with reduced information asymmetry. In other words, this variable captures value added from the market perception from improved transparency. Since improved liquidity reduces information asymmetry, this variable should be positively correlated with liquidity. I find evidence supporting this prediction.
Finally, improved liquidity should lead to reduced risk owing to lower liquidity costs. However, the effect of improved liquidity may differ for systematic risk and idiosyncratic risk, given that systematic risk can be hedged. Baruch et al. (2007) and Baruch and Saar (2009) argue that when stocks are more liquid, investors rely more on market-wide information, while firm-specific information is more difficult to observe, increasing systematic risk. This implies a positive correlation between systematic risk and improved liquidity. Chan et al (2013) confirm this prediction and demonstrate that this relationship is stronger for stock with higher
information asymmetry. I find evidence to confirm my prediction that enhanced liquidity reduces idiosyncratic risk but increases systematic risk.
Overall, this paper shows how financially constrained firms with illiquid stocks utilize share repurchases to improve their liquidity, helping them issue additional equity, increasing investments, increasing value added from market perception per incremental investments, and reducing idiosyncratic risk.
My paper makes several contributions to the corporate finance literature. First, I provide conclusive evidence that firms influence and improve their stock liquidity. Although it has been argued that firms can and should improve their stock liquidity (Amihud and Mendelson, 2012), evidence on this has so far been sparse. As a result, stock liquidity is often regarded as
13
to improve it, especially when achieving and maintaining higher stock liquidity is crucial for them. In this respect, my findings are closely related to those reported by Daas et al. (2012) that concludes managers actively influence the liquidity of their companies’ shares. Daas et al. (2012) show innovative firms – those primarily holding intangible assets and relying on external
financing – have higher liquidity and take a variety of actions (e.g., frequent earnings guidance, stock splits, seasoned equity offerings, etc.) to maintain stock liquidity. My findings are also consistent with those of Balakrishnan et al. (2013), who show managers provide more earnings guidance after the loss of public information producers (analysts) following brokerage-firm closures.
Second, my results materially contribute to the literature on repurchases and liquidity by proving share repurchases improve liquidity, thereby providing a possible explanation why previous research appears inconclusive. I show that the liquidity enhancement effect of share repurchases is most pronounced for financially constrained firms, i.e., firms that value liquidity most. By not separating financially constrained from unconstrained firms, previous studies appear to have missed the effect of stock repurchases on liquidity. My results are consistent with Hillert et al. (2013), who find firms supply liquidity to the market when they repurchase a large number of shares, particularly in illiquid markets. However, my analysis builds on Hillert et al. (2013)’s by employing a 2SLS model to control for endogeneity compared to their lagged illiquidity in an OLS regression that does not control for selection bias. Also, they do not study the impact of improved liquidity on firm behavior, but instead focus on the market
microstructure features of share repurchase. My results are inconsistent with Brockman et al. (2008), who find that market liquidity drives the repurchase decision. I find that a lack of stock liquidity drives the repurchase decision.
14
Third, my study identifies benefits of improving liquidity through its effect on corporate decisions. My paper builds on literature linking stock liquidity and external financing (Lesmond et al., 2008; Lipson and Mortal, 2009; Butler et al., 2005), stock liquidity and investment
(Becker-Blease and Paul, 2006; Li, 2011; Vo, 2013), stock liquidity and price efficiency
(Grossman and Stiglitz, 1980; Holmstrom and Tirole, 1993; Chordia et al., 2005; Chordia et al., 2008), and stock liquidity and firm risk (Pastor and Stambaugh, 2003; Acharya and Pedersen, 2005; Chan et al., 2013) by showing that these benefits are especially valuable to financially constrained firms.
Finally, my study complements the literature on payout decisions in financially
constrained firms. Chen and Wang (2012) find that share repurchases by constrained firms lead to reduced cash and cash flow, and increased leverage, reducing investment. These firms also experience significantly weaker abnormal returns and operating performance post-repurchase. Why then do financially constrained firms engage in share repurchases when repurchases do not enhance shareholder wealth? Chen and Wang (2012) propose managerial overconfidence as a possible reason. Managers of these firms tend to overestimate their firms’ future investments and returns. I add to this discussion by proving another explanation, i.e., managers of financially constrained firms repurchase shares to improve share liquidity. To my knowledge, my paper is the first to link liquidity to share repurchase among financially constrained firms.
The rest of the paper proceeds as follows. Section B develops my empirical predictions. Section C describes my data collection procedure and details the construction of my main variables. Section D investigates the relation between repurchase intensity and financial constraint status. Section E examines the relation between repurchase intensity and liquidity. Section F examines the effect of liquidity on firms’ behaviors. Section G concludes.
15
B. Testable Hypotheses
Drawing upon the arguments made in the literature, I hypothesize that firms take actions that influence their stock liquidity. To test this, I focus on a set of firms that are expected to most value stock liquidity. Specifically, I argue that financially constrained firms face costly external financing and have illiquid stocks due to high levels of information asymmetry. Since share repurchases provide liquidity for less liquid stocks, firms that repurchase more shares are less likely to remain constrained. This leads me to my first testable hypothesis, stated in alternate form:
Hypothesis 1 (H1): Ex-ante financial constrained firms that have greater share
repurchase intensity are more likely to become unconstrained ex-post.
I build on the notion that firms can influence the level of their stock liquidity. Given their higher cost of capital and underinvestment resulting from financial constraint, these firms will engage in share repurchases to improve their stock liquidity, and only do so when their stock liquidity is below some threshold. Specifically, my second testable hypothesis is:
Hypothesis 2 (H2): Lagged illiquidity increases the probability financially constrained
firms will do share repurchase, and consequently, the stock liquidity of firms improves.
Due to the strong preference of financially constrained firms for liquidity, I expected that the improvement in liquidity would be more valuable for these firms and would be reflected in better corporate decisions and market perceptions. Therefore, my next four testable hypotheses are:
16
Hypothesis 3 (H3): Improved liquidity increases the probability firms issue equity and
the amount of equity issuance; but such impact is weaker, or nonexistent for debt issuance.
Hypothesis 4 (H4): Improved liquidity is associated with increased firm investment. Hypothesis 5 (H5): Improved liquidity is associated with greater value added from
market perception per dollar of incremental investments.
Hypothesis 6 (H6): Improved liquidity reduces risk via reduced idiosyncratic risk, and
increases systematic risk.
C. Data and Methodology
In this section, I describe my sample selection procedure and primary variables.
1. Sample Design
My sample starts with U.S. publicly traded firms between 1992 and 2006. According to Grullon and Michaely (2000), since the mid-1980s, more and more firms have decided to initiate share repurchase programs as a way to distribute cash flows to their shareholders. I start the sample in 1992 and end in 2006 to capture popularity of share repurchases and at the same time avoid contaminating effects of the savings and loans crisis that started in 1989 and the credit crisis that began in 2007, both of which adversely affect market liquidity. To be included in my sample, firms must be in both the Center for Research in Security Prices (CRSP) and Compustat files. I exclude financials and utilities because they do not report on share repurchases and have essentially unique types of asset and capital structure, leverage, and regulatory supervision. I also require firms to have positive assets and market capitalization.
17
I collect daily stock returns, prices and trading volumes from CRSP to calculate the Amihud (2002) illiquidity measure, cumulative stock returns, and total risk. I include all ordinary common stocks (share code 10 and 11) traded on NYSE, AMEX and NASDAQ (exchange code 1, 2 and 3). Primes, closed-end funds, REITs, American Depository Receipts (ADRs) and foreign companies are excluded. I obtain firm financial characteristics from Compustat.
I require sample firms to have data available for the entire period 1992 through 2006. Because the focus of the paper is on financially constrained firms, i.e., firms that are already more likely to leave the sample, limiting my study to those that remain allows me to observe the effect of share repurchases via liquidity enhancement on their constraint status without the confounding effects of other factors. My final sample includes 1,082 firms that satisfy all
criteria. I further exclude firms that are classified as financially sufficient to avoid contamination of financially unconstrained and constrained groups. My final sample consists of 786 firms, 603 of which are unconstrained and 183 constrained in 1992. In analyses involving financial
constrained firms, I only use these 183 firms.
2. Measuring Stock Market Liquidity
Although there are numerous studies on liquidity, the stock liquidity concept itself is still evolving (Cholette et al., 2007) because it comprises several dimensions, including trading costs, turnover, bid-ask spread, and price impact. To capture stock liquidity, current finance literature generally examines liquidity in terms of the ability of investors to trade large quantities of stock quickly at low cost with little price impact (Liu, 2006; Chordia et al., 2009). Although this definition of multi-dimensional liquidity is generally accepted, a single liquidity measure may not capture all dimensions of liquidity (Cholette et al., 2007). I use Amihud’s (2002) illiquidity measure because it is widely used to measure liquidity at both the aggregate and the firm level,
18
as in Acharya and Pedersen (2005), Kamara et al. (2008), and Goyenko et al. (2009). This measure is easy to compute, and is highly correlated with other liquidity measures, such as bid-ask spread, LOT, trading volume, and price impact measures. It is defined as the average ratio of the daily absolute return to the dollar trading volume on that day. This ratio gives the absolute (percentage) price change per dollar of daily trading volume, or the daily price impact of the order flow.
In this paper, the Amihud’s (2002) illiquidity measure is calculated as follows
Dit s is is s i t i t i Vol P R D ILL , 1 , , , , , 1where Di,t is the number of valid observation days for stock i during fiscal year t, Ri,s is the
absolute return on day s for stock i. Pi,s and Voli,s are respectively the daily price and trading
volume of stock i on day s. I multiply the above estimate by 106 for practical purposes. This
measure is called an illiquidity measure because a high value indicates low liquidity.
I follow Amihud (2002)’s exclusion of firms with less than 200 trading days during the year t. I also require firms to have trading volume and market capitalization in year t to calculate the Amihud’s (2002) illiquidity measure. Because the impact of repurchases on liquidity may vary depending on the exchange that the stock is traded, I adjust the Amihud’s (2002) illiquidity measure by subtracting exchange illiquidity from raw Amihud’s (2002) illiquidity during the period.
3. Measuring Financial Constraint
To study the role of financial constraint on firm behavior, researchers are often in need of a measure of the severity of constraint. The literature suggests many possibilities, but is divided
19
on which measure best captures financial constraint. As a result, empirical studies tend to employ a range of measures for robustness. Judged by Google Scholar citations, the KZ index, as
suggested by Kaplan and Zingales (1997), Lamont et al. (2001), Baker et al. (2003), Chen et al. (2007), and Hennessy et al. (2007), is the most popular measure of financial constraints. Other popular measures of financial constraint are the cash-cash flow sensitivity of Almeida et al. (2004), the investment-cash flow sensitivity of Fazzari et al. (1988), the WW index of Whited and Wu (2006), and the HP index of Hadlock and Pierce (2010).
Ascioglu et al. (2008) argue that when a classification scheme for identifying constrained firms is based upon a measure correlated with net worth or internal funds, the characters of those firms, such as investment-cash flow sensitivity, are not consistent with firms with financial constraints. By collecting detailed qualitative information from financial filings to categorize financial constraints for a random sample of firms from 1995 to 2004, Hadlock and Pierce (2010) cast serious doubt on the validity of the KZ index, while offering mixed evidence on the validity of other common measures of constraint11. Concerned with the endogenous nature of common
predictors such as leverage and cash flow to constraint status, they recommend researchers rely solely on firm size and age, two relatively exogenous firm characteristics, to identify constrained firms. Therefore, in this paper, I use HP index to classify financially constrained firms. The HP index is calculated as ) 040 . 0 ( ) 043 . 0 ( ) 737 . 0
( Size Size2 Age
HP
where Size equals the log of inflation-adjusted book assets, and Age is the number of years the firm is listed with a non-missing stock price on Compustat. In calculating this index, Size is
11 Hadlock and Pierce (2010) provide evidence that “the only truly new variable from the WW
20
capped at (the log of) $4.5 billion, and Age is winsorized at 37 years. A firm with a high HP index is considered more financially constrained.
I construct the HP index for each firm in the universe of Compustat firms at the beginning of the sample period 1992, and then again at the end of the sample period 2006. To reduce the effects of a few extreme values, I Winsorize components of the HP index at the 1st
and 99th percentiles. For those two years of data, I sort all the firms in Compustat into terciles of
40th and 60th percentiles (40-20-40) according to the value of their HP indexes. Firms with the
lowest HP index values are placed in tercile one, and firms with the highest values in tercile three. I then assign my sample firms to these groups based on their HP terciles in 1992 and 2006. I consider firms in the highest HP tercile to be financially constrained, firms in the middle HP tercile to be financially sufficient and firms in the lowest HP tercile to be financially
unconstrained.
Insert Table 1.1 here.
Table 1.1, Panel A reports the frequency of firms for three groups: financially
unconstrained, financially sufficient, and financially constrained, at the beginning of the sample period 1992, and at the end in 2006. Of my original sample of 1,082 firms, 55.7% are
unconstrained in 1992, 21.1% sufficient in 1992, and 23.2% constrained in 1992. Their financial constraint status in 2006 evolves such that all unconstrained firms in 1992 remain unconstrained by 2006, while 86.0% of sufficient firms in 1992 improve to become unconstrained by 2006, while 39.4% of constrained firms in 1992 become unconstrained by 2006, and only 33.6% stay constrained. To some extent, sufficient firms behave more like financially unconstrained firms, potentially diluting the effect of the two extremes. I therefore exclude financially sufficient firms in my subsequent analyses, and report frequencies of only unconstrained vs. constrained firms in
21
Panel B. Of the 786 firms, all unconstrained firms in 1992 stay unconstrained in 2006, while 54.1% of constrained firms in 1992 move up to being unconstrained in 2006, and the remainder stays the same. The fact that there is no movement from the 1992 unconstrained group suggests share repurchases during the period do little to their status, further motivating my focus on financially constrained firms.
4. Measuring Share Repurchase
Measurement of the actual value of shares repurchased is not straightforward. The most accurate measure would be actual shares repurchased multiplied by the average price of
repurchased shares as reported in the firm’s financial statements. Unfortunately, detailed disclosure of repurchase activity has only been a requirement since 2004. Early studies rely on
Wall Street Journal announcements of share repurchases, while more recent studies identify repurchases from SDC and estimate the number of shares repurchased using either CRSP or Compustat data. Stephens and Weisbach (1998) discuss various estimates of actual repurchases using CRSP and Compustat data, and subsequent researchers have attempted to improve the accuracy of these estimates. Jagannathan et al. (2000) examine whether monthly decreases in shares outstanding from CRSP or purchases of common and preferred stock reported in Compustat more accurately reflect actual repurchases. They find that the CRSP measure understates actual repurchases, while the Compustat measure overstates them, but their final sample contains only 35 firms with both CRSP and Compustat data available and includes a number of outliers. Grullon and Michaely (2002) and Kahle (2002) adjust Compustat purchases of common and preferred stock by removing changes in the value of preferred stock to better measure purchases of common stock. More recently, Massa et al. (2007) ignore preferred stock adjustments because preferred stock activity is an insignificant portion of firms’ share repurchase
22
activity. Fama and French (2001) adjust the Stephens and Weisbach’s (1998) measure of changes in the dollar value of treasury stock to account for firms that retire treasury shares. In a hand collected sample of firms, Banyi et al. (2008) horse race various measures of share repurchases against share repurchases reported in firms’ financial statements: they find annual and quarterly Compustat purchases of common stock, after adjusting for preferred stock repurchases, are good measures of actual repurchases in the sense that the proportion of extremely inaccurate data points is low.
In this paper, I follow Grinstein and Michaely (2005) and Massa et al. (2007) to calculate repurchase activity. I use data item PRSTKC from Compustat database as a measure of
repurchase amount. Although by definition this item includes preferred as well as common stock, preferred stock repurchase activity is a minute fraction of overall repurchases. Furthermore, in some instances this item is reported as zero but there is a significant reduction in the redemption value of preferred stocks (item PSTKRV), suggesting a negative repurchase amount if I adjust for preferred stock repurchases following Grullon and Michaely (2002). Therefore, item PRSTKC best estimates common stock repurchase amount. My main variable measuring intensity of repurchase activity (RIi,t) is defined as the amount of share repurchased reported
during the fiscal year (item PRSTKC) divided by the total dollar trading volume over the same period (data from CRSP).
Dit s s i s i t i t i Vol P PRSTKC RI , 1 , , , ,where Di,t is the number of valid observation days for stock i during fiscal year t, PRSTKCi,t is
23
daily price and trading volume of stock i on day s. I multiply the above estimate by 1000 for practical purposes. This measure is a repurchase intensity measure because a high value indicates greater repurchase dollars per thousand dollar trading volume. Hillert et al. (2013) construct similar measures of repurchase intensity, but use number of shares outstanding as the denominator.
5. Control Variables and Descriptive Statistics
To examine the effect of share repurchase on liquidity and subsequent firm behavior, I follow the current literature on financial constraint to control for a set of firm and industry characteristics that may affect their behavior. Specifically, I use the component variables of the KZ index, including cash flow, cash, dividend, leverage and Tobin’s Q. Cash flow is defined as cash flow over lagged book assets, cash as cash balances over lagged book assets, dividend as cash dividends over lagged book assets, leverage as sum of long-term debt and current debt over lagged book assets, and Tobin’s Q as the ratio of the market-to-book value of the firm’s assets. I also use the component variables of the WW index for robustness, including cash flow, dividend dummy, long-term debt, sales growth and industry sales growth. Dividend dummy equals one if the firm pays cash dividends and zero otherwise, long-term debt is defined as long-term debt over lagged book assets, sales growth as the firm’s sales growth and industry sales growth as the firm’s three-digit industry sales growth. I also include stock volatility and stock returns in selected analyses. Stock volatility is defined as the annualized standard deviation of daily stock returns, and stock returns as the cumulative of daily stock returns over the fiscal year. All the variables are defined in detail in the Appendix.
24
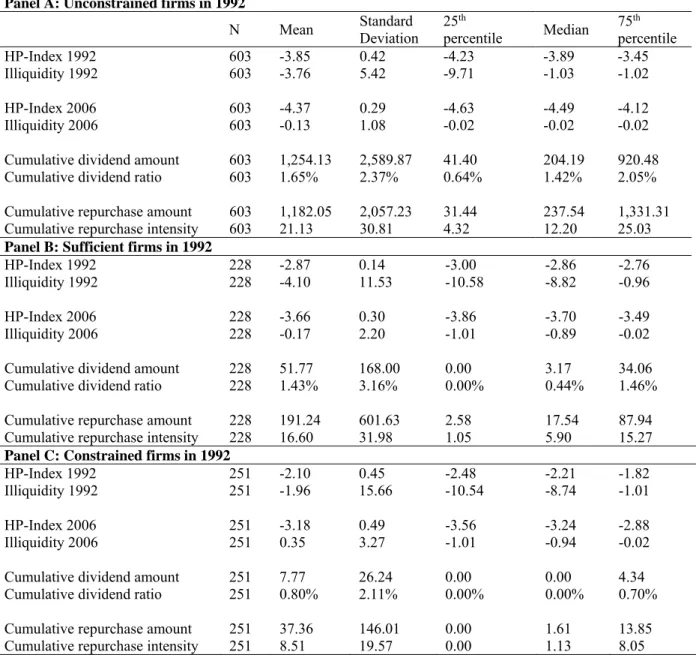
Table 1.2 provides summary statistics for firm characteristics for three groups of firms based on their constraint status: financially unconstrained, financially sufficient, and financially constrained firms, as of 1992, and as of 2006. There are significant differences among the three groups. Unconstrained firms are significantly bigger, have more income, more cash flow, less cash, higher leverage, smaller Tobin’s Q, and less investment. This is consistent with Hadlock and Pierce (2010), who suggest constrained firms choose to hold more cash and keep leverage low for precautionary reasons. In addition, the fact that constrained firms have higher Tobin’s Q, a proxy for growth opportunities, and higher investment, emphasizes the wedge between internal needs and external cost of funds at constrained firms.
D. The Impact of Share Repurchase on Financial Constraint
Hennessy and Whited (2007) suggest the financial constraint status of firms has a substantial effect on a variety of firm decisions, including investment and capital structure choices. Similarly, given their constraints, such firms choose different payout methods with varying intensity. By restricting firms with available data throughout 15 years from 1992 to 2006, I am able to observe a firm’s status coming into the period (in 1992), its payout behaviors during the period, and its status coming out of the period (in 2006). While unconstrained firms coming in and going out of the period experience no change in status, more than half of ex-ante constrained firms come out unconstrained. By controlling for other factors that can also affect constraint status, I study the effect of share repurchases on firm financial constraint status and subsequent firm behavior as hypothesized in Hypothesis 1.
1. Univariate Analysis
I start my analysis by looking at three groups of firms based on their constraint status in 1992 and their cumulative payout activity between 1992 and 2006 reported in Table 1.3.
25
Insert Table 1.3 here.
By classification, unconstrained firms have the lowest HP index, and constrained firms the highest. As a whole, each group’s HP index decreases from 1992 to 2006, reflecting
improved financial status. This is not surprising given the HP index loads primarily on size and age. As firms grow, they become less constrained. In term of illiquidity, values are negative because they are adjusted by subtracting exchange illiquidity from raw Amihud (2002) illiquidity during the same period. The more negative the value, the more liquid the stock relative to the liquidity of its exchange. In general, unconstrained firms are more liquid than constrained firms. This is consistent with Cleary et al. (2007), who suggest information asymmetry between firms and uninformed investors is a primary root cause of financial constraint, and Ascioglu et al. (2008), who confirm market liquidity captures information asymmetry between informed and uninformed investors and can thus be used to classify financial constraint.
In terms of liquidity trend, market liquidity improves from 1992 to 2006, regardless of firm group. This is consistent with Kamara et al. (2008), who observe that the substantial increase in institutional investing and index trading in in the past 50 years play a key role in increasing trading volume and liquidity in U.S. equity markets. The liquidity of financially sufficient firms more closely resembles that of unconstrained than constrained firms, consistent with the notion that financially sufficient firms behave more like unconstrained firms. This also motivates me to remove financially sufficient firms from my final sample of constrained firms.
Consistent with the free-cash-flow hypothesis of corporate payouts first proposed by Jensen (1986), financially unconstrained firms pay out much more than the other two groups, either in the form of dividends or share repurchases. These firms are more likely to have excess cash and fewer growth opportunities. Sufficient and constrained firms pay out much less, and
26
utilize more share repurchases than dividends. This is in line with Jagannathan et al. (2000) and Guay and Harford (2000), who suggest that share repurchases are used to distribute cash flows unlikely to reoccur.
2. Cross-sectional Regression Analyses
Before focusing on constrained firms, I investigate the characteristics of financial
constraints as these firms enter my sample in 1992. I limit my sample to 786 firms that are either unconstrained or constrained. I run probit regressions to assess whether the probability of being unconstrained is correlated with different characteristics of firms. The primary test variable here is firm illiquidity. I use the components of KZ index as additional explanatory variables in Column 1, and rerun the regression using WW index’s components as a robustness test in Column 2. I do not use log(Total Assets) as one of the WW index’s components because of multicolinearity given the HP index is also calculated based on total assets. The results are shown in Table 1.4. Intercepts are not reported.
Insert Table 1.4 here.
All coefficients are statistically significantly different from zero, implying the HP classification is a good measure of financial constraint. Consistent with prior literature, unconstrained firms are more liquid, have more cash flow, pay more dividends, and have less growth opportunities. Hadlock and Pierce (2010) argue constrained firms hold more cash and keep financial slack for precautionary purposes. I also find unconstrained firms have less cash and more leverage. Consistent with Ascioglu et al. (2008), the more liquid a firm’s stock, the more likely it is unconstrained. High illiquidity implies high information asymmetry between the firm and the market, increasing costs of external financing and thus constraint. This relationship is statistically and economically significant. Holding all control variables constant at their mean
27
levels, a one standard deviation above mean level of illiquidity decreases the probability of a firm being unconstrained from 84.76% to 75.86%, an almost 9% decrease in likelihood.
Of 786 firms that enter my sample period in 1992, all 603 unconstrained firms come out as still unconstrained in 2006, and there is no significant cross-sectional change in financial constraint among unconstrained firms. However, of 183 constrained firms in 1992, 99 become unconstrained by 2006, and only 84 remain constrained.
Does repurchase intensity play a role in improving the financial status of more than half of the constrained firms? I test for Hypothesis 1 by running probit regressions on the group of constrained firms in 1992 only, modelling the probability of being unconstrained in 2006. The test variables are cumulative repurchase intensity and cumulative dividend ratio. Cumulative repurchase intensity is the repurchase intensity over 15 years, from 1992 to 2006, calculated as the sum of repurchase amount over 15 years divided by the total dollar trading volume over the same period. Cumulative dividend ratio is calculated as the sum of dividends paid throughout 15 years divided by the sum of total assets in the years that dividends are paid. This variable is used to test for the dividend substitution hypothesis (Grullon and Michaely, 2002). The control variables are either all the KZ’s components (Column 1) or all the WW’s components in 2006 (Column 2). Again, I do not use log(Total Assets) for WW variables. The results are shown in Table 1.5. Intercepts are not reported.
Insert Table 1.5 here.
Similar to Table 1.4, unconstrained firms are more liquid, and have more cash flows and more leverage. The coefficient on Cash is not significant. According to Kaplan and Zingales (1997), constrained firms have less internal funding, e.g. cash, whereas Hadlock and Pierce (2010) argue that constrained firms hold more cash as a precaution. In both of my columns, the
28
coefficients on cumulative repurchase intensity are positive and significant. The higher repurchase intensity, the more likely ex-ante constrained firm become unconstrained ex-post. Repurchase intensity helps reduce financial constraint. Keeping all other control variables at their mean values, a one standard deviation above the mean value of repurchase intensity increases the probability of being unconstrained by 2006 for constrained firms in 1992 from 7.21% to 10.1%, a significant increase of 2.89% in likelihood. In contrast to the impact of repurchase intensity, the coefficients of cumulative dividend ratio are negative and statistically significant. The more dividends firms pay, the more likely they are constrained. This is
inconsistent with the dividend substitution hypothesis of share repurchase, which implies that the effect of share repurchase and dividends are analogous. However, it is consistent with Brav et al. (2005), where CFOs acknowledge rigidity of dividends; regardless of the financial status of the firms, firms have to keep paying dividends, or risk sending unfavorable signals to the market; with higher cost of capital, this deteriorates the financial status of the firm, making it more constrained.
In sum, the results here are consistent with Hypothesis 1, showing the positive impact of share repurchase on alleviating firms’ constraint status.
E. The Impact of Share Repurchase on Market Liquidity
Section D shows the impact of repurchase intensity on the financial status of a firm, in particular for ex-ante constrained firms. The higher repurchase intensity a firm has, the more likely it becomes unconstrained ex-post. Share repurchases therefore reduce financial constraint, but how? I argue that share repurchases enhance market liquidity, which lowers information asymmetry between the firms and uninformed investors, as stated in Hypothesis 2. By buying back shares, firms increase depth on the sell-side of the market. This effect should be more
29
pronounced for financially constrained firms, of which illiquid stocks benefit more from added market depth. Here, firms can be thought of as buyers of last resort – supporting their market makers and adding downside liquidity in a high information asymmetry environment. Further, the presence of a large buyer in a falling market gives confidence to market participants. Grullon and Ikenberry (2000) find evidence that stock returns of firms that actively repurchase their shares are less sensitive to market-wide movements in declining or bearish markets. In this section, I test for Hypothesis 2 for my sample of ex-ante financially constrained firms from 1992 to 2006. I require all firms to have illiquidity data available throughout the whole period, limiting to 163 constrained firms in 1992, making it 2,445 firm-year observations.
There are two issues to be considered in this analysis. First, share repurchases imply a decision made by managers. Heckman (1979) proposes a two-stage estimation procedure using the inverse Mill’s ratio to take account of selection bias. Second, there is possible endogeneity between share repurchases and market liquidity. Brockman et al. (2008) observe that market liquidity plays a significant role in repurchase initiations, as well as recurring payout decisions, while Barclay and Smith (1988) examine liquidity changes following the repurchase decision. To address these two issues, I utilize Heckman-corrected two-stage-least-square (2SLS) regressions. In the first step, I model the probability of doing share repurchases in a given year with a probit model. Firms that do share repurchases are those that have positive repurchase intensity in a given year. Then I calculate the inverse Mill’s ratio from this probit estimation and use it in the 2SLS estimation as an exogenous variable.
Table 1.6 reports the results of this approach. Intercepts are not reported. Column 1 reports the results of the probit regression. Column 2 reports the first stage of the 2SLS, and column 3 reports the second stage. The endogenous variables are repurchase intensity and
30
change in illiquidity each year. Change in illiquidity is calculated as the illiquidity of the current year minus the illiquidity of the previous year. The more liquid a stock is, the more negative the change in illiquidity becomes. The instrument variables for repurchase intensity are lagged illiquidity and lagged firm characteristics. Firm characteristics are either KZ components or WW components. The model is:
) ,
( ) 0
Pr(RepurchaseIntensityi,t f Illiquidityi,t1 Firmcharacteristicsi,t1 (1)
) , ' , , ( Re , 1 , 1 , , t i t i t i t i stics characteri Firm ratio s Mill Inverse stics characteri Firm y Illiquidit g Intensity purchase (2) ) , ' , (Re , , , t i t i t i stics characteri Firm ratio s Mill Inverse Intensity purchase h y Illiquidit (3)
Insert Table 1.6 here.
In terms of the decision to repurchase shares, the coefficient on lagged illiquidity is statistically significant and positive. This implies that the more illiquid a stock, the more likely the firm repurchases shares. This validates my notion that stock illiquidity motivates firms to repurchase share repurchases in the expectation that doing so increases stock liquidity, consistent with Hypothesis 2. This is inconsistent with Brockman et al. (2008), who suggest higher market liquidity encourages use of repurchases, but their analysis includes unconstrained and
constrained firms. Prior literature suggests unconstrained and constrained firms behave differently, so combining both increases the chance that the effect of share repurchases on the liquidity of firms in one group could be masked. Firms with more cash flows, less leverage, less growth opportunities, and less risk, are more likely to repurchase share. The statistically
31
share repurchase noted in Brav et al. (2005). Firms do share repurchases when they exhaust good investment opportunities.
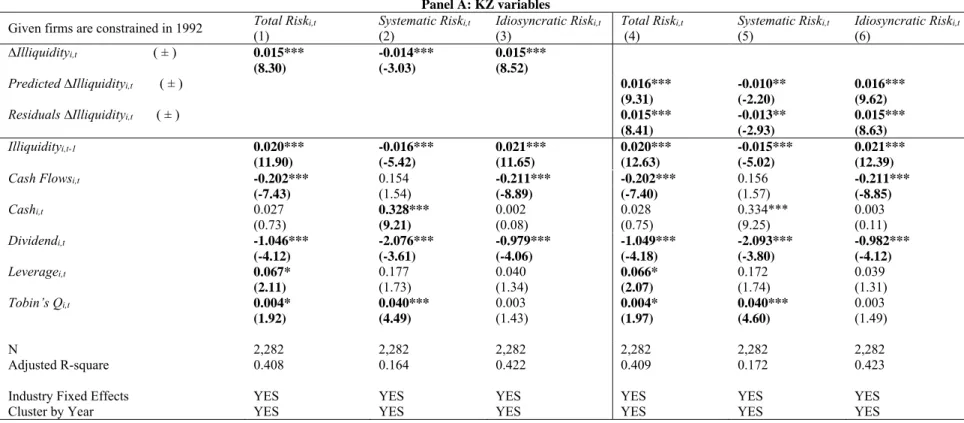
The 2SLS regressions disentangle the endogenous relationship between share repurchases and market liquidity. The specifications for Table 1.6 Panels A and B are robust to
over-identification, valid instruments, and truly endogenous variables restrictions. The key variables here are lagged illiquidity in Column 2 and repurchase intensity in Column 3. Both coefficients are statistically significant and carry predicted signs. The more illiquidity the previous year, the higher the repurchase intensity the current year. Consequently, the higher repurchase intensity, the more negative the change in illiquidity, i.e., the more liquid the stock becomes. In other words, lagged illiquidity prompts firms to repurchase shares, and repurchase intensity enhances market liquidity, consistent with Hypothesis 2. This is also consistent with Hillert et al. (2013), who postulate that firms supply liquidity to the market when they repurchase a large number of shares, and this effect is most pronounced for illiquid markets12. My analysis improves upon
Hillert et al. (2013) in that I employ 2SLS to control for endogeneity, while they use lagged illiquidity in their OLS regressions and do not control for selection bias.
F. The Impact of Market Liquidity on Corporate Decisions and Market Perception
So far, I have shown that financially constrained firms repurchase shares to enhance their stock liquidity. The more illiquid their stock the prior year, the higher the repurchase intensity the current year, and the more liquid their stock becomes. Why would constrained firms care about market liquidity? Fang et al. (2009) investigate the relation between stock liquidity and firm performance and show that firms with liquid stocks have better performance, as measured
12 Goettler et al. (2009) argue that limit orders (via share repurchase) are advantageous in illiquid