DECISION SUPPORT SYSTEM IMPROVES SUPPLY CHAIN
OPERATIONS
Roy Pargas, Clemson University, [email protected] Chris Jarvis, Clemson University, [email protected] J. Steve Davis, Clemson University, [email protected]
John C. Peck, Clemson University, [email protected] Bill Kernodle, Clemson University, [email protected]
Wanbo Luo, Sichuan University, [email protected] ABSTRACT
Military clothing retailers employ a traditional Economic Order Quantity (EOQ) strategy, producing infrequent, large orders that cause serious production scheduling and delivery problems for manufacturers, producing what is sometimes called the bullwhip effect. These problems delay manufacturer response and cause stock outages at the retailer. This paper describes a decision support system that helps increase product visibility in the supply chain and establishes a more frequent, regular ordering scheme based on a forecast of demand. In one supply chain in which this system was deployed stock outages were reduced to near zero and inventories were reduced by $6 million at retail. In another supply chain the system improved product visibility and assisted intelligent production scheduling by the manufacturer, resulting in improved deliveries and thus greater satisfaction of both manufacturer and retailer.
Key words: Decision support system, optimization, supply chain, ordering and distribution, military
INTRODUCTION
Recruit induction (basic training) centers serve as the primary clothing retailers to the military. They employ a traditional Economic Order Quantity (EOQ) strategy, with reorder points and refill levels, producing infrequent, large orders that cause serious production scheduling problems for manufacturers. These problems in turn increase product costs and discourage manufacturers from seeking additional government contracts. These problems furthermore produce the following syndrome. When the inventory level drops below the re-order point for a particular style and size of garment, the manufacturer receives an unexpected, large order for garments of that single style and size. Keeping enough finished goods inventory for every style and size of garment to satisfy any order that might arrive would be too costly for the manufacturer. Therefore the manufacturer must start new production to satisfy the quantity of that one size garment ordered. Consequently, the manufacturer does not respond as fast as the customer would like, and the customer becomes concerned about running out of stock. (The manager of the clothing issue facility is very concerned about avoiding stock outages, because delays in issues can adversely affect the timing or the quality of recruit training.) The customer may react by generating another
problem in the future by increasing the re-order quantity. All of these reactions result in keeping more garments on hand than are really necessary and worsen the problem by ordering even more garments of that particular style and size the next time the reorder point is reached. Since the demand pattern varies with garment size, the aforementioned syndrome typically leads to a situation where the clothing issue facility has huge excesses of inventory in some sizes and is simultaneously experiencing stock outages in others. The military has documented examples in which deteriorated boots from the Korean conflict era are still available and in stock while stock outages occur for more popular sizes of the same boot.
Supply chain problems have a big impact because the number of products and nodes in the chain are large. For example, the DoD clothing operation involves over 5,000 different clothing and equipment items. It supports 16,595 retail outlet customers, including 11 clothing issue facilities (at recruit training centers). Typically, a single clothing issue facility maintains up to $9 million in inventory and another $12 million is stocked at a distribution center (military depot) for that facility. Although the focus was on clothing, the problems and solutions we discuss in this paper pertain to almost all military personnel items that vary by some attribute, such as size.
IMPROVEMENTS AT A RETAIL ORGANIZATION
Under contract from the U.S. Defense Logistics Agency, researchers at Clemson Apparel Research have been working on improvements in the military supply chain. As a pilot project we supported the efforts of one clothing retailer (the U.S. Marine Corps Recruit Training Depot at Parris Island, South Carolina) to improve its operations. The main goal was to significantly reduce inventories at Parris Island while minimizing occurrences of stock outages. Before our project began, the clothing inventory managers employed the aforementioned (EOQ) strategy. They maintained $9 million in clothing inventory and experienced frequent stock outages.
Previous research showed the potential benefits of forecasting (3,7,8), minimizing demand signaling (9) and minimizing order batching (2,9). After studying Parris Island operations a decision was made to pursue these strategies to avoid the “bullwhip effect” (9), a distortion of required orders as one moves upstream in the supply chain. The focus of the project was on lowering inventories and reducing stock outages at the Parris Island retail site while recognizing the consequential benefit of reducing the bullwhip effect for all upstream nodes in the supply chain.
Counter-measures for two of the causes of the bullwhip effect (demand signaling and order batching) appeared directly relevant to the problem at hand. To counter the demand-signaling problem they recommended more visibility of demand and having a single control for replenishment. To counter the order-batching problem they recommended reducing order cost by computer-assisted ordering.
A different, novel approach was taken in our project. A decision support system (DSS) that serves as a single control for replenishment was developed to increase ordering frequency and establish a regular ordering interval (weekly). This system consequently resulted in reduced order g batch size and improved visibility of inventory. A weekly order frequency was used because almost all manufacturers schedule on a weekly basis and because at this frequency orders more closely approximate the actual demand pattern.
The decision support system prescribes the inventory level for each week for each size of each garment to meet the anticipated demand for that week while maintaining a user-specified safety level. Because demand is seasonal, the forecasted inventory level varies from week to week. Primary inputs are: 1) the recruit schedule (number, gender, date of arrival), 2) the issue plan (date and quantity of each garment issued), 3) the tariff (percentage of recruits who fit in each size of a garment), 4) historical order-ship time, and 5) the number of extra days of supply the manager chooses to maintain in inventory. Typically the prescribed inventory level for each week depends upon the expected order-ship time and the manager’s selected acceptable level of risk of encountering a stock outage.
The DSS maintains a history of order-ship time for each size and type of clothing item. The user can access this history and other available information (such as knowledge about a problem with a contract for manufacturing a particular item) when deciding what order-ship time is likely in the future. In choosing the number of days of supply to be held in inventory, the user may consider the expected order-ship time and may choose a safety level, measured in number of extra days of supply to be held in inventory.
Once the user selects a number of days of supply, the system calculates the target inventory level for each week. For example, suppose the user estimates that the future order-ship-time will be 7 days, and the user wants to cover an additional 14 days of supply as safety stock, resulting in a target level of 21 days of supply. Given the anticipated demand for a particular size and type of item, the DSS will calculate the target inventory levels shown in Table 1. For each date, the inventory is the quantity to be issued that date plus the amounts to be issued during the next 21 days. Thus, at any time, there is enough inventory on hand to last 21 days without replenishment.
Date Quantity to be Issued Target Inventory
10/01/1999 20 60
10/08/1999 15 50
10/15/1999 15 40
10/22/1999 10 30
10/29/1999 10 (data not avail.)
11/05/1999 5 (data not avail.)
11/12/1999 5 (data not avail.)
Table 1. Based on the expected demand and the user choice of 21 days of supply, the DSS calculates these values for target inventory.
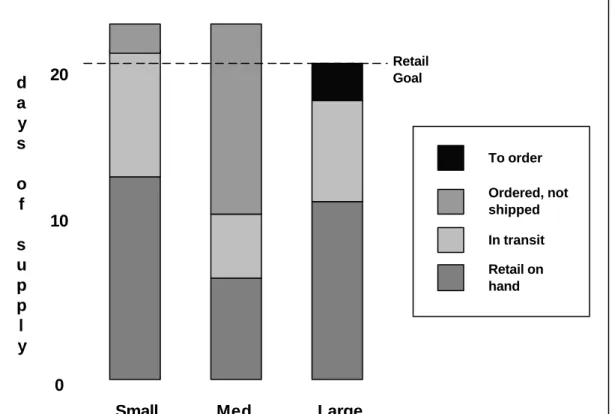
The DSS accounts for the complete status of retail inventory through a graphical display (Figure 1), including the following quantities (measured in days-of-supply): on hand at retail, in transit to retail, and ordered but not shipped. A horizontal line indicates the retail goal. This goal in days-of-supply is constant but the corresponding quantity (in number of items) could change from week to week because it depends upon the forecast of seasonal demand.
(Normally the line is straight but it could vary if the user decides on different target levels for different sizes of a product type.) Each week, if the sum of (on hand at retail, in transit to retail, purchased but not shipped) is below the DSS-prescribed goal for a particular size, the DSS recommends ordering enough to boost the sum at or above the prescribed amount (generally rounded up to the next full case quantity). In this way, the system helps keep inventory at appropriate levels. After using this experimental system for one year, the Recruit Training Depot at Parris Island has experienced almost zero stock outages and has lowered clothing inventories by more than $6 million to a level of $2.6 million.
The new ordering scheme has resulted in more frequent orders of smaller quantity,
approximating a flow system. For example, there were 298 orders with an average quantity of 390 for the men’s camouflage shirt during the year before the new system was installed. The next year there were 547 orders having an average quantity of 236.
Small Med Large
0 20 d a y s o f s u p p l y To order Ordered, not shipped In transit Retail on hand Retail Goal 10
Figure 1. The decision support system indicates retail inventory status and the quantity of each item to be ordered. In this example there should be an order for items of size large. The goal in days-of-supply is constant but the corresponding quantity (in number of items) could change from week to week because it depends upon the forecast of seasonal demand.
LOCAL VS. GLOBAL OPTIMIZATION
Although retail inventory management was greatly improved with the systems described above, the issue of efficient supply chain management was not adequately addressed. Because the major organizations involved in the U.S. military system for clothing ordering and distribution (including recruit induction centers, depots, defense supply centers, and manufacturers) each attempt to locally optimize their own efficiency, their behavior does not necessarily result in the most cost-efficient globally optimized system. For example, consider the policy discussed earlier in which the military depot places a constant handling charge on every line item of an order processed, independent of the line item quantity. This surcharge is easy to administer and it covers depot costs; however, it encourages retail sites to order large quantities to reduce the surcharge per item. If retail sites locally optimized their order quantity, they could quickly exhaust supply chain quantities and would waste storage space.
Consider another example. Often the military establishes contracts with manufacturers specifying minimum and maximum quantities to be delivered, where the range of quantities is large, typically several hundred thousand. This procedure simplifies contracting and provides flexibility to the supply center, but the uncertainty about order quantities results in unreliable deliveries and leads to higher manufacturing costs that are passed on to the military.
From the military clothing manufacturer’s perspective the EOQ and minimum/maximum ordering policies have even greater negative impacts. Since most of the products made by these companies do not have other markets (either by law or by demand, e.g. chemical protective suits cannot be sold on the open market), the companies must send employees home (without pay) when orders are sparse and work employees overtime when orders are heavy. Reasonably level order quantities, with predictable size distributions and intelligent buffer management, are critical to reducing global costs and eliminating stock outages.
For one military supply chain we have designed and implemented a cooperative supply chain partnership between a manufacturer and a retailer that is a step in the direction of global optimization. Such partnerships have shown benefits in other situations (4). This application is a small supply chain consisting of a manufacturer (the factory at Clemson Apparel Research, South Carolina) and a retailer (Clothing Issue Facility at Fort Leonard Wood, Missouri). The manufacturer of the women’s’ army uniform and the retailer have agreed on a goal of maintaining a predetermined level of inventory in the supply chain. We established a decision support system for the manager of the factory that helps implement this agreement. This system shows the manager on one screen the complete status of the women’s’ uniforms. (We provided a decision support system having a similar display to the manager of the retail site.) For example, Figure 2 shows the status from the manufacturer’s perspective on a particular date. A horizontal line indicates the target inventory level, in days of supply, agreed upon by the manufacturer and retailer. (Normally the line is straight but could vary if the users decide on different target levels for different SKU’s of a product type.) A vertical bar represents quantities for a single SKU. The total height of each bar, not counting the “to make” portion, represents (for a single SKU) the sum of the following quantities, each of which is shown as a portion of the bar:
- on hand at retail, - in transit to retail,
- finished goods at the manufacturer, and - work in process at the manufacturer.
Small Med Large
0 20 40 60 d a y s o f s u p p l y To make Work in processs Finished goods To ship In transit Retail on hand Work in processs System Goal Retail Goal
Figure 2. The decision support system for the manufacturer shows the complete status of products in the supply chain. If the amount in the chain for a particular item is less than the system goal, the system recommends manufacturing enough to meet the goal.
The manager can easily determine the health of the supply chain at a glance. One may think of each bar as a picture of the overall supply chain for an item. One may imagine that the column reserved for each bar on the chart represents a picking flow bin. Items can be removed from the bottom of the bar to issue to customers while the manufacturer replenishes items at the top of the bar. The inventory manager should be concerned if the height of the bar becomes very small because there is a danger of experiencing a stock outage. Before this DSS (that provides visibility of the supply chain) was installed, inventory managers often did not take any action until the picking flow bin became empty. The standard remedy was to place a number of phone calls to find out what happened and what could be done.
The system also displays the goal for inventory at retail. Having complete visibility of the supply chain allows the manufacturing manager to take action to achieve the goals to which both parties had mutually agreed. The DSS computes an allocation of available capacity to the SKU’s that are in shortest supply, thus recommending what to produce and consequently increasing the chance of fulfilling orders without delay. The manager can initiate a special action to remedy any alarming situation.
CONCLUSION
The decision support system described in this paper helped achieve significant savings for the Marine Recruit Training Depot by improving effectiveness of one site in a supply chain. Even greater savings could be achieved from a holistic approach targeted at global supply chain optimization. We have begun implementing a plan to conduct a comprehensive analysis of performance to determine how to improve the overall system (1). Our study employs a simulation model that helps determine how the individual organizations should behave to achieve best overall performance. This study will provide a foundation for supply chain management algorithms that can be embedded in decision support software. We expect ongoing research to further reduce costs by 1) assisting manufacturers in predicting orders based on the issue rate, 2) assisting inventory managers in stocking appropriate levels of the right inventory items at the right depot locations and 3) assisting the military services by creating a flow of items into their (much smaller) local inventory warehouses that closely approximates the flow out of those warehouses.
A preliminary version of some of the techniques described in this paper was presented earlier (5,6). This work was supported by The National Science Foundation (grant DMI-0075608) and the Defense Logistics Agency.
REFERENCES
1. Beamon, B. (1999). Measuring Supply Chain Performance. International Journal of Operations & Production Management, (19,3), 275.
2. Cachon, G. (1999). Managing Supply Chain Demand Variability With Scheduled Ordering Policies. Management Science,(45,6), 843.
3. Cohen, R. & Dunford, F. (1986). Forecasting For Inventory Control: An Example Of When ‘Simple’ Means ‘Better’. Interfaces, (16), 95-99.
4. Corbett, C., Blackburn, J. & Wassenhove, L. (1999). Case Study: Partnerships To Improve Supply Chains. Sloan Management Review, Summer, 71-82.
5. Pargas, R., Jarvis, C., Davis, J., Peck, J., Kernodle, J. & Luo, W. Decision Support for Supply Network Mana gement. Proceedings of SSGRR-2001, L’Aquila, Italy, August 6-12, 2001.
6. Peck, J. & Davis, J. (1999). Optimization In The U.S. Military Supply Chain. Proceedings of the 10th International DAAM Symposium, Editor B. Katalinic, published by DAAAM International Vienna, Austria, 425-426.
7. Gardner, E. (1990). Evaluating Forecast Performance In An Inventory Control System. Management Science, (36,4), 490-499.
8. Lavallee, I. & Raymond, W. (1998). Utilizing Forecast Information To Drive Solutia's Supply Chain. Journal of Business Forecasting Methods & Systems , (17,2), 7-13.
9. Lee, H., Padmanabhan, V. & Whang, S. (1997). Information Distortion In A Supply Chain: The Bullwhip Effect. Management Science, (43,4), 546-558.