Instrumenting V8 to Measure the E
ffi
cacy of
Dynamic Optimizations on Production Code
Michael Maass
Ilari Shafer
March 2013 CMU-ISR-13-103
Institute for Software Research School of Computer Science Carnegie Mellon University
Pittsburgh, PA 15213
This material is based upon work supported by the Army Research Office under Award No. W911NF-09-1-0273 and the Air Force Research Laboratory under Award No. FA87501220139, by the Department
Keywords: JavaScript, virtual machine, dynamic optimization, measurement, instru-mentation
Abstract
As JavaScript has risen to dominance as the language of the Web, popular web browsers have responded by introducing a variety of compilers designed to optimize JavaScript speed. Public one-upmanship has played out between these browsers on the basis of performance on a few benchmarks. Surprisingly, how well JavaScript compilers fare on real-world web applications has received little concerted attention.
Here, we study the impact of the widespread V8 JavaScript compiler in six scenar-ios using a new testing framework. We find that the benefit of optimization in a number of realistic scenarios is small—and sometimes even harmful. Classic optimizations used in static compilers fare poorly, and the time taken to do compilation is a prominent factor. Our findings highlight the importance of better benchmarks, and suggest more
1
Introduction
JavaScript has emerged as the lingua franca of the World Wide Web. The highly dynamic client-side interactions that define many popular websites, such as Gmail and Facebook, are made possible by extensive and complex use of the language. Furthermore, JavaScript has broken through into other domains where statically compiled languages have tradi-tionally held sway, such as Windows desktop applications [19], mobile applications [5] and services [13], server-side code [7], and more. In light of its emerging popularity, a flurry of recent work has focused on producing (and improving) optimizing compilers for JavaScript [3, 6, 9–11, 14]. All these compilers are just-in-time (JIT) engines that generate optimized native code at runtime, though the details of their optimizations vary.
After ensuring the correctness of its output, the clear criterion for a successful opti-mization pass made by such a compiler is improved performance of the resulting code. For representative workloads, optimized code should improve some metric—here we consider execution time. When optimizations happen at runtime, measuring whether they have been successful is even more important, since dynamic optimization requires overhead to actually perform the compilation that could have instead been occupied by interpretation or execution of unoptimized code. Furthermore, many optimizations for dynamic languages are optimistic: under certain conditions the compiler must perform an expensive replacement of optimized code with unoptimized code to account for an exceptional condition that renders the optimized code invalid.
In light of the challenges facing effective optimization, surprisingly little effort has focused on how well recent optimization techniques fare on the real-world, popular workloads such as Gmail and Facebook. Though evaluations of compilers and optimiza-tions include some form of efficacy analysis, for JavaScript they are typically restricted to workloads that do not represent actual web applications. To our knowledge, this is the first study that has focused on granular analysis of compiler optimizations for JavaScript on multiple real-world scenarios.
To that end, we make two primary contributions in this work. First, we design and implement a framework for evaluating optimization efficacy for real-world applications from a production compiler. Second, we apply this framework to six web application scenarios, which results in a number of preliminary findings about compiler behavior in V8:
Optimization has limited benefit: For the scenarios and real-world web applications we study, the optimizer has a very small benefit or even negatively impacts performance, even while producing drastic improvements in widely-used benchmark code.
Many optimizations diminish performance: Traditional optimizations that produce benefits in compilers for static languages have little or negative impact on these sce-narios. Furthermore, the choice of optimizations that is useful for targeting benchmark improvement may not necessarily the best for production web applications.
Compiler overhead is significant: Time taken for compilation is significant compared to code execution time. A substantial portion of compilation time is spent managing large amounts of JavaScript code. Attempting to perform more extensive compilation increases
this overhead due to both optimization and deoptimization.
After introducing JavaScript and the V8 compiler in Section 2, we describe our frame-work and instrumentation approach in Section 3. Section 4 delves into the insights sum-marized above, which produce a number of directions for work on JavaScript compilation. We highlight a few promising ones in Section 6.
2
Background
We study JavaScript, as it is used to some extent in almost all of the most widely-visited websites [1, 18], and particularly heavily by popular web applications [22]. To study the effect of compiler optimization, we use the V8 JavaScript engine [10] within the Chromium browser1, which by many indicators has eclipsed Internet Explorer as the most popular browser [23, 24]. V8 is a particularly relevant focus because it is enjoying growing use outside of Chromium [5,7,13] and the second-most widely used JavaScript engine (Internet Explorer’s) is not open-source.
2.1
Real-World JavaScript
JavaScript is a dynamically-typed, garbage-collected language with a prototype-based object model [8]. The language is highly dynamic: fields, methods, prototypes, and types can all change at runtime, and arbitrary strings can be executed as code. A number of characteristics of real-world JavaScript make compilation challenging. Foremost, dynamic features prevent trivial static analysis of the code, and require special cases to handle situ-ations like variables and fields that change type [2]. Widespread use of variadic functions, theeval function to execute text as code, method polymorphism, constructor
polymor-phism, and runtime changes in object prototypes introduce additional challenges [17, 22]. Furthermore, many real-world sites require parsing on the order of megabytes of this sort of JavaScript [22]. To cope with these challenges, V8 performs selective optimization of code through a multi-stage process.
2.2
Compiler Overview
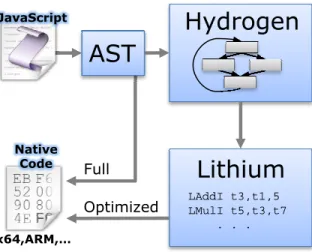
V8 contains two compilers and a runtime engine. The broad architecture is shown in Figure 1 on page 3. When V8 first examines any JavaScript code, it parses it to an abstract syntax tree (AST) and runs the first compiler, a full code generator. This compilation pathway performs no optimization, and produces native code (e.g., x64 or ARM) with full runtime support for JavaScript’s dynamicity. The second pathway is the optimizing compiler, which uses two forms of intermediate code. First, the compiler transforms the AST into a high-level intermediate representation (IR) named Hydrogen. This IR is a graph of basic blocks with code in Static Single Assignment (SSA) form and is the vehicle for the
1Chrome is the Google-branded and augmented version of Chromium
Hydrogen
JavaScriptAST
Lithium
LAddI t3,t1,5 LMulI t5,t3,t7 . . . Native Code x64,ARM,… Full OptimizedFigure 1: V8 Compilation Pipeline. V8 contains two means for producing native code: a full code-generator and a two-stage optimizing compiler.
optimizations we study. Once the Hydrogen IR has been transformed by optimization passes, it is translated to a low-level three-address code called Lithium. This form is similar to bytecode that would be run in a register VM, and it is used for register allocation. Finally, to produce optimized code, Lithium is compiled to native code. The native code produced by the optimizing compiler replaces unoptimized code through a process known as on-stack replacement. On-on-stack replacement allows code to be optimized and deoptimized even in situations such as the middle of an executing loop.
Execution may not always be able to stay within optimized code at runtime. A variety of conditions, such as changes in variable types, may render optimized code invalid. The optimized code contains guards to ensure that conditions for optimistic optimization still hold. If they do not, a deoptimization process occurs. Code from the full code generator is kept, and on-stack replacement replaces the execution context and stack with the full native code. We do not go into detail here, but the process can be expensive, as we substantiate later.
3
Approach
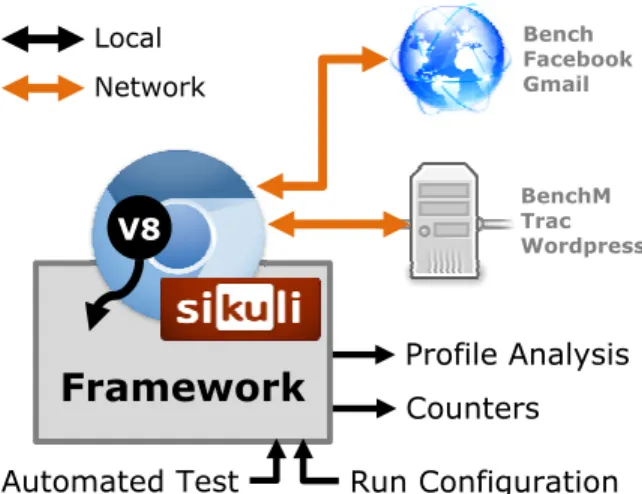
To study the impact of compiler optimizations in V8, we constructed a framework to selectively enable optimizations within the compiler, run real-world scenarios with a certain set of optimizations, and instrument the resulting behavior. An overview of our approach is shown in Figure 2 on page 4. This framework toggles optimizations within the V8 engine in Chromium and collects both profiling information and a set of internal counters. We enable it while targeting the browser at a variety of application interactions that we script.
Local Network BenchM Trac Wordpress Bench Facebook Gmail V8 Counters Profile Analysis Run Configuration
Framework
Automated TestFigure 2: Instrumentation and Evaluation Framework. We build a framework around and within the Chromium browser to extract information from V8 as it runs code from real-world applications on the Internet or a local server.
3.1
Selective Optimization
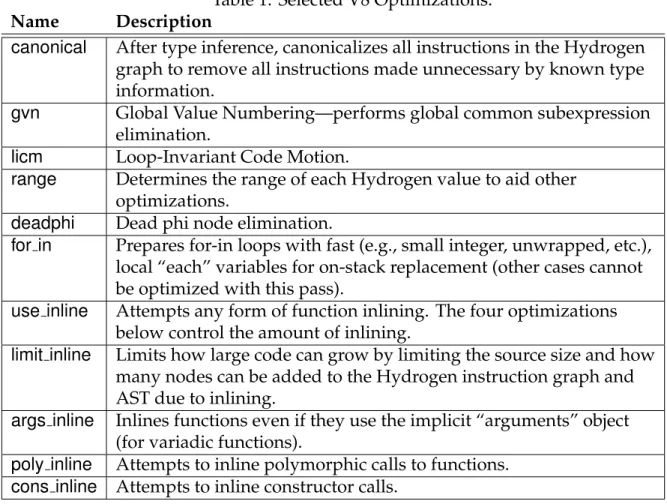
The code optimization process in Chromium modifies a Hydrogen IR graph as it is created. We can selectively disable parts of the optimization without compromising the correctness of the resulting code. The first key part of this selective configuration controls whether the optimization path is enabled at all—it can be disabled and the full code generator used instead. When the optimizing compiler is enabled, we control 11 internal flags that alter how the code is optimized; they are listed in Table 1 on page 5. Some of these (gvn, licm,
range, anddeadphi) are very similar to the passes used in static compilers. Thecanonical
step is unique to dynamically-typed languages. Although function inlining is certainly not a new concept, it requires more care for JavaScript, and is a particular focus of the optimizing compiler. This is reflected in the inclusion of 5 flags that control inlining.
3.2
Real-World Scenarios
With a particular configuration of optimizations, we start Chromium and direct it to load a page. We focus onreal-worldsites like Gmail and Facebook. To compare the impact of optimization on real-world sites with published results, we also include the V8 benchmark suite. Beyond merely loading a page, we are interested in testing workloads that a browser would experience. Therefore, to emulate a user’s actions we write a series of tests using the Sikuli UI automation tool [4]. These six tests are:
Bench The scenario visits a web page containing the V8 benchmark suite (version 7) and waits until it completes. The benchmark primarily does compute-intensive work and data structure manipulation. It does not do a constant amount of work—it runs benchmarks for periods of 1 second until at least 32 executions are run.
Table 1: Selected V8 Optimizations.
Name Description
canonical After type inference, canonicalizes all instructions in the Hydrogen graph to remove all instructions made unnecessary by known type information.
gvn Global Value Numbering—performs global common subexpression elimination.
licm Loop-Invariant Code Motion.
range Determines the range of each Hydrogen value to aid other optimizations.
deadphi Dead phi node elimination.
for in Prepares for-in loops with fast (e.g., small integer, unwrapped, etc.), local “each” variables for on-stack replacement (other cases cannot be optimized with this pass).
use inline Attempts any form of function inlining. The four optimizations below control the amount of inlining.
limit inline Limits how large code can grow by limiting the source size and how many nodes can be added to the Hydrogen instruction graph and AST due to inlining.
args inline Inlines functions even if they use the implicit “arguments” object (for variadic functions).
poly inline Attempts to inline polymorphic calls to functions.
cons inline Attempts to inline constructor calls.
BenchM For instrumentation purposes, we desire benchmarks that do a constant amount of work. BenchM is our slightly modified version ofBenchthat performs a constant amount of work (32 benchmark executions).
Facebook This scenario logs into Facebook as a test user. It then visits the user’s Wall page to create a post and subsequently delete it. Next, it uses the photo upload tool to post a photo and place a tag on the photo. Finally, it removes the photo from the user’s page, refreshes the page, and removes the tag notification from the user’s wall.
Gmail This scenario logs into Google’s Gmail as a test user we created. It waits for the Gmail load sequence to complete, then opens a menu that lists actions for the user’s inbox. It then uses the search feature to find messages before logging out.
Trac We test against an installation of the Trac project management and issue tracker, version 0.12.3. Our local install is on a separate machine in order to not impact Chromium’s performance. The scenario logs into an instance of Trac that was seeded with tickets, searches for an item, and then waits for the search to complete
and display results.
WordPress We utilize a local install of the popular WordPress content management sys-tem, version 3.3.1. The scenario begins by logging in to WordPress and waiting for the administrative panel to load. It then starts a new post, types in text, and uses a photo upload tool to insert an image into the post. Finally, it clicks a button to load a preview of the resulting post.
3.3
Instrumentation
To understand how the compiler behaves in the presence of different optimizations, we collect and analyze two forms of instrumentation: traces from a sampling profiler and a set of internal counters that are incremented for certain compiler actions. For all modifications we build Chromium from source at revision 128907.
3.3.1 Profile Traces
We use a profiler to investigate where time is spent in a scenario. Developers are often interested in understanding where their JavaScript programs spend their time. To support this use case, the V8 runtime contains a sampling profiler that is available within the Chromium browser interface. Rather than attempt to use this UI-based profiler, we enable the internal profiler and configure it to begin profiling on browser startup and dump its output to a log file.
The profiler operates by sampling the execution state of the browser every 2 millisec-onds, and records the currently-executing point in the V8 code. Unlike the UI-based profiler, the emitted logs also provide sampled function names within the compiler. This property enables us to separate calls into two categories: optimizing compiler calls and JavaScript runtime calls. By aggregating time across all samples, we obtain a breakdown of compilation overhead and execution time as well as functions that occupy the most time. Although a sampling profiler is by nature less precise, it allows us to run code at near normal execution speed and capture a more accurate trace.
3.3.2 Internal Counters
To obtain a deeper understanding of how optimizations behave internally, we use and add to a set of internal counters maintained by the V8 compiler and runtime. They record various characteristics of compilation (e.g., the size of compiled code), as well as many runtime behaviors that are affected by the optimizing compiler (e.g., the number of deoptimizations). These counters are not collected within the Chromium browser, and to our knowledge are used only by developers of V8 from a JavaScript interpreter shell. We adapt the counter collection system to the Chromium browser and periodically dump all available counters to an output file. Our analysis framework parses these outputs.
We provide further detail about selected counters in analyzing the results of scenario execution.
4
Results
We have applied our framework to the scenarios from Section 3.2. We present some of the most intriguing behavior here. First, we confirm that optimizations work well for a benchmark suite, but perform far worse for the real-world scenarios we study. This framework also enables us to focus onhowto optimize, and indicates that the default set of optimizations that improves benchmark performance can be inferior to simply leaving optimizations off. Last, we take a deeper look into the sources of performance degradation and compiler overhead through the lens of these instrumentation results.
4.1
Optimization has limited benefit
A key question for an optimizing compiler is whether optimization has a positive effect on performance. If compilation reduces code execution performance or the runtime over-head of optimization overwhelms its benefits, there is an overall loss. To investigate the potential benefit, we run each of the scenarios described in Section 3.2 for three compiler configurations. One case,default,represents what is shipped with V8/Chromium. sel off
reflects the optimizing compiler turned on but with selected optimizations disabled, and
no optis a case where the optimizing compiler has been turned offentirely and only full code generation is used.
BenchM
Gmail
Trac
WordPress
0.0
0.2
0.4
0.6
0.8
1.0
1.2
1.4
Normalized Ticks
51 42 0
7 3 0
2 6 0
6 -2 0
-2 1 0
default: Ships in Chromium
sel_off: Select Optimizations Off
no_opt: No Optimization
Javascript
Compiler
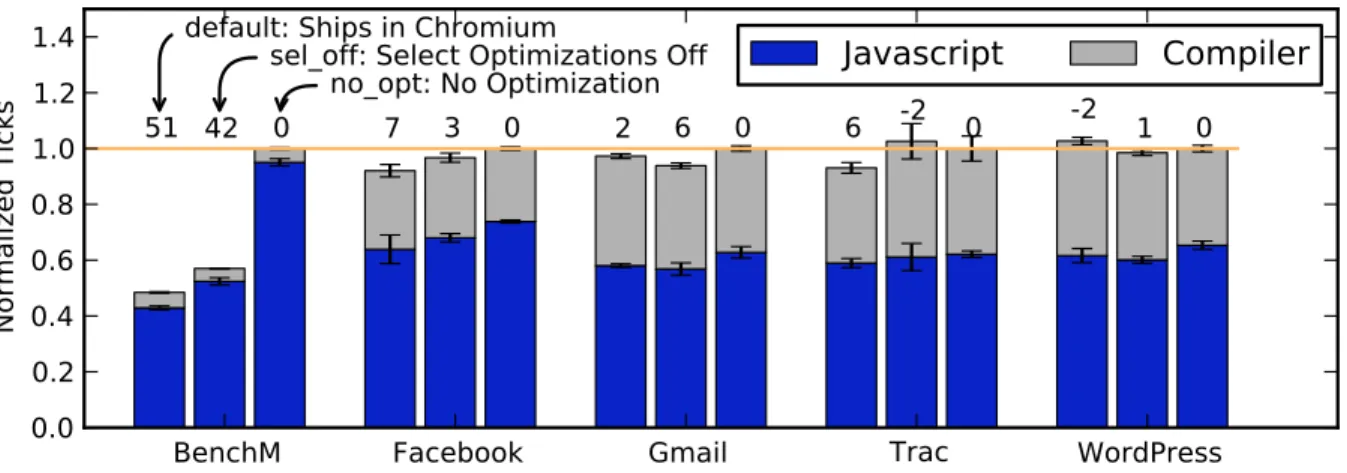
Figure 3: Overall Performance Results. Total time spent executing JavaScript code and running compilation is shown for the six scenarios we analyze. The vertical axis is normalized to runtime with the optimizing compiler turned off(the rightmost bar in each case). The real-world scenarios benefit less from optimization than the V8 benchmark suite (BenchM). In multiple cases optimization actually reduces performance.
default
sel_off
no_optcanonical
gvnlicmrangedeadphi
for_inuse_inline
limit_inline
args_inline
poly_inline
cons_inline
0.0
0.2
0.4
0.6
0.8
1.0
Normalized Ticks
14 0
-78
2 2 0 2 2 1 0 -1 0 -1 -1
BenchM Selective Optimization
default
sel_off
no_optcanonical
gvnlicmrangedeadphi
for_inuse_inline
limit_inline
args_inline
poly_inline
cons_inline
0.0
0.2
0.4
0.6
0.8
1.0
Normalized Ticks
-5 0 -1 -2 -2 1 1 -2 -6 -3 -4 0 -5 -6
Gmail Selective Optimization
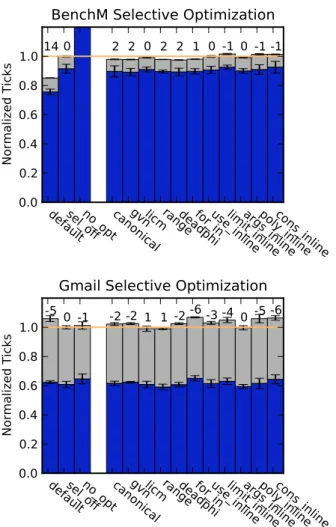
Figure 4: Selective Optimization Effect.
These profiling results summarize the ef-fects of selective optimization for two sce-narios. In each case, the three bars grouped to the left show execution times for the same configurations shown in Figure 3 on page 7. Bars to the right show the impact of toggling certain optimizations individually. Num-bers above the bars show percentage run-time improvement (or degradation).
The effects of optimization are markedly different among the scenarios. Figure 3 on page 7 illustrates the impact for each of these configurations. As expected and widely disseminated, the V8 optimizing compiler improves performance on the constant-work benchmark considerably (by 51%). On the realistic scenarios we study, however, benefits are either small or nonex-istent. For example, the compiler does pro-duce an improvement for the Facebook test, where sel off produces a 3% improvement and the optimizations from Figure 4 add another 4%. However, for WordPress, the net effect of the defaultcompiler configura-tion is actually negative (a 2% degradaconfigura-tion). Additionally, for the Gmail test, although the net effect of default is slightly positive, it includes optimizations that harm perfor-mance relative to thesel offcase. We exam-ine this behavior further in the next section.
4.2
Many optimizations diminish
performance
To further examine how toggling optimiza-tion affects performance, rather than turn-ing off all optimizations, we selectively switch on individual ones. We consider the set of optimizations summarized in Table 1 on page 5. The performance baseline is the configuration with optimizing compiler on, and we toggle each optimization sepa-rately. Figure 4 considers two cases from the overall results: one where optimiza-tions dramatically improved performance (BenchM) and one where the default opti-mizations were harmful (Gmail). As above, we run each scenario four times for each configuration.
As expected, optimization dramatically improves performance for the V8 benchmark suite (theno opttime is more than twice the time of thesel offcase). Likewise, individual
optimizations on the whole make small but relatively consistent improvements. How-ever, the full set of optimizations reduces performance for the Gmail test (thedefaultbar at right), and many individual optimizations are unproductive. In particular, optimizations like global subexpression elimination throughgvnthat improve benchmark performance are harmful. Additionally, the high compilation overhead for Gmail has no corresponding decrease in JavaScript execution time, and produces the negative difference fromsel offto
default. Many traditional compiler optimizations have negligible or negative impact. For example, while gvn and inlining produce benefits for benchmark code, they negatively impact the Gmail scenario. Meanwhile, we observe that range analysis is the only opti-mization that benefits the Gmail scenario—possibly due to the significant simplifications the compiler can make when it knows a numeric type is a small integer [10].
4.3
Reasons for Performance
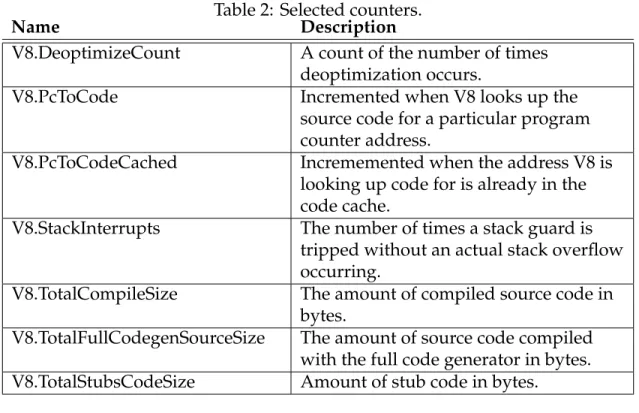
To gain some understanding ofwhyoptimizations might be hurting performance in some circumstances, we compared V8’s internal counters between theno optanddefaultcases from Section 4.1, as well as a configuration when the compiler performs optimization on all possible code,always opt. Table 2 on page 10 summarizes the counters we found to be interesting. All of the listed counters were already present in V8, aside from the DeoptimizeCount counter, which we added. This table only shows counters that changed by more than 15% between thedefault and always opt cases. The counters reveal some trends as optimization becomes more aggressive.
Tables 3 and 4 summarize selected counters for BenchM and Gmail respectively. In general, the trend is towards more deoptimizations, stack interrupts, and compiled code as optimization becomes more aggressive. Except in the case where optimizations do not occur, program counter to source code looks-ups also occur more often and stubs are utilized less often as optimization becomes more aggressive. As expected, the trend is towards performing notably more operations in the compiler as the amount of opti-mization increases. In particular, we measured the impact of increasing deoptiopti-mization. By isolating time taken for deoptimization from the profiler results, we find that for
always opt on BenchM the time required to execute deoptimization is a significant com-ponent of runtime—it increases from 0 to 7333±107 profiler ticks as compared to a total of 24726±193 execution ticks.
In Section 4.2 we saw that the compile-time overhead for applications like Gmail is higher than for the V8 benchmark. The question arises of which portions of the compilation process contribute to this overall overhead. We break down compilation time into its multiple phases by analyzing the contents of the profile and manually attributing a point in the profile to one of nine portions of the codebase. Five of these phases (Assembler, Lithium, Hydrogen, AST, and Parser) correspond to the portions in Figure 1 on page 3, and three (LowLevel, Shared, and Tracing) are work that is shared between multiple parts of the compiler. Figure 5 illustrates the breakdown for the three summary configurations used previously.
Table 2: Selected counters.
Name Description
V8.DeoptimizeCount A count of the number of times deoptimization occurs.
V8.PcToCode Incremented when V8 looks up the source code for a particular program counter address.
V8.PcToCodeCached Incrememented when the address V8 is looking up code for is already in the code cache.
V8.StackInterrupts The number of times a stack guard is tripped without an actual stack overflow occurring.
V8.TotalCompileSize The amount of compiled source code in bytes.
V8.TotalFullCodegenSourceSize The amount of source code compiled with the full code generator in bytes. V8.TotalStubsCodeSize Amount of stub code in bytes.
Table 3: BenchM Counters forno optvs. defaultvs. always opt.
Name no opt default always opt
V8.DeoptimizeCount 0 31 29425969 V8.PcToCode 118849 69203 29818239 V8.PcToCodeCached 97931 47706 29796116 V8.StackInterrupts 1 4217 26108 V8.TotalCompileSize 741300 890799 1107903 V8.TotalFullCodegenSourceSize 28681431 41973361 60602864 V8.TotalStubsCodeSize 34731 195279 81053
Table 4: Gmail Counters forno optvs. defaultvs. always opt.
Name no opt default always opt
V8.DeoptimizeCount 0 56 98783 V8.PcToCode 410190 518182 426063 V8.PcToCodeCached 219940 304559 232197 V8.StackInterrupts 1 2274 3297 V8.TotalCompileSize 6240862 6246345 7312290 V8.TotalFullCodegenSourceSize 946922601 961168438 1889612635 V8.TotalStubsCodeSize 58201 123055 96876 10
default sel_off no_opt
0
50
100
150
Profiler Ticks
BenchM
Other: Uncategorized
Tracing: Counters, profiling overhead
Shared: Stubs, ICs, deoptimization, ...
LowLevel: Locking, memory, ...
Parser: Scan, lex JavaScript source
AST: Create and traverse tree
Hydrogen: Build, optimize high-level IR
Lithium: Produce low-level IR
Assembler: Write native code
default sel_off no_opt
0
200
400
600
800
Gmail
Figure 5: Compiler Time Breakdown. Here we decompose compilation time into its different phases for the same cases shown in Figure 4 on page 8. It is evident that optimization time is a smaller contributor to compiler overhead for Gmail than for BenchM.
An overall observation for the Gmail test is that much of this compilation time does not come from time spent in the optimizer. Rather, it appears to be from work that must be done in any case, even with the optimiz-ing compiler turned off entirely. Of all the time allocation, parser code is the largest contributor. Though initially surprising, this is sensible in light of the much larger size of the Gmail source: based on internal counters, the parser handles over 14 times as much code in Gmail than in BenchM.
While compilation overhead for BenchM does increase significantly as a result of time spent in the optimization path, the total overhead is small compared to the decrease in JavaScript execution time it produces. These results also indicates that the oppor-tunity for optimization is more limited in real-world applications.
5
Related Work
Our findings above expand upon studies that indicate JavaScript benchmarks do not represent real-world application behavior. Richards et al look across three popular benchmark suite and find that they use features of dynamic languages much less than real-world applications [22]. The JS-Meter project focuses more closely on how behavior differs between benchmarks and real sites using within-browser infrastruc-ture that more closely resembles our own. Its analysis illustrates that popular bench-marks are also not representative on met-rics important for compilation, such as code size, instruction mixes, and hot code [20].
Other efforts examining benchmarks have arrived at the same conclusion, and one in par-ticular provides evidence that compilation may negatively impact JavaScript performance in some cases [17].
some evaluation of their impact. However, many of these analyses focus on benchmark suites, primarily the three most popular (SunSpider, V8, and Kraken) [2, 3, 6, 9]. In a promising development, Hackett et al at least consider real-world websites by investi-gating how they differ from benchmarks, but still only run a performance evaluation on benchmark suites [11]. To our knowledge, no published JavaScript compiler design efforts have included a comprehensive benchmark on real-world applications.
Similar investigations to ours have been performed for other programming languages that make use of JITs. [15] discuss various optimizations used by the Java HotSpot com-piler and evaluates their efficacy. Many of the optimizations used by V8, such as on-stack replacement, were first discussed in [12] and were implemented in HotSpot before they were used in V8. Kotzmann et al found that these optimizations were consistently worth-while for Java code.
6
Discussion
Given the widespread use of JavaScript today and the attention that has been given to max-imizing its performance, it seems unfortunate that the real-world effect of optimization has not been more deeply studied. We find that complex optimizations, while beneficial for benchmarks, are of limited usefulness in selected application scenarios. This find-ing suggests further, broader work to evaluate real-world benefit, and reconsideration of where dynamic compiler writers spend their effort. Furthermore, these optimizations for dynamic languages are difficult; it is often not easy to demonstrate they are correct due to changing runtime information and the need to deoptimize dynamically [10]. Here we suggest a few directions based on our findings.
If widely-touted improvements in benchmark performance are not improving (or even harming) real-world applications, it is well worth rethinking widely-used metrics of suc-cess. The scenarios we studied were necessarily constrained in length and diversity; more representative JavaScript benchmark suites are an important avenue of future research. Recent work on extracting benchmarks from real applications [21] is one promising route. We observe performance degradation from compilation overhead, but for the real-world scenarios we study, that overhead largely comes from source manipulation rather than optimization. Even though Chromium already lazily transforms source to AST, techniques to limit the amount of code scanned by the browser would be interesting directions. Other methods for offloading just-in-time compilation such as running it in parallel on multiple cores are also enticing and need further work to address queueing issues [16].
There seems to be an elusive transition zone where a just-in-time profiler might select good places to optimize, thus improving performance for real applications. A profiler that is not aggressive enough minimizes the usefulness of an optimizer, but a profiler that is too aggressive causes serious performance degradation. Finding a superior point along this spectrum for real-world applications is a key step moving forward.
Optimizing compilers by nature must focus their optimization efforts on changes that 12
yield performance improvements. Likewise, it is important that compiler research efforts emphasize improvements that benefit real applications. We neither believe nor hope that this work serves as an authoritative compiler benchmark; instead, we hope its insights help inform efforts like those above.
References
[1] Alexa. Top Sites. http://www.alexa.com/topsites.
[2] Mason Chang, Bernd Mathiske, Edwin Smith, Avik Chaudhuri, Andreas Gal, Michael Bebenita, Christian Wimmer, and Michael Franz. The impact of optional type infor-mation on jit compilation of dynamically typed languages. InDLS, pages 13–24, New York, NY, USA, 2011. ACM.
[3] Mason Chang, Edwin Smith, Rick Reitmaier, Michael Bebenita, Andreas Gal, Chris-tian Wimmer, Brendan Eich, and Michael Franz. Tracing for web 3.0: trace compila-tion for the next generacompila-tion web applicacompila-tions. InVEE, pages 71–80, New York, NY, USA, 2009. ACM.
[4] Tsung-Hsiang Chang, Tom Yeh, and Robert C Miller. GUI testing using computer vision. InCHI, pages 1535–1544, New York, NY, USA, 2010. ACM.
[5] A Charland. Mobile application development: web vs. native. Communications of the ACM, 54(5):49–53, 2011.
[6] Maxime Chevalier-Boisvert, Erick Lavoie, Marc Feeley, and Bruno Dufour. Boot-strapping a self-hosted research virtual machine for JavaScript: an experience report. InDLS, pages 61–72, New York, NY, USA, 2011. ACM.
[7] Ryan Dahl. Node.js: Evented I/O for V8 JavaScript. http://nodejs.org.
[8] ECMA International. Standard ECMA-262: ECMAScript Language Specification, 3rd edition. Technical report, 1999.
[9] Andreas Gal, Brendan Eich, Mike Shaver, David Anderson, David Mandelin, Mo-hammad R Haghighat, Blake Kaplan, Graydon Hoare, Boris Zbarsky, Jason Oren-dorff, Jesse Ruderman, Edwin W Smith, Rick Reitmaier, Michael Bebenita, Mason Chang, and Michael Franz. Trace-based just-in-time type specialization for dynamic languages. InPLDI, pages 465–478, New York, NY, USA, 2009. ACM.
[10] Google Inc. V8 - Project Hosting on Google Code. http://code.google.com/p/v8/. [11] Brian Hackett and Shu-yu Guo. Fast and Precise Hybrid Type Inference for JavaScript.
[12] Urs H ¨olzle. Adaptive Optimization For Self: Reconciling High Performance With
Ex-ploratory Programming. PhD thesis, 1994.
[13] HP. Developing JavaScript Services. https://developer.palm.com/content/api/ dev-guide/js-services/overview.html.
[14] Dongseok Jang and Kwang-Moo Choe. Points-to analysis for JavaScript. In SAC, pages 1930–1937, New York, NY, USA, 2009. ACM.
[15] Thomas Kotzmann, Christian Wimmer, Hanspeter M ¨ossenb ¨ock, Thomas Rodriguez, Kenneth Russell, and David Cox. Design of the Java HotSpot client compiler for Java
6. ACM Trans. Archit. Code Optim., 5(1):7:1–7:32, May 2008.
[16] Prasad A Kulkarni. JIT compilation policy for modern machines. InOOPSLA, pages 773–788, New York, NY, USA, 2011. ACM.
[17] Jan Kasper Martinsen, Hakan Grahn, and Anders Isberg. Evaluating four aspects of JavaScript execution behavior in benchmarks and web applications. InICWE, pages 399–402, Paphos, Cyprus, 2011. Springer.
[18] JK Martinsen. A methodology for evaluating JavaScript execution behavior in inter-active web applications. InAICCSA, pages 241–248, Sharm El-Sheikh, Egypt, 2011. [19] Microsoft. Roadmap for Metro style apps using JavaScript.http://msdn.microsoft.
com/library/windows/apps/hh465037.
[20] Paruj Ratanaworabhan, Benjamin Livshits, and Benjamin G. Zorn. JSMeter: Measur-ing JavaScript Behavior in the Wild. InWEBAPPS, Boston, MA, USA, 2010.
[21] Gregor Richards, Andreas Gal, Brendan Eich, and Jan Vitek. Automated construction of JavaScript benchmarks. In OOPSLA, pages 677–694, Portland, OR, USA, 2011. ACM.
[22] Gregor Richards, Sylvain Lebresne, Brian Burg, and Jan Vitek. An analysis of the dynamic behavior of JavaScript programs. InPLDI, pages 1–12, New York, NY, USA, 2010. ACM.
[23] StatCounter. GlobalStats Top 5 Browsers. http://gs.statcounter.com/ #browser-ww-monthly-201103-201203, 2012.
[24] W3Counter. Web Browser Market Share March 2012. 2012.