Cover Page
Conference Name: 51st Conference of Australian Agricultural and Resource Economics Society, 2007
Paper title: Forecasting dairy herd development in China Authors: Dong Wang and Kevin Parton
Forecasting Dairy Herd Development in China*
With the rapid development of the Chinese dairy industry, various researchers have examined the industry from many perspectives related to supply and demand. One of the most important factors for this industry is the total number of dairy cows and it is this aspect that will be addressed in this paper.
This paper examines how economic and biological factors influenced the size of the Chinese dairy herd population using an autoregressive distributed lag model and a dairy herd inventory model.
The estimated results showed that the biological process was dominating the development of the Chinese dairy herd. The ratio of milk to corn price, as an
economic variable, is another factor that had an impact. Beef price, which was found to be an influential variable for the United States dairy cattle inventory did not have a significant impact on the Chinese dairy industry. This is expected to change as the dairy industry in China develops.
Results from this study also suggest that Chinese farmers have a positive expectation in the long term towards the dairy industry and that there are high adjustment costs in dairy production in China.
Finally, the projection results showed that it is very likely that the dairy cattle numbers in China would double between 2005 and 2010.
Key words: dairy herd, China, cattle inventory model, projection
*This paper is based on PhD research currently being undertaken by Dong Wang. The authors wish to acknowledge the support of Meat and livestock Australia in funding this research.
†Dong Wang (email:[email protected]) is a PhD student in the Faculty of Rural Management, University of Sydney, Orange, NSW 2800. Kevin Parton is a Professor of Agricultural Economics at Charles Sturt University, Orange NSW, 2800
1. Introduction
China’s dramatic increase in dairy production has stimulated a considerable amount of research on the growth of supply and demand for dairy products in China. A large proportion of the research is focused on the demand side (Dong 2005; Fuller et al. 2004; Fuller and Hu 2005; Glosser 1999; Griffin 2004; Guo et al. 2000; Hu et al. 2004; Liu and Chen 2003). Even though it is one of the most important agriculture production elements, the expansion of dairy herd size has received limited attention from researchers.
Research into this aspect of the dairy industry is of importance to understand the future capacity of Chinese milk production, to measure the future milk self-sufficiency and consequently, the international trade of Chinese dairy products. Additionally, with the rising pressure of calf supply to the Chinese beef industry, the projection of Chinese dairy herd size could indicate the potential of supplying male calves to Chinese beef production. Furthermore, understanding the driving forces of dairy herd development and its momentums can enable analysis of scenarios such as government intervention.
It would be expected that the development of the Chinese dairy industry would be influenced by milk price, feed price and beef price. In particular, a better
understanding of the statistical data of the dairy herd in China would aid in anticipating its development.
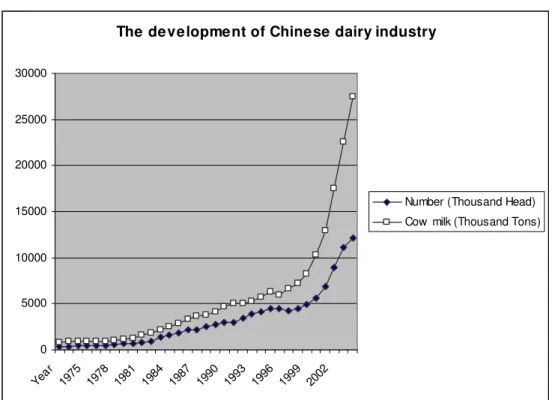
As stated by Fuller (2005), Fuller (2004), and Chi (1999), China’s dairy history has only really occurred since 1980 when dairy production was only 1 million tonnes for the whole country. At that time, the milk supply was limited to Metropolitan cities for older people and babies. However, after 1980, China’s dairy production increased dramatically. From 1980 to 2005, China’s dairy cattle population increased about 19 times and cow milk production increased about 24 times. The expansion of milk production resulted from both an increase of average milk yield and a larger dairy herd population. Fuller (2005) acknowledged that by far the most prominent source of growth of milk production in China has been the expansion in the dairy herd (Figure
Since the expansion of the Chinese dairy industry is mainly driven by dairy herd expansion, research about increasing dairy herd size becomes necessary to understand the Chinese dairy industry.
Figure 1: The development of the Chinese dairy industry
Source: China dairy yearbook 2005
The paper will initially document a brief review of cattle inventory research followed by a discussion regarding the methodology, and rationale and combination of an autoregressive distributed lag model and a dairy herd inventory model for China. Data problems will be addressed prior to presenting empirical results and discussion. Finally, the conclusion of the will provide suggestions for further research.
2. Previous research
As Schmitz (1997) stated, Jarvis is credited with the first application of capital goods theory to cattle replacement decisions. Jarvis’ theory is simply that cattle are
considered to be capital goods that are held by producers as long as their capital value in production exceeds their slaughter value. This theory has been applied to much
The development of Chinese dairy industry
0 5000 10000 15000 20000 25000 30000 Year 1975 1978 1981 1984 1987 1990 1993 1996 1999 2002
Number (Thousand Head) Cow milk (Thousand Tons)
research about cattle inventories over the last two decades, including Rucker et al. (1984), Chavas and Klemme (1986) and Schmitz(1997).
Jarvis (1969) investigated the elasticity of a number of independent variables using six different cattle categories in Argentina. From the elasticity, he discussed the influence of different independent variables on the six dependent variables. He argued that the econometric results were quite satisfactory due to the significance of the coefficients of the independent variables. However, it seems that he did not recognise the effect of the lagged distribution of the independent variables in the equations. When lagged variables are used in equations, the serial correlation must be examined closely. “If serial correlation is present, then the coefficients of the variables are misspecified” (Greene 2003, p. 253). So even though Jarvis’ (1969) results are consistent both in sign and magnitude with the previously developed theory, there are some questions surrounding them.
Following Jarvis, Chavas and Klemme (1986) analysed dairy herd composition and milk supply response in the U.S. dairy sector. In this research, they took both the biological information and economic environment into consideration and a large part of the theory is based on Jarvis’ research. Chavas and Klemme tried to find a
relationship between milk price, slaughter price and feed cost, and milk output. The assumption was that dairy cows of different age categories have different performance in term of milk yield, and farmers made their decision based on expectation of future profit. Through the maximisation of the present value of net return from the dairy herd, economic behaviour of dairy farmers was investigated in response to different economic environments. Further, they projected milk production and the milk supply elasticity in the short and intermediate term given stationary prices. One of the shortcomings of this approach is that it is less tolerant to limited information. Without a good database support like in the U.S., it is very hard to apply this approach to other countries, especially developing countries where the statistics are not as systematic.
As a component of cattle inventory research, Schmitz (1997) used a logistic function to discover cow culling possibilities. The number of cows culled was a function of interest rate, hay price, corn price and the Palmer Drought Severity Index. In this
Schmitz applied serial correlation tests. The cow replacement equation exhibited severe serial correlation. A correction was attempted using the Durbin procedure (Schmitz 1997), but because of the complexity of the cow equation, a rectification was not possible. The serial correlation made his discussion questionable as it was, based on the coefficients of the independent variables. However, he (Schmitz 1997, p.10)defended himself stating “generally strong t-values would suggest that this relationship has had a minimal impact on the results”. This argument was also
supported by the tracking ability of his model. But again, to apply Schmitz’s approach in other countries, researchers need a very systematic database.
The empirical results of the only projection of dairy herd development (Bin 2002) saw a difference of more than 19 per cent between the three-year projection ending in 2005 and the observed data. In Bin’s econometric model, the only independent variable used was time t and a cubic regression was selected to simulate and project the dependent variable ‘dairy cattle number’. The dairy herd projection by Chavas and Klemme (1986), and Jarvis (1969), revealed that further research on the development of the dairy herd is needed.
3. The Autoregressive distributed lag model
In agricultural production, the supply of agriculture products has charactertics of “late response” because of the cost of adjustment, and lagged attributes of investment, (Jiang et al. 2003). This means higher the cost of the adjustment, the later the response of the supply and thus the effect of agricultural phenomena can only be observed after a certain period. The partial adjustment model developed by Griliches has been widely used to examine the lagged behaviour in agricultural production. “Partial adjustment generates lagged dependent variables among the regressors” (Johnston 1984, p.349). The general form of this model is as follow
t t t t t Y Y Y Y − −1=θ( *− −1))+ν 0≤θ ≤1 (a1)
Where Yt*is the optimal behaviour and νtis the disturbance. Introducing a lag operator L into equation (a1), an alterative form is
− 1 ( θL)Yt =(1- θ) * t Y + νt. (a2) When Yt*=α+βXt (a3) producing (1−θL)Yt =α(1−θ)+β(1−θ)Xt +νt or Yt =α(1−θ)+θYt−1+β(1−θ)Xt +µt (a4)
Farmers are also considered to make their decisions based on their expected market situation. “Adaptive expectation is another lagged model in which expectations get updated each period on the basis of the latest information about the actual value of the variable” (Johnston 1984, p.349). The generalized form is as follows:
* t X - * 1 − t X = λ(Xt−1- * 1 − t X ) 0≤λ≤1 (a5)
Where Xt*is the expectation formed at the end of period t. Again if we introduce lag operator L, equation (a5) may reformulated as
1 − t X λ = [
]
* ) 1 ( 1− −λ L Xt (a6)If Yt=α+βXt* +µt and substituting (a6) in the equation, then we produce
=
t
Y α+βλ
[
Xt−1+(1−λ)Xt−2+(1−λ)Xt−3+⋅⋅⋅]
+µt (a7)In recognising that dairy herd development involves a dependent variable that is a combination of lagged dependent variables and lagged independent variables, a combination of the partial adjustment model and the adaptive expectations model needs to be applied to the simulation of the Chinese dairy herd. Combining equations (a4) and (a7), gives:
t q j j t j i t p i i t Y X Y =α+
∑
θ +∑
λ +ε = − − =1 0 (a8) in which εtis assumed to be serially uncorrelated and homoscedastic (Greene 2003, p.571). This form is the autoregressive distributed lag (ARDL) model. Thisassumption about the residualεt seems omitted by most of the research on cattle inventory simulation.
The autoregressive distributed lag model is particularly suitable for simulating and forecasting Chinese dairy herd development. The model takes both biological progress of the dairy herd and the influence of the actual economic environment into account. The lagged dependent variable is the dairy herd number, which is lagged one year. Its coefficient best describes the biological relationship with the dairy herd number in the previous year. Also, the lagged independent variables describe the sensitivity of dairy herd number to the economic factors. Unlike finite lag models and the geometric lag model which impose strong, possibly incorrect restrictions on the lagged response of the dependent variable to changes in an independent variable, an advantage of the ARDL model is its flexibility which provides a useful platform for studying a number of interesting methodological issues (Greene 2003, p.571).
4. The inventory model
The dependent variables used are the ratio of milk price to corn price, beef price and lagged dairy herd number. Hence, the form of inventory model is
) , , ( e t e t e t d t f Ratio Bp Cdhn Cdhn = where d t Cdhn
is the desired number of dairy cows in year t, e t Ratio
is a vector of the ratio of milk price to corn price,
e t
Bp is a vector of beef price and Cdhnteis a vector of lagged dairy herd numbers.
Milk price to corn price ratio represents the profitability of dairy production suggested by Jarvis (1969) and Chavas and Klemme (1986), which is expected to have a
significant positive influence on production per cow and cow numbers.
Beef price is the economic factor that determines the opportunity cost of keeping the cow in dairy production.
To take a close look at the composition of the Chinese dairy herd and to understand which variables influence different components of the composition, the following discussion that is largely borrowed from Jarvis (1969), was reviewed. The objective of this review is to explain the interaction among the different components of the Chinese dairy herd and further to investigate the relationship of each component to the biological and economic environments. This model could be a useful platform to further analyse a number of issues of the dairy herd when the relevant data are available. The main steps in the process outlined in the equations below are the identification of equations representing the biological processes linking dairy female calves, replacement heifers and dairy cows. The survival rate, replacement decisions and culling rate are influenced by improvements in technology and economic variables respectively. Through this examination, it is expected to explain how the biological processes and economic environment have influenced the Chinese dairy herd.
Consider the dairy herd population classified into categories xot, x1t,…, xjt where xotequals the number of offspring at year t and xjt is the number of cows of age j in year t, j is the maximum age for milk production and does not exceed the oldest age of a cow.
If we define λ
jas the reproduction rate of a j year old cow, then the number of offspring in year t is xot=
∑
= n j jt jx 0 λ (b1)With the assumption that a cow only gives birth to one offspring at a time, and that the earliest age a cow gives birth is 2 years old and the oldest service age is 14 years, then the number of offspring in year t in China is
xot=
∑
= 14 2 j jt jx λ (b1,)If the survival rate for the cattle from year t to year t+1 is kjt= jt t j x x+1,+1 (b2) then in year t, the number of the dairy cows of age j would be
xjt=
[
∏
]
= − − j i i t i j k 1 , xo,t−j (b3) Denoting θ rtas the probability that a given heifer is selected as a replacement, and assume almost 50 per cent of the offspring is female, then the number of the female calves used for replacement and expansion from the dairy herd in year t is
x1rt=0.5θ r t k0,t−1
∑
= − n J t j jx 1 1 , λ (b4) Since currently in China, almost every female offspring from the dairy herd goes to replacement then θ rt=100 per cent=1 and equation can be simplified to xr t 1 =0.5 k0,t−1
∑
= − n J t j jx 1 1 , λ (b4,)Moreover, with the development of technology in the dairy industry and with a probability that a replacement becomes necessary, it is expected θ r
t to change to less than one in the future in China. This will be discussed further in relation to model estimation.
Since the replacement heifers will produce their first calves at age two, λ
jis zero when j is less than two. If letting xc
jrepresent the number of cows of age j in the herd, the number of replacement heifers can be determined as:
xot=0.5 r t θ
∑
= − n j c t j x 2 1 , (b5)again, when θ r
tis one currently in China, the number of the replacement heifers is
xot=0.5 (b5,) Letting c
jt
π be the possibility that a cow is kept in next year’s retention which means another service year, then equation (3) can be used to indicate the number of cows of each age in the herd, as follows:
xc st=
∏
= − − s i c i t i s 1 , π xr s t− , 1 (b6)In the equation (6), S is denoted as the service year of a cow, then s=j-2. The total number of the cow (COWS) in service years in year t is as follows:
COWSt=
∑
= n s1 ⋅∏
= − − − s i r s t c i t i s x 1 , 1 , π (b7) where n is the maximum service year of dairy production.Then the number of the calves that are no more than one year old in year t is:
CALVES1t=0.5⋅k0,t−1COWSt−1 (b8) And the number of replacement heifers (REPLt) in year t is:
REPLt=0.5(k1,t−2⋅k0,t−1) COWSt−2 (b9)
Then the total Chinese Dairy Herd Number (CDHN) would be the summation of the cows in service and heifers that are no more than two years old plus calves.
CDHNt= COWSt+ REPLt+CALVESt (b10)
If the number of cows of different age is known, the dairy herd can be analysed from many perspectives with this inventory model. These issues include the identification of the number of each dairy categories in different age groups; analysis of the
investigation of the dynamics of the population of each dairy group under different economic situations.
5. Combination of the models
Combining the autoregressive distributed lag model (a8) and the Chinese dairy herd number equation (b10), each component of the Chinese dairy herd is examined as discussed.
5.1 Opportunity Cost
When a cow’s value as beef cattle exceeds the value as dairy cattle, a farmer will cull the cows for beef production; in other words, a farmer will prefer a lower retention rate of the herd. Many researchers have shown that beef price influences the value of dairy cattle, with the assumption that culled cows in China will not be fed and will be slaughtered straight after removal from the dairy herd. As another opportunity cost, the ratio of milk price to feed price influences the value the dairy cattle for dairy production.
5.2 Retention Rate
The number of cows in year t+1, COWSt+1, is determined by the retention rateπcjt
and the number of cows in year t. Consider a dairy farm having a certain number of cows in year t. To get optimal output next year, the farmer might adjust the retention rate to achieve this goal. As discussed in the paragraph above, the combination of beef price and the ratio of milk price and beef price have an impact on the retention rate. From equation a8, the lagged independent variables describe how the cow numbers are adjusted over time independently of these other variables.
5.3 Survival Rate
From equation (b8) and (b9), the survival rate and the number of the cows in the previous years determine the number of calves and heifers. With an assumption of
constant technology, the survival rate is constant and then the number of dairy cows in previous years has a dominating influence through biological relationship on the number of calves and heifers. With equation (a8), the lagged dependent variable describes the development of numbers of calves and heifers.
The above discussion shows, how the ARDL model interacts with the composition of the dairy cattle inventory, with part of equation (a8) being a result of biological relationships, and part being driven by lagged economic variables.
6. Data selection and limitations
Inconsistency in Chinese agricultural data is a consequence of erratic definitions of variables, changing collection methods and data inconsistency between organisations, government and researchers. Indeed, many researchers have critically discussed the quality of the data (Yuan et al. 2001; Longworth et al. 2001 and Jiang et al. 2003). This is particularly a problem for data in the Chinese livestock industry. It seems this problem arises from three reasons:
1. The transformation of China from a planned economy to a market economy. 2. The logistics of collecting information from 9 billion farmers in a country area
of 9.6 million square kilometres with the tradition of small backyard livestock production.
3. The oversight of useful detailed data in previous censuses.
While all, three of these factors have affected the information used in the current study, it is China’s transition to a market economy that has hampered this research the most. The last twenty years has seen considerable price reform in China. There has been a transformation from a situation in which prices and quantities supplied were highly regulated under the planned system. This was followed by a gradual
readjustment of prices, followed by the policy of opening up. “The combined effect of these factors gradually brought domestic prices in line with international market prices” (Zhou 1999, p.2). To be more confident with the data, data information collected before 1993 has been excluded. During 1993 the price system was opened
data used in this study effectively starts from 1995. Obviously, the longer the data set, the more information that can be provided. However, if this information is
inconsistent over time, the estimated coefficients described by the relationship between dependent variables and independent variables can be biased. A good example is milk price. Cheng (2001, p.14) pointed out that “since 1993, planned feed supplies with fixed prices were cancelled. This caused a great increase in dairy production”. In other words, there has been with a significant change in the structure of the dairy industry in China since the early 1990s, and the data have been more consistent since then.
Another major problem encountered in this study was the definition of dairy herd number. Unlike other countries, China does not have statistics on the number of milk cows separate from heifers and calves, or the average yield of each cow which might be a proxy to calculate cow numbers considering the available amount of total milk production. This does not allow the authors to complete any further analysis such as discussed in chapter 5. The only available statistics on dairy herd inventory in China are the sum of calves, heifers and cows as a whole and there is no clear figure of the proportion of each category. This forced the study to analyse the dairy herd as a whole. The short run of years of statistics of the dairy herd inventory in China is mainly due to the short history of dairy production in China as discussed before. Within this system female dairy calves are considered to be a scare resource and generally go directly into future dairy production.
In this study, milk price and beef price are derived from the Chinese Agriculture Products Input-Output Yearbook. Corn price is the wholesale price of number two grade yellow corn, which also used by Rucker et al. (1984).
The choice of data from the Chinese Agriculture Products Input-Output Yearbook is because it is the only farm-level yearbook which has good consistency. Milk price is the price of milk sold from dairy farms for processing, and beef price is the price of cattle sold liveweight.
7. Implication of the Estimation
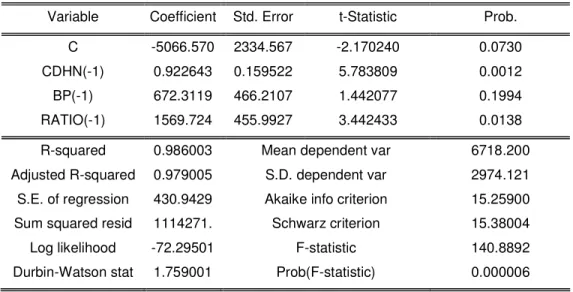
Using Eviews 4.0, we estimated the inventory model of the development of the Chinese dairy herd. The lags chosen for the three variables are based on estimations of different mix of various lags for different variables. The variable which has one lag is most appropriate and has statistical significance. The results are reported in Table 1.
Table 1. Model of the development of Chinese dairy herd number
Dependent Variable: CDHN Method: Least Squares Sample(adjusted): 1996 2005
Included observations: 10 after adjusting endpoints
Variable Coefficient Std. Error t-Statistic Prob.
C -5066.570 2334.567 -2.170240 0.0730
CDHN(-1) 0.922643 0.159522 5.783809 0.0012
BP(-1) 672.3119 466.2107 1.442077 0.1994
RATIO(-1) 1569.724 455.9927 3.442433 0.0138
R-squared 0.986003 Mean dependent var 6718.200
Adjusted R-squared 0.979005 S.D. dependent var 2974.121
S.E. of regression 430.9429 Akaike info criterion 15.25900
Sum squared resid 1114271. Schwarz criterion 15.38004
Log likelihood -72.29501 F-statistic 140.8892
Durbin-Watson stat 1.759001 Prob(F-statistic) 0.000006
7.1. Beef price
From the above estimation, the lagged beef price is not a significant variable. Chavas and Klemme (1986) argue that although slaughter price does not have much influence on dairy supply for the first few years, its long-run impact on milk production is negative, suggesting that meat and milk production are long-run substitutes on dairy farms. If this argument applies to the Chinese dairy supply, it means beef output as an opportunity cost of dairy production is low. At the present time, it would seem that a positive relationship between beef price and dairy herd numbers, as in the results, would seem reasonable at this early stage of development of dairy-beef production.
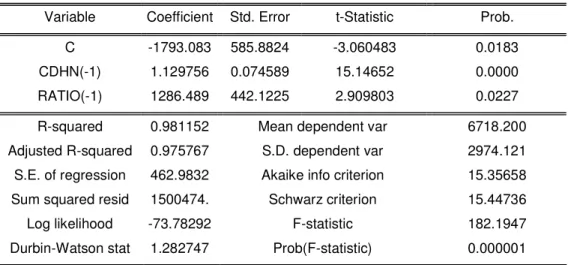
Since beef price is not a significant factor to the development of the dairy herd in China, we adjusted the estimating equation and the results are reported in Table 2: Table 2. Adjusted model of the development of Chinese dairy herd number
Dependent Variable: CDHN Method: Least Squares Sample(adjusted): 1996 2005
Included observations: 10 after adjusting endpoints
Variable Coefficient Std. Error t-Statistic Prob.
C -1793.083 585.8824 -3.060483 0.0183
CDHN(-1) 1.129756 0.074589 15.14652 0.0000
RATIO(-1) 1286.489 442.1225 2.909803 0.0227
R-squared 0.981152 Mean dependent var 6718.200
Adjusted R-squared 0.975767 S.D. dependent var 2974.121
S.E. of regression 462.9832 Akaike info criterion 15.35658
Sum squared resid 1500474. Schwarz criterion 15.44736
Log likelihood -73.78292 F-statistic 182.1947
Durbin-Watson stat 1.282747 Prob(F-statistic) 0.000001
7.2. Autocorrelation and cointegration test
In the adjusted model, all variables are significantly different from zero at the 5 per cent level and the explanatory power as measured by the adjusted R-squared is still high. However, we suspected that autocorrelation existed in the estimation because of the nature of the time series data. As discussed by Greene (2003, p. 270), Judge et al. (1988, p. 401), “with the presence of lagged dependent variables, the Durbin-Watson test is not likely to be valid”. In these circumstances they recommended the Durbin’s h test, LM test and Box-Pierce test as alternatives. As explained by Judge et al. (1988, p. 402) “the power of Durbin’s h-test can be quite low and its finite sample properties can often be quite different from its asymptotic properties. It should therefore be used with caution, particularly in small samples”. Greene (2003) supports the use of LM and Box-Pierce statistics because they do not share these shortcomings. The LM test has become the standard method in applied research. Consequently, we performed the LM test with 2 lags included, and the result is presented in Table 3:
Table 3. LM test
Breusch-Godfrey Serial Correlation LM Test:
F-statistic 5.579033 Probability 0.053266
Obs*R-squared 6.905570 Probability 0.031657
From the test result, there is correlation of the residuals, suggesting the presence of autocorrelation. However, even in these circumstances, Schmitz (1997), in cattle inventory estimation, argued that generally strong t-values would suggest that the serial correlation has had a minimal impact on the results. Our results portray similar characteristics and even in the presence of autocorrelation they seem defensible especially when used in a predictive manner.
The authors also tried to develop an Error Correction Model (ECM) to reveal the short to long term equilibrium relationship of the variables if there is a structural change. However the Johansen test suggested cointegration does not exist between the ratio and CDHN.
Table 4. Cointegration test
Hypothesized Trace 5 Percent 1 Percent
No. of CE(s) Eigenvalue Statistic Critical Value Critical Value
None ** 0.965663 30.83915 15.41 20.04
At most 1 0.053559 0.495424 3.76 6.65
*(**) denotes rejection of the hypothesis at the 5%(1%) level
Trace test indicates 1 cointegrating equation(s) at both 5% and 1% levels
7.3. Biological process of the Chinese dairy herd
We are comfortable with the adjusted estimation of the development of the Chinese dairy herd since it traced history well. It is appropriate to analyse the estimated relationship more closely.
The coefficient of the lagged dependent variable is almost 1.13. This indicates a 13 per cent increase per year in the size of the dairy herd. Considering each year, the new born calves enter the herd and there are losses and culled cows moving out the herd, it is not difficult to understand the 13 per cent increase. Further explanation from Li (2002) is: Given that cows number 60 per cent of the dairy herd, 70 per cent of the cows produce a calf each year, the sex ratio 50 per cent, the survival rate of calves is 95 per cent, and the culling rate is 10 per cent, this gives us another estimate of the expansion rate of the Chinese dairy herd:
0.6*0.7*0.5*0.95-0.6*0.1=0.1395
This is close to the biological coefficient we obtained from the adjusted estimation. It would be expected that in future, as farmers strive to improve the performance of their livestock, the culling rate will increase and then the expansion of the Chinese dairy herd will slow down. This expectation complies with the development of the dairy herd in the developed countries that when average milk yields increase the number of dairy cows increases more slowly and eventually decreases.
7. 4. The ratio of milk and corn price
The number of the dairy cows in China was positively related to the ratio of the milk to corn price. A 10 per cent increase of the ratio would lead to an increase of almost 0.13 million head. This accounts for only 12 per cent of the increase in numbers from 2004 to 2005. This low elasticity might be explained by large adjustment cost in Chinese dairy herd production. The cost of buildings, machinery and livestock make it difficult for a dairy farm to enter or exit production. Also as described by Chavas and Klemme (1986), the significance of the price ratio suggests that in making decisions with respect to culling and other livestock issues, price expectations are formed on the basis of previous observations.
The relationship of the price ratio to dairy cow numbers indicates that if the milk price increases, farmers tend to increase retention, and a higher corn price, which is a proxy for feed cost, will decrease the number of the dairy cows.
8. Projection of the dairy herd number
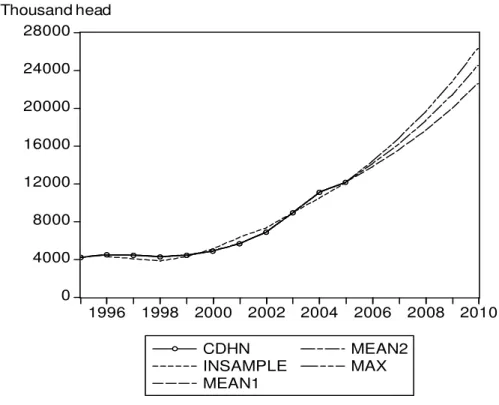
The adjusted estimated model was used to simulate dairy cow numbers over time for given values of the ratio of milk to corn price. Within-sample and out-of-sample predictions for the development of the dairy herd are reported in Figure 2. Figure 2. Predicted Chinese dairy herd development in thousand head
0 4000 8000 12000 16000 20000 24000 28000 1996 1998 2000 2002 2004 2006 2008 2010 CDHN INSAMPLE MEAN1 MEAN2 MAX Thousand head
The within-sample prediction shows that the model tracked history quite well. The out-of-sample predictions are based on a particular level of the milk to corn price ratio. In the projection, this was assumed to be stationary on three levels. In Figure 2,
CDCN is the actual value of the dairy herd number, Insample is the simulation within sample and Max is a projection using the maximum value of the ratio between milk price and corn price. This was highest in the year 2000. MEAN1 is a projection using the mean of the milk price to corn ratio over the whole sample period and MEAN 2 is an equivalent projection using the mean ratio over the period 1998 to 2005.
Among the three predictions, probably the forecasted value under MEAN 2 would be the closest to the expected size of Chinese dairy herd, since in the year 1996 and 1997, milk powder was imported in large quantities into China, and consequently milk price was unusually depressed. Under MEAN 2, the Chinese dairy herd will double in size between 2005 and 2010 and reach 24 million. This predication is in line with the track of the historical development of the Chinese dairy herd. From 1995 to 2005, the size of the dairy herd increased four times, suggesting a doubling about every five years. Projecting in the presence of autocorrelation, large confidence intervals are expected. The confidence intervals of the three projected scenarios MEAN 1, MAX and MEAN 2 are presented as follows.
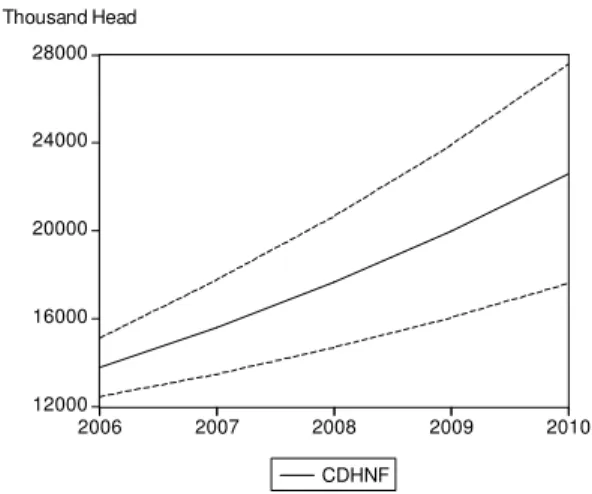
Figure 3. Confidence Interval under Scenario MEAN1
12000 16000 20000 24000 28000 2006 2007 2008 2009 2010 CDHNF Thousand Head
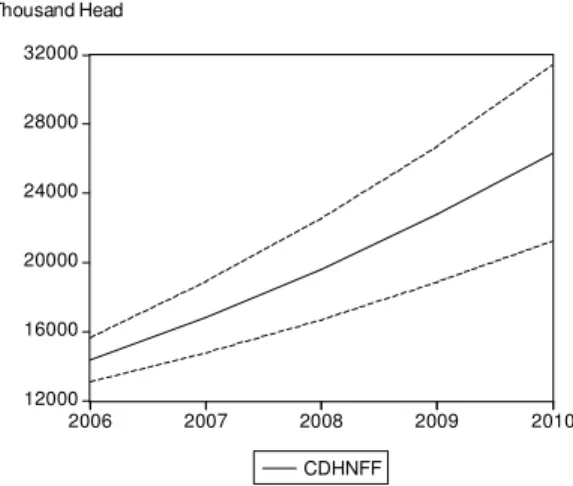
12000 16000 20000 24000 28000 32000 2006 2007 2008 2009 2010 CDHNFF Thousand Head
Figure 5. Confidence Interval under Scenario MEAN 2
12000 16000 20000 24000 28000 32000 2006 2007 2008 2009 2010 CDHNFFF Thousand Head
These confidence intervals are fairly wide by the time we reach the final year of the projection. However, even under extreme circumstances the herd size would as a minimum reach 16 million from the level of 12 million in 2005.
9. Conclusion and Suggestions
Both biological and economic factors driving dairy herd development in a relatively new market economy are analysed. Biological analysis suggests that a low culling rate and high retention rate exists in the Chinese dairy industry. The major economic influence is the ratio of milk price to corn price. The weak effect that this ratio had on explaining cow numbers indicates that farmers have positive expectations in the long term towards the Chinese dairy industry and this also shows the high adjustment cost in dairy production in China. Beef price as another important factor to dairy cow
numbers in the U.S. has weak power in Chinese dairy production. All of the three phenomena: high retention rate, minor response to the economic environment and weak power of alternative product prices, suggests that the Chinese dairy industry is still at an early stage of the development.
Due to the limited consistency and reliability of the statistical data, this study is restricted to a short-time span of analysis and projection. Also, data limitations prevent the examination of more interesting issues. However, as time proceeds, more detailed and consistent Chinese statistics will be produced enabling researchers to analyse a number of interesting topics such as the composition of the dairy herd and the contribution of technology improvement in this industry with the dairy inventory model developed in this paper. This would enable the examination of the efficiency of technology promotion and consequently, make suggestions for a better system of promoting the production technology, which the authors consider a more important step in China than research to discover better technology itself.
It has been observed that the development of dairy production in developing countries often follows a logistic curve, with break points as new technology is introduced. This suggests that attempting to predict the timing of new technology in Chinese dairy production would be useful.
Also, as an input into beef production, the portion of male calves from the dairy herd is worthy of closer examination. However, once again it seems probable that new technologies such as embryo transfer will enable more rapid animal improvement in both beef and dairy industries, and this will impact on the expansion of cattle numbers.
References
Chavas, J. and Klemme, M.R. (1986). Aggregate Milk Supply Response and Investment Behavior on U.S. Dairy Farms, American Journal of Agricultural Economics 68, 55-66.
Cheng, G. Q. (2001). Economic Effect on China’s Dairy industry of Implementation of WTO Rules, China Economic Publishing House, Bei Jing.
Chi, G. Z. (1999). Wo Guo Nai Ye de Shi Chang Hua Jin Cheng Ji Mian Lin de Jue Ze, Chinese Rural Economy 1, 46-52.
Dong, F. The outlook for Asian Dairy Markets: The Role of Demographics, Income, and Prices, Food Policy (forthcoming).
Fuller, F., J. Beghin, and S.Rozelle. (2004). Urban Demand for Dairy Products: Evidence from New Survey Data, CARD Working Paper 04-WO 380. Center for Agricultural and Rural Development, Iowa State University. November.
Fuller, F., and D. Hu. (2005). Dairy Products in Southwestern China: anecdotal Evidence from Kunming, Paper presented at the WERA-101 Annual Meeting, 24-25 April 2005, Reno, Nevada.
Glosser, S. (1999). Milk for Health, Milk for Profit: Shanghai’s Dairy Industry under Japanese Occupation, In Inventing Nanjing Road: Commercial Culture in Shanghai, 1900-1945, Edited by S. Xochran. Ithaca, NY: East Asia Program, Cornell University.
Greene, H. W. (2003). Econometrics Analysis, 5th Edition, Prentice Hall, New Jersey.
Griffin, M. (2004). Issue in the Development of School Milk, Paper presented at School Milk Workshop, Food and Agriculture Organization, Intergovernmental Group on Meat and Dairy Products, 17-19 June 2004, Winnipeg, Canada.
Guo, X., T. Mroz, and B. Popkin. (2000). Structural Change in the Impact of Income on Food Consumption in China, 1989-1993, Economic Development and Cultural Change, 48, 737-760.
Hu, D., F. Fuller, and T. Reardon. (2004). The Impact of the Rapid Development of Supermarkets on the Dairy Industry in China, Chinese Rural Economy 7, 12-18.
480-520.
Jiang N. H., Xin X. and Yi. J. (2003). Zhong Guo Xu Chan pin Gong Ji Xu Qiu Yu Mao Yi Xing Wei Yan Jiu, China Agriculture Press, Bei Jing.
Johnston, J. (1984). Econometric Methods, 3rd Edition, McGraw-Hill, Inc., Singapore
Judge, G.G. Hill, R.C. and Griffiths, W. E., Lutkepohl, H. and Lee, T.C. (1988). Introduction To The Theory and Practice of Econometrics, 2nd Edition, John Wiley & Sons. Inc., Canada.
Li, Sh. L. (2002). Shi Lun Zhong Guo Nai Ye de Ke Chi Xu Fa Zhan, Available from URL: http://gzc.neau.cn/sth/niuwang/go.asp?id=744 [accessed 6 Sept 2006].
Liu, K.E., and W.S.Chen. (2003). Food Demand in Urban China: An Application of a Multi-Stage Censored Demand System, Paper presented at American Agricultural Economic Association Annual Meeting, 27-30 July 2003, Montreal, Canada.
Longworth et al. (2001). Beef in China: agribusiness opportunities and challenges, University of Queensland Press, St.Lucia.
Rucker, R.R., Burt, R.O. and LaFrance, T.J. (1984). An Econometric Model of Cattle Inventories, American Journal of Agricultural Economics 66, 131-144.
Schmitz D. J. (1997). Dynamics of Beef Cow Herd Size: An Inventory Approach, American Journal of Agricultural Economics 79, 532-542.
Wang. B. (2002). Qian Xi Wo Guo Ru Zhi Pin Shi Chang, Available from URL; http://www.emarketing.net.cn/theory/Readview.asp?id=151 [accessed 27 Sept 2006]
Yuan et al. (2001). Zhong Guo Xu Chan Pin Sheng Chan Tong Ji Su Ju Bei Gao Gu Le Mang? , Chinese Rural Economy 1, 48-54.
Zhou, Z. Y. (1999). A General Review of China’s Reform in Economic System and its Prospect, Chinese Economy. The university of Sydney, Orange, pp.1-10.