Unconstrained Remote Sensing Imagery
Seyed Majid Azimi1,2∗[0000−0002−6084−2272], Eleonora Vig1[0000−0002−7015−6874],
Reza Bahmanyar1[0000−0002−6999−714X], Marco K¨orner2[0000−0002−9186−4175],
and Peter Reinartz1[0000−0002−8122−1475]
1 German Aerospace Center, Remote Sensing Technology Institute, Germany 2
Technical University of Munich, Chair of Remote Sensing, Munich, Germany *Corresponding author:[email protected]
Abstract. Automatic multi-class object detection in remote sensing im-ages in unconstrained scenarios is of high interest for several applications including traffic monitoring and disaster management. The huge varia-tion in object scale, orientavaria-tion, category, and complex backgrounds, as well as the different camera sensors pose great challenges for current algo-rithms. In this work, we propose a new method consisting of a novel joint image cascade and feature pyramid network with multi-size convolution kernels to extract multi-scale strong and weak semantic features. These features are fed into rotation-based region proposal and region of interest networks to produce object detections. Finally, rotational non-maximum suppression is applied to remove redundant detections. During training, we minimize joint horizontal and oriented bounding box loss functions, as well as a novel loss that enforces oriented boxes to be rectangular. Our method achieves 68.16% mAP on horizontal and 72.45% mAP on oriented bounding box detection tasks on the challenging DOTA dataset, outperforming all published methods by a large margin (+6% and +12% absolute improvement, respectively). Furthermore, it generalizes to two other datasets, NWPU VHR-10 and UCAS-AOD, and achieves competi-tive results with the baselines even when trained on DOTA. Our method can be deployed in multi-class object detection applications, regardless of the image and object scales and orientations, making it a great choice for unconstrained aerial and satellite imagery.
Keywords: Object detection·Remote sensing·CNN.
1
Introduction
The recent advances inremote sensing (RS)technologies have eased the acqui-sition of very high-resolution multi-spectral satellite and aerial images. Auto-matic RS data analysis can provide an insightful understanding over large areas in a short time. In this analysis, multi-class object detection (e.g., vehicles, ships, airplanes, etc.) plays a major role. It is a key component of many applications such as traffic monitoring, parking lot utilization, disaster management, urban management, search and rescue missions, maritime traffic monitoring and so on.
Object detection in RS images is a big challenge as the images can be acquired with different modalities (e.g., panchromatic, multi- and hyper-spectral, and Radar) with a wide range of ground sampling distance (GSD) e.g., from 10 cm to 30 m. Furthermore, the objects can largely vary in scale, size, and orientation. In recent years, deep learning methods have achieved promising object detection results for ground imagery and outperformed traditional methods. Among them, deep convolutional neural networks (DCNNs) have been widely used [10, 13, 26]. In the RS domain, newly introduced large-scale multi-class im-age datasets such as DOTA [30] have provided the opportunity to leverim-age the applications of deep learning methods. The majority of current deep learning-based methods detect objects learning-based onhorizontal bounding boxes (HBBs), which are appropriate for ground-level images. However, in the RS scenarios, objects can be arbitrarily oriented. Therefore, utilizingoriented bounding boxes (OBBs)
is highly recommended, especially when multiple objects are located tightly close to each other (e.g., cars in parking lots).
Region-based convolutional neural networks (RCNNs) such as (Fast(er))-RCNN [8, 23, 24] and Mask- (Fast(er))-RCNN [9] have achieved state-of-the-art object detection results in large-scale ground imagery datasets [6, 15]. Fast- RCNN [24] improves the detection accuracy of RCNN [8] by using a multi-task loss function for the simultaneous region proposal regression and classification tasks. As an im-provement, Faster-RCNN integrates an end-to-end trainable network, called re-gion proposal network (RPN), to learn the region proposals for increasing the localization accuracy of Fast- RCNN. To further improve Faster-RCNN, one could perform multi-scale training and testing to learn feature maps in multiple levels; however, this will increase the memory usage and inference time.
Another alternative is image or feature pyramids [7, 12, 14, 20, 21, 31]. Re-cently, Lin et al. [14] proposed thefeature pyramid network (FPN)which extracts feature maps through a feature pyramid, thus facilitating object detection in dif-ferent scales, at a marginal extra cost. Although joint image and feature pyramids may further improve results, this is avoided due to its computation cost.
Object detection in RS images has been investigated by a number of works in the recent years. The majority of the proposed algorithms focus on object detection with a small number of classes and a limited range of GSDs. Liu and Mattyus [16] proposedhistogram of oriented gradients (HOG) features and the AdaBoost method for feature classification to detect multi-class oriented vehi-cles. Although this approach achieves a fast inference time, it does not have high detection accuracy as it lacks high-level feature extraction. Sommer et al. [27] and Tang et al. [29] proposed RCNN-based methods using hard-negative min-ing together with concatenated and deconvolutional feature maps. They showed that these methods achieve high accuracies in single-class vehicle detection in aerial images for HBBs task. Liu et al. [17] proposed rotated region proposals to predict object orientation usingsingle shot detector (SSD)[18] improving the localization of the OBBs task. Yang et al. [32] improved [17] by integrating FPNs. In this paper, we focus on improving the object localization of region-based methods applied to aerial and satellite images. We propose a new end-to-end
CNN to address the aforementioned challenges of multi-class object detection in RS images. The proposed method is able to handle images with a wide range of scales, aspect ratios, GSDs, and complex backgrounds. In addition, our proposed method achieves accurate object localization by using OBBs. More specifically, the method is composed of the following consecutive modules:image cascade net-work (ICN), deformable inception network (DIN), FPN,multi-scale rotational region-proposal network (R-RPN),multi-scale rotational region of interest net-work (R-ROI), and rotational non-maximum suppression (R-NMS). The main contributions of our work are the following:
– We propose a new joint image cascade and feature pyramid network (ICN and FPN) which allows extracting information on a wide range of scales and significantly improves the detection results.
– We design a DIN module as a domain adaptation module for adapting the pre-trained networks to the RS domain using deformable convolutions and multi-size convolution kernels.
– We propose a new loss function to enforce the detection coordinates, forming quadrilaterals, to shape rectangles by constraining the angles between the edges to be 90 degrees. This augments object localization.
– We achieve significant improvements on three challenging datasets in com-parison with the state of the art.
In addition, we employ rotational region proposals to capture object locations more accurately in RS images. Finally, in order to select the best localized re-gions and to remove redundant detections, we apply R-NMS which is the rota-tional variant of the convenrota-tional NMS. Furthermore, we initialize anchor sizes in R-RPNs with clustered data from rotated ground truth bounding boxes pro-posed by Redmon and Farhadi [22] rather than manual initialization used in Faster-RCNN. In order to evaluate the proposed method, we applied it to the DOTA [30] dataset, a recent large-scale satellite and aerial image dataset, as well as the UCAS-AOD and NWPU VHR-10 datasets. Results show that the proposed method achieves a significantly higher accuracy in comparison with state-of-the-art object detection methods.
2
Proposed Method
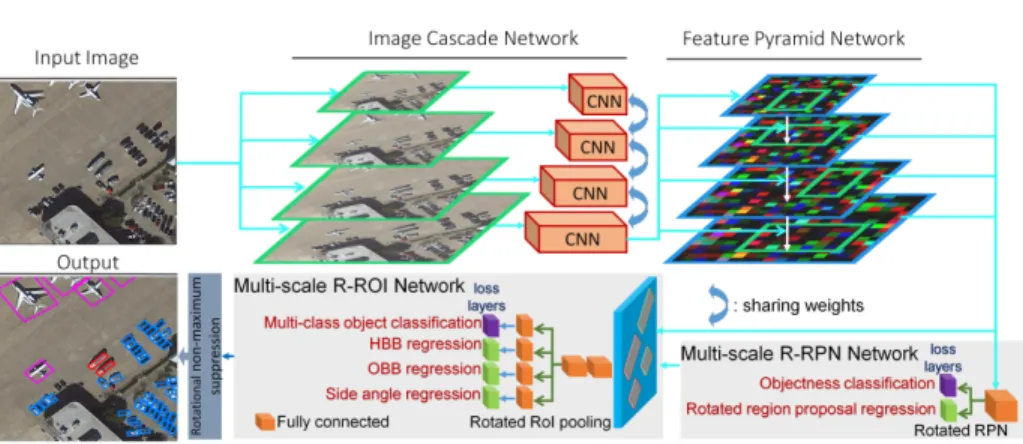
Figure 1 gives a high-level overview of our joint horizontal and oriented bounding box prediction pipeline for multi-class object detection. Given an input image, combined image cascade and feature pyramid networks (ICN and FPN) ex-tract rich semantic feature maps tuned for objects of substantially varying sizes. Following the feature extraction, a R-RPN returns category-agnostic rotated regions, which are then classified and regressed to bounding-box locations with a ROI. During training, we minimize a multi-task loss both for RPN and R-ROI. To obtain rectangular predictions, we further refine the output quadrilater-als by computing their minimum bounding rectangles. Finally, R-NMS is applied as a post-processing.
Fig. 1: Overview of our algorithm for (non-)rotated multi-class object detection.
2.1 Image Cascade, Feature Pyramid, and Deformable Inception Subnetworks
In order to extract strong semantic information from different scales, this work aims at leveraging the pyramidal feature hierarchy ofconvolutional neural net-works (CNNs). Until recently, feature extraction was typically performed on a single scale [23]. Lately, however, multi-scale approaches became feasible through FPN [14]. As argued in [14], the use of pyramids both at the image and the feature level is computationally prohibitive. Nevertheless, here we show that by an appropriate weight sharing, the combination of ICN (Figure 2) and FPN (Figure 3) becomes feasible and outputs proportionally-sized features at differ-ent levels/scales in a fully-convolutional manner. This pipeline is independdiffer-ent of the backbone CNN (e.g., AlexNet [13], VGG [26], or ResNet [10]). Here, we use ResNet [10]. In theICN, as illustrated in Figure 2, we use ResNet to compute a feature hierarchy C1, C2, C3, C4, C5, which correspond to the outputs of the
residual blocks: conv1, conv2, conv3, conv4, and conv5 (blue boxes in Figure 2). The pixel strides for different residual boxes are 2, 4, 8, 16, and 32 pixels with respect to the input image.
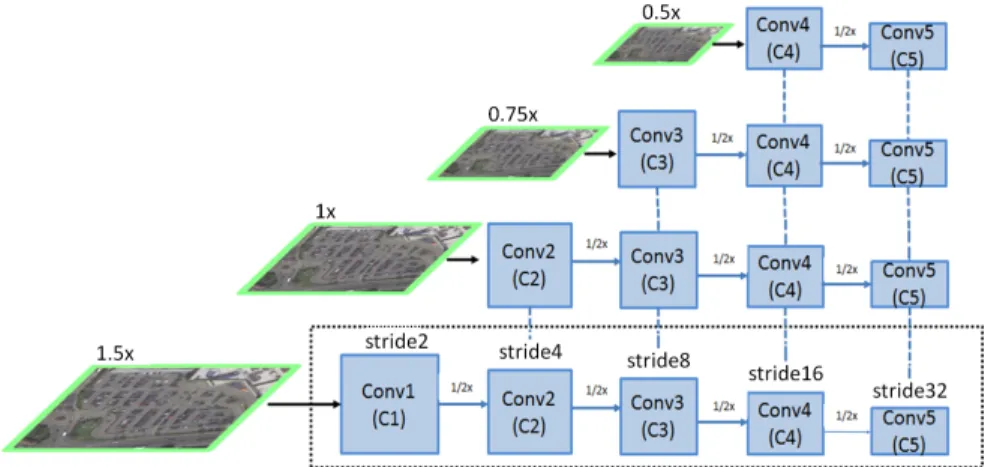
To build our image cascade network, we resize the input image by bilinear in-terpolation to obtain four scaled versions (1.5×,1×,0.75×,0.5×) and extract the feature hierarchy using ResNet subnetworks. For example, while all five residual blocks are used for the upsampled input (1.5×), for the half-resolution version (0.5×), onlyC4andC5are used. The cascade network is thus composed of
differ-ent subnetworks of the ResNet sharing their weights with each other. Therefore, apart from resizing the input image, this step does not add further computa-tion costs with respect to the single resolucomputa-tion baseline. ICN allows combining the low-level semantic features form higher resolutions (used for detecting small objects) with the high-level semantic features from low resolutions (used for de-tecting large objects). This helps the network to handle RS images with a wide range of GSD. A similar definition of ICN was proposed for real-time
seman-Fig. 2: Illustration of the Image Cascade Network (ICN). Input images are first up- and down-sampled. Then they are fed into different CNN cascade levels.
tic segmentation in [33], but without taking into account different scales in the feature domain and using a cascaded label for each level to compensate for the sub-sampling. Such a cascaded label is more suitable for semantic segmentation. FPNs [14] allow extracting features at different scales by combining the semantically strong features (from the top of the pyramid) with the semantically weaker ones (from the bottom) via a top-down pathway and lateral connections (cf. Figure 3). The original bottom-up pathway of FPN (i.e., the feed-forward computation of the backbone CNN) is here replaced with the feature hierarchy extraction of ICN, more specifically with the output of their residual blocksCi,
i ∈ {1,2,3,4,5}. The top-down pathway upsamples coarse-resolution feature maps (Mi) by a factor of 2 and merges them with the corresponding bottom-up maps Ci−1 (i.e., the lateral connections). The final set of feature maps Pi,
i∈ {1,2,3,4,5}, is obtained by appending 3×3 convolutions toMito reduce the aliasing effect of upsampling. We refer the reader to the work of Lin et al. [14] for more details on FPNs. In the original FPN, the output of eachCigoes through a 1×1 convolution to reduce the number of feature maps inMi. Here, we replace the 1×1 convolution with aDIN(Deformable Inception Network, cf. Figure 3) to enhance the localization properties of CNNs, especially for small objects which are ubiquitous in RS datasets. Although Inception modules [28] have shown promising results in various tasks such as object recognition, their effectiveness for detection has not been extensively studied. While most current state-of-the-art methods, such as Faster-RCNN, R-FCN [3], YOLOv3 [22], and SSD [18], focus on increasing the network depth, the benefit of Inception blocks lies in capturing details at varied scales which is highly desirable for RS imagery.
Deformable networks aim at overcoming the limitations of CNNs in modeling geometric transformations due to their fixed-size convolution kernels. When ap-plying the models pretrained on ground imagery (such as our ResNet backbone)
Fig. 3: Illustration of the ICN and FPN subnetworks with deformable inception network (DIN). DIN is the modified Inception block to learn features of objects including geometrical features in flexible kernel sizes with stride 1. “defconv” stands for deformable convolution.
to RS images, the parameters of traditional convolution layers cannot adapt effectively to the new views of objects leading to degradations in localization performance. Using deformable convolutions in DIN helps accommodating such geometric transformations [4]. Furthermore, the offset regression property of de-formable convolution layers helps localizing the objects even outside the kernel range. Here, we train the added offset layer from scratch to let the network ad-just to the new domain. 1×1 convolution layers reduce dimensions by half for the next deformable convolution (def-conv) layers. The channel input to DIN is divided equally among the four DIN branches. In our experiments, we did not observe an improvement by using 5×5 def-conv layers, hence the use of 3×3 layers.
2.2 Rotation Region Proposal Network (R-RPN)
The output of each Pi block in the FPN module is processed by multi-scale rotated region proposal networks (R-RPN) in order to provide rotated propos-als, inspired by [19]. More precisely, we modify RPN to propose rotated regions with 0, 45, 90, and 135 degrees rotation, not differentiating between the front and back of objects. For initializing the anchors, we cluster the scales and as-pect ratios using K-means++ with the intersection over union (IoU) distance metric [22]. We assign anchors with four different orientations to each level, P2
throughP63. As in the original RPN, the output feature maps of FPN go through
a 3×3 convolutional layer, followed by two parallel 1×1 fully-connected lay-ers: an objectness classification layer (obj) and a box-regression layer (reg) (cf. Figure 1). For training, we assign labels to the anchors based on their IoUs with
3
P6 is a stride 2 sub-sampling ofP5 used to propose regions for large objects.P1 is
the ground-truth bounding boxes. In contrast to the traditional RPN, we use the smoothl1loss to regress the four corners (xi, yi),i∈ {1,2,3,4}, of the OBB instead of the center point (x, y), and size (w andh) of the HBB. In this case, (x1, y1) indicates the front of objects which allows to infer their orientations. As
in Faster-RCNN, we minimize the multi-task loss
L({pi},{ti}) = 1 Nobj X i Lobj(pi, p∗i) +λ 1 Nreg X i p∗iLreg(ti, t∗i) , (1)
where, for an anchor i in a mini-batch, pi is its predicted probability of being an object andp∗i is its ground-truth binary label. For classification (object/not-object), the log-lossLobj(pi, p∗i) =−p∗ilogpiis used, while we employ the smooth
l1loss
Lreg(ti, t∗i) =l1smooth(ti−t∗i) withlsmooth1 (x) =
(
0.5x2 if|x|<1 |x| −0.5 otherwise (2) for the bounding box regression. Here,
txi= (xi−xi,a)/wa, tyi= (yi−yi,a)/ha (3)
t∗xi= (x∗i −xi,a)/wa, t∗yi= (y ∗
i −yi,a)/ha (4) are the four parameterized coordinates of the predicted and ground-truth an-chors with xi, xi,a, and x∗i denoting the predicted, anchor, and ground-truth, respectively (the same goes fory); andwa andhaare width and height of the an-chor.Nobj andNreg are normalizing hyper-parameters (the mini-batch size and number of anchor locations); and λ is the balancing hyper-parameter between the two losses which is set to 10.
2.3 Rotated Region of Interest Network (R-ROI)
Similar to [14], we use a multi-scale ROI pooling layer to process the regions proposed by R-RPN. Because the generated proposals are rotated, we rotate them to be axis-aligned. The resulting fixed-length feature vectors are fed into sequential fully-connected (fc) layers, and are finally sent through four sibling
fc layers, which – for each object proposal – output the class prediction, refined HBB and OBB positions, as well as the angles of OBBs.
As seen for R-RPNs, OBBs are not restricted to be rectangular: R-RPN predicts the four corners of quadrilaterals without any constraint on the corners or edges. However, we observed that annotators tend to label rotated objects in RS images with quadrilaterals that are close to rotated rectangles. In order to enforce a rectangular shape of OBBs, we propose a new loss that considers the angles between adjacent edges,i.e., we penalize angles that are not 90◦.
Let us considerPij a quadrilateral side connecting the cornersitoj, where
i, j ∈ {1,2,3,4} andi 6=j. Then, using the cosine rule, we calculate the angle between adjacent sides (e.g.,θ1 betweenP12 andP13) as:
where |Pij| is the length of the sidePij. There are multiple ways to constrain
θl, l∈ {1,2,3}to be right angles. (Note thatθ4can be computed from the other
three angles). We experimented with the following three angle-losses:
Tangent L1 :Langle−OBB(θ) = 3 X l=1 (|tan(θl−90)|) Smooth L1 :Langle−OBB(θ) = 3 X l=1 smoothL1(|θl−90|) L2 :Langle−OBB(θ) = 3 X l=1 k(θl−90)k 2 . (6)
Our final loss function is a multi-task loss composed of four losses that simultane-ously predict the object category (Lcls), regress both HBB and OBB coordinates (Lloc−HBB andLloc−OBB), and enforce OBBs to be rectangular (Langle−OBB):
L(p, u, tu, v) =Lcls(p, u) +λ[u≥1]Lloc−HBB(tu, v)+
λ[u≥1]Lloc−OBB(tu, v) +λ[u≥1]Langle−OBB(θ) ,
(7)
where Lcls(p, u) =−ulogpandLloc−OBB(tu, v) is defined similar toLreg as in R-RPN above. uis the true class and pis the discrete probability distribution for the predicted classes, defined over K+ 1 categories as p = (p0, ...., pK) in which “1” is for the background category. tu = (tu
xi, tuyi) is the predicted OBB regression offset for classuand v= (vxi, vyi) is the true OBB (i∈ {1,2,3,4}).
Lloc−HBB(tu, v) is defined similar to Lreg in Faster-RCNN in which instead of OBB coordinates,{xmin, ymin, w, h} (the upper-left coordinates, width and height) oftu andv for the corresponding HBB coordinates are utilized. In case the object is classified as background, [u≥1] ignores the offset regression. The balancing hyper-parameterλis set to 1. To obtain the final detections, we com-pute the minimum bounding rectangles of the predicted quadrilaterals. As the final post-processing, we apply R-NMS in which the overlap between rotated de-tections is computed to select the best localized regions and to remove redundant regions.
3
Experiments and Discussion
In this section, we present and discuss the evaluation results of the proposed method on three RS image datasets. All experiments were conducted using NVIDIA Titan X GPUs. The backbone network’s weights were initialized us-ing the ResNet-50/101 and ResNeXt-101 models pretrained on ImageNet [5]. Images were preprocessed as described in baseline [30]. Furthermore, the learn-ing rate was 0.0005 for 60 epochs with the batch size of 1 uslearn-ing flipped images as the data augmentation. Additionally, during training, we appliedonline hard example mining (OHEM)[25] to reduce false positives and we use Soft-NMS [1] as a more accurate non-maximum suppression approach only for the HBB bench-mark.
3.1 Datasets
The experiments were conducted on the DOTA [30], UCAS-AOD [34], and NWPU VHR-10 [2] datasets which all have multi-class object annotations.
DOTA is the largest and most diverse published dataset for multi-class object detection in aerial and satellite images. It contains 2,806 images from different camera sensors, GSDs (10 cm to 1 m), and sizes to reflect real-world scenarios and decrease the dataset bias. The images are mainly acquired from Google Earth, and the rest from the JL-1 and GF-2 satellites of the China Cen-ter for Resources Satellite Data and Application. Image sizes vary from 288 to 8,115 pixels in width, and from 211 to 13,383 pixels in height. There are 15 ob-ject categories: plane, baseball diamond (BD), bridge, ground field track (GTF), small vehicle (SV), large vehicle (LV), tennis court (TC), basketball court (BC), storage tank (SC), soccer ball field (SBF), roundabout (RA), swimming pool (SP), helicopter (HC), and harbor. DOTA is split into training (1/2), validation (1/6), and test (1/3) sets.
UCAS-AODcontains 1,510 satellite images (≈700×1300 px) with 14,595 objects annotated by OBBs for two categories: vehicles and planes. The dataset was randomly split into 1,110 training and 400 testing images.
NWPU VHR-10contains 800 satellite images (≈500×1000 px) with 3,651 objects were annotated with HBBs. There are 10 object categories: plane, ship, storage tank, baseball diamond, tennis court, basketball court, ground track field, harbor, bridge, and small vehicle. For training, we used non-rotated RPN andregion of interest (ROI)networks only for the HBBs detection task.
3.2 Evaluation
In order to assess the accuracy of our detection and the quality of region pro-posals, we adapted the samemean average precision (mAP) andaverage recall (AR) calculations as for DOTA [30]. We conducted ablation experiments on the validation set of DOTA. Furthermore, we compare our method to the ones in [30] for HBB and OBB prediction tasks as well as Yang et al. [32] for OBB task based on the test set whose ground-truth labels are undisclosed. The results reported here were obtained by submitting our predictions to the official DOTA evaluation server4. We used 0.1 threshold for R-NMS and 0.3 for Soft-NMS.
The impact of ICN: From Table 1 shows the evaluation results of ICN. According to the table, adding OHEM to ResNet-50 improved the accuracy by a narrow margin. Using a deeper network such as ResNet-101 further improved the accuracy. As a next step, adding a 1.5× cascade level increased mAP by around 2% indicating that the up-sampled input can have a significant impact. Based on this, we added smaller cascade levels such as 0.75×and 0.5×, which however, increased the accuracy to a lesser extent. This could be due to the fact that the majority of objects within this dataset are small, so reducing resolution is not always optimal. Further increasing the cascade levels (e.g., 1.75×and 2×)
4
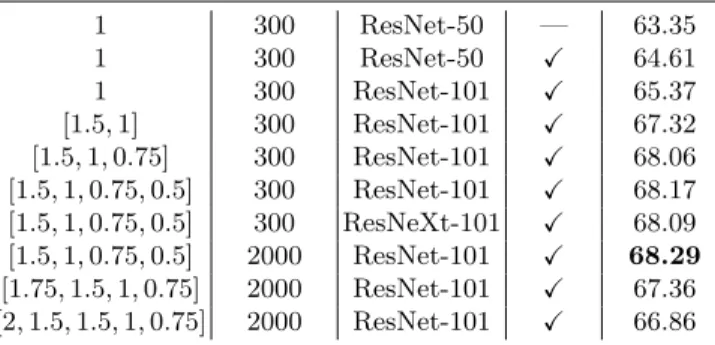
Table 1: Evaluation of (1) the impact of ICN with different cascade levels, (2) the effect of the backbone network (ResNet50/101, ResNeXt101), and (3) the influence of the number of proposals for the OBB prediction task. The models were trained on the DOTA training set and results are on the validation set.
Cascade level Proposals Backbone OHEM mAP (%)
1 300 ResNet-50 — 63.35 1 300 ResNet-50 X 64.61 1 300 ResNet-101 X 65.37 [1.5,1] 300 ResNet-101 X 67.32 [1.5,1,0.75] 300 ResNet-101 X 68.06 [1.5,1,0.75,0.5] 300 ResNet-101 X 68.17 [1.5,1,0.75,0.5] 300 ResNeXt-101 X 68.09 [1.5,1,0.75,0.5] 2000 ResNet-101 X 68.29 [1.75,1.5,1,0.75] 2000 ResNet-101 X 67.36 [2,1.5,1.5,1,0.75] 2000 ResNet-101 X 66.86
degraded the accuracy, which is due to the lack of annotations for very small objects such as small vehicles. We argue that extracting ResNet features on up-sampled images (1.5×) is beneficial for the small objects in the DOTA dataset, whereas doing this on the downsampled input (0.75×,0.5×) brings smaller im-provements because of the lower number of large objects in the dataset. We observed that replacing ResNet-101 with ResNeXt-101 causes a small drop in accuracy which could be due to the shallower architecture of ResNeXt-101. Re-sults indicated that using a higher number of proposals (2000) increases the accuracy to a small degree, which however came with an increased computation cost; thus, we considered 300 proposals for the rest of our experiments.
The impact of DIN: From Table 2 we see that replacing the 1×1 con-volution after the residual blocks Ci by DIN can augment mAP by more than 2%. More specifically, using DIN after lower levelCis resulted in slightly higher accuracy than using it after higher levels (e.g., mAP for C4>mAP for C5). In addition, employing DIN after multiple Cis can further improve model perfor-mance (e.g., mAP for C4<mAP for C4—C5<mAP for C3—C5). Kernel size strongly affects the high resolution (semantically weak) features. Thus, apply-ing DIN to the low-levelCis enriched the features and adapts them to the new data domain. Comparing the last two rows of Table 2, we see that deformable convolutions also have a positive impact; however, the improvement is smaller.
Rotated RPN and ROI modules:Using clustered initialized anchors with rotation, we obtained an additional 0.7% mAP. To initialize anchors, we selected 18 anchors compared to 15 in Faster-RCNN in clustering ground-truth OBBs. We observed no significant increase in IoU with higher number for anchors. Furthermore, we considered each anchor at four different angles (0, 45, 90, 135 degrees rotation). The total number of anchors is thus 18×4. Table 3 shows that using rotated proposals in the R-RPN/ R-ROI layers improves mAP by 1.4%, indicating that these proposals are more appropriate for RS images.
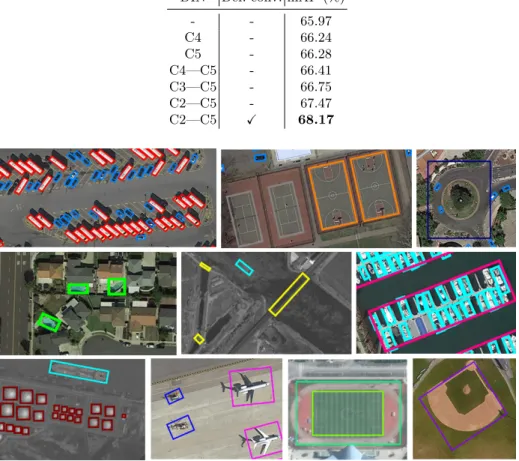
Table 2: Evaluation of employing DIN after certain residual blocksCi with and without deformable convolutions on the validation set of DOTA.
DIN Def. conv. mAP (%)
- - 65.97 C4 - 66.24 C5 - 66.28 C4—C5 - 66.41 C3—C5 - 66.75 C2—C5 - 67.47 C2—C5 X 68.17
Fig. 4: Sample OBB predictions in the DOTA test set.
In addition, we see that using a joint loss function (for HBB and OBB predic-tion) can increase the prediction of OBBs by 0.81% mAP. We believe that HBBs provide useful “hints” on the position of the object for regressing OBBs more accurately. This is not the case for HBB prediction: here, using only the HBB regression loss achieves 3.98% higher mAP as compared to the joint loss. This could be due to the complexity that OBB imposes on the optimization problem. Thus, we apply our algorithm on the HBB benchmark without the OBB loss.
Enforcing rectangular bounding boxes:We investigated three different loss functions to enforce the rectangularity of the quadrilateral bounding boxes. Results in Table 3 show that all three angle losses improve the output accuracy and angle L2 performs the best. The reason behind the lower performance of angle tangent L1 could be the property of thetangentfunction: it leads to very high loss values when the deviation from the right angle is large. Angle smooth
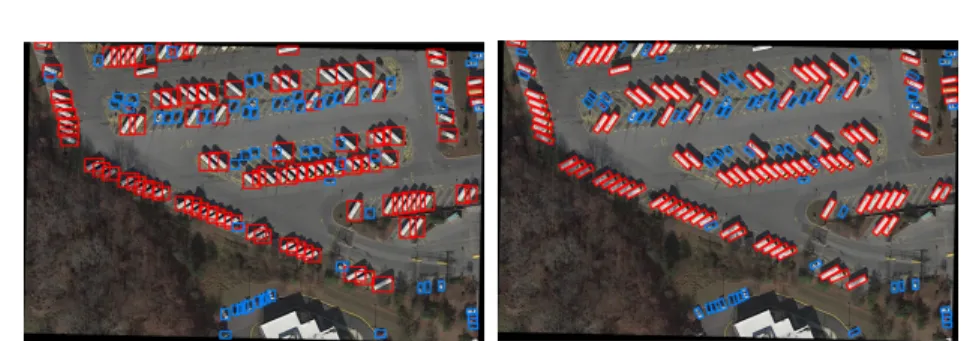
Fig. 5: Outputs of HBB (left) and OBB (right) prediction on an image of DOTA.
Table 3: Evaluation of (1) the impact of rotated RPN and RoI and (2) the effect of the loss functions enforcing the rectangularity of the bounding boxes.
Angle Loss functions Rotated BBs in RPN & RoI mAP (%)
- - 64.27
- X 65.67
Tangent L1 X 66.91
Smooth L1 X 67.41
L2 X 68.17
L1 performs marginally worse than angle L2 which could be due to its equal penalization for deviations larger than 1 degree from the right angle.
By studying the recall-IoU curve, we noticed that very small and very large objects (e.g., small vehicles and very large bridges) have the lowest localiza-tion recall and medium-size objects have the highest recall. Overall AR for the proposals on DOTA is 61.25%. A similar trend is observed for prec-recall curves. On False Positives: To investigate false positives, we used the object de-tection analysis tool from [11]. For the sake of brevity, we merge the bridge and harbor as the long objects class, and the LV, SV, and ship classes as the vehicles class. Similar observations were made for the rest of the classes. The large blue area in Figure 7 indicates that our method detects object categories with a high accuracy. Moreover, recall is around 80% (the red line) and is even higher with “weak” (10% overlap with the ground truth) localization criteria (dashed red line). The majority of confusions are with the background (the green area) while the confusion with similar object classes is much smaller (yellow area). This issue is more severe for long objects. Although using only down-sampled levels in the image cascade alleviates this issue, it lowers the performance for small objects. Since the proposals are not able to capture long objects effectively, they cause a large localization error. Additionally, the false positives for similar-classes often occur for vehicles: small and large vehicles are mistaken for each other.
Comparison with the state of the art:Tables 4 and 5 show the perfor-mance of our algorithm on the HBB and OBB prediction tasks DOTA, based on the official evaluation of the methods on the test set with non-disclosed
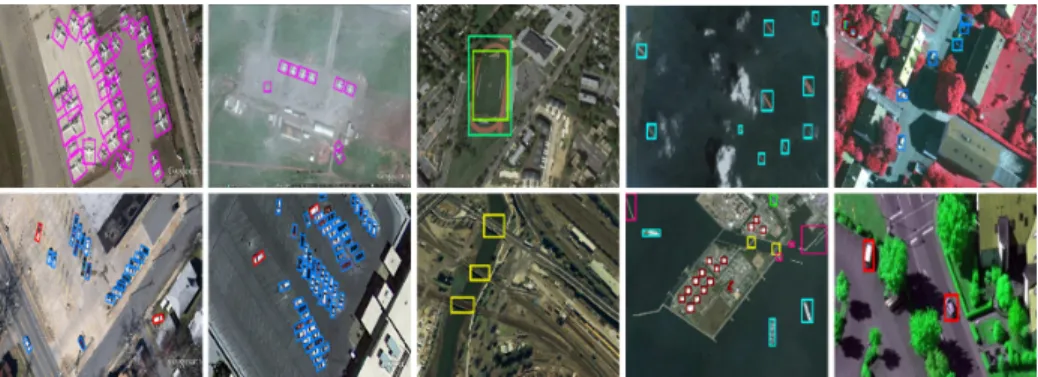
ground-Fig. 6: Sample outputs of our algorithm on the NWPU VHR-10 (three right columns – different camera sensors) and UCAS-AOD (two left columns – differ-ent weather conditions, camera angles, and GSDs) datasets.
Table 4: Quantitative comparison of the baseline and our method on the HBB task in test set of DOTA dataset. FR-H stands for Faster R-CNN[23] trained on HBB. TV stands for ‘trainval’ and T for ‘train’ subsets.
method data mAP plane BD bridge GTF SV LV ship TC BC ST SBF RA harbor SP HC Yolov2-[22] TV 39.20 76.90 33.87 22.73 34.88 38.73 32.02 52.37 61.65 48.54 33.91 29.27 36.83 36.44 38.26 11.61 R-FCN[3] TV 52.58 81.01 58.96 31.64 58.97 49.77 45.04 49.29 68.99 52.07 67.42 41.83 51.44 45.15 53.3 33.89 SSD[18] TV 29.86 57.85 32.79 16.14 18.67 0.05 36.93 24.74 81.16 25.1 47.47 11.22 31.53 14.12 9.09 0.0 FR-H[23] TV 60.64 80.32 77.55 32.86 68.13 53.66 52.49 50.04 90.41 75.05 59.59 57.00 49.81 61.69 56.46 41.85 ours T 70.54 89.54 73.48 51.96 70.33 73.39 67.91 78.15 90.39 78.73 78.48 51.02 59.41 73.81 69.00 52.59 ours TV 72.45 89.97 77.71 53.38 73.26 73.46 65.02 78.22 90.79 79.05 84.81 57.20 62.11 73.45 70.22 58.08
truth. We evaluate our method in two scenarios: training only on the ‘train’ subset, and training on the training and validation sets (‘trainval’). Our method significantly outperforms all the published methods evaluated on this bench-mark, and training on ‘trainval’ brings an additional 2-4% in mAP over training only on ‘train’. Looking at individual class predictions, only the mAPs of the helicopter, bridge, and SBF classes are lower than the baseline, possibly due to their large (and unique) size, complex features, and low occurrence in the dataset.
Generalization on the NWPU VHR-10 and UCAS-AOD datasets: As shown in Table 6, our algorithm significantly improves upon the baseline also on these two additional datasets. This demonstrates the good generalization capability of our approach. Results are competitive even when we trained our algorithm only on DOTA dataset.
4
Conclusions
In this work, we presented a new algorithm for multi-class object detection in unconstrained RS imagery evaluated on three challenging datasets. Our algo-rithm uses a combination of image cascade and feature pyramids together with rotation proposals. We enhance our model by applying a novel loss function for
Fig. 7: False positive trends. Stacked area plots show the fraction of each type of false positive by increasing the number of detections; line plots show recall for the weak localization with more 10% overlap with ground truth (dashed line) and the strong one with more than 50% overlap (solid line). Cor: correct, Loc: localization, Sim:similar classes, Oth: other reasons, BG: background.
Table 5: Quantitative comparison of the baselines and our method on the OBB prediction task in test set of DOTA dataset. Abbreviations are the same as in Table 4. Note that only FR-O[23] is trained with OBB.
method data mAP plane BD bridge GTF SV LV ship TC BC ST SBF RA harbor SP HC
Yolov2-[22] TV 25.49 52.75 24.24 10.6 35.5 14.36 2.41 7.37 51.79 43.98 31.35 22.3 36.68 14.61 22.55 11.89 R-FCN[3] TV 30.84 39.57 46.13 3.03 38.46 9.1 3.66 7.45 41.97 50.43 66.98 40.34 51.28 11.14 35.59 17.45 SSD[18] TV 17.84 41.06 24.31 4.55 17.1 15.93 7.72 13.21 39.96 12.05 46.88 9.09 30.82 1.36 3.5 0.0 FR-H[23] TV 39.95 49.74 64.22 9.38 56.66 19.18 14.17 9.51 61.61 65.47 57.52 51.36 49.41 20.8 45.84 24.38 FR-O[23] TV 54.13 79.42 77.13 17.7 64.05 35.3 38.02 37.16 89.41 69.64 59.28 50.3 52.91 47.89 47.4 46.3 R-DFPN[31] TV 57.94 80.92 65.82 33.77 58.94 55.77 50.94 54.78 90.33 66.34 68.66 48.73 51.76 55.10 51.32 35.88 Yang et al.[32] TV 62.29 81.25 71.41 36.53 67.44 61.16 50.91 56.60 90.67 68.09 72.39 55.06 55.60 62.44 53.3551.47 ours T 64.98 81.24 68.74 43.36 61.0765.2567.72 69.20 90.66 71.47 70.2155.4157.28 66.49 61.3 45.27 ours TV 68.16 81.36 74.30 47.70 70.3264.8967.82 69.98 90.76 79.06 78.2053.6462.90 67.02 64.1750.23
geometric shape enforcement using quadrilateral coordinates. Our method out-performs other published algorithms [30, 32] on the DOTA dataset by a large margin. Our approach is also robust to differences in spatial resolution of the image data acquired by various platforms (airborne and space-borne).
Table 6: Comparison of results on NWUH VHR-10 and UCAS-AOD datasets.
method train data test data mAP
Cheng et al.[2] NWUH VHR-10 NWUH VHR-10 72.63 ours NWUH VHR-10 NWUH VHR-10 95.01
ours DOTA NWUH VHR-10 82.23
Xia et al.[30] UCAS-AOD UCAS-AOD 89.41
ours UCAS-AOD UCAS-AOD 95.67
[1] Bodla, N., Singh, B., Chellappa, R., Davis, L.S.: Improving object detection with one line of code. ICCV (2017)
[2] Cheng, G., Zhou, P., Han, J.: Learning rotation-invariant convolutional neural networks for object detection in vhr optical remote sensing images. TGRS (2016)
[3] Dai, J., Li, Y., He, K., Sun, J.: R-FCN: Object detection via region-based fully convolutional networks. NIPS (2016)
[4] Dai, J., Qi, H., Xiong, Y., Li, Y., Zhang, G., Hu, H., Wei, Y.: Deformable convolutional networks. ICCV (2017)
[5] Deng, J., Dong, W., Socher, R., Li, L., Li, K., Fei-Fei, L.: Imagenet: A large-scale hierarchical image database. CVPR (2009)
[6] Everingham, M., Gool, L.V., Williams, C.K.I., Winn, J., Zisserman, A.: The pascal visual object classes (voc) challenge. IJCV (2010)
[7] Ghiasi, G., Fowlkes, C.C.: Laplacian pyramid reconstruction and refinement for semantic segmentation. ECCV (2016)
[8] Girshick, R., Donahue, J., Darrell, T., Malik, J.: Rich feature hierarchies for accurate object detection and semantic segmentation. CVPR (2014) [9] He, K., Gkioxari, G., Doll´ar, P., Girshick, R.: Mask R-CNN. ICCV (2017) [10] He, K., Zhang, X., Ren, S., Sun, J.: Deep residual learning for image
recog-nition. CVPR (2016)
[11] Hoiem, D., Chodpathumwan, Y., Dai, Q.: Diagnosing error in object detec-tors. ECCV (2012)
[12] Honari, S., Yosinski, J., Vincent, P., Pal, C.: Recombinator networks: Learn-ing coarse-to-fine feature aggregation. CVPR (2016)
[13] Krizhevsky, A., Sutskever, I., Hinton, G.E.: Imagenet classification with deep convolutional neural networks. NIPS (2012)
[14] Lin, T., Doll´ar, P., Girshick, R.B., He, K., Hariharan, B., Belongie, S.J.: Feature pyramid networks for object detection. CVPR (2017)
[15] Lin, T.Y., Maire, M., Belongie, S., Hays, J., Perona, P., Ramanan, D., Dollr, P., Zitnick, C.L.: Microsoft coco: Common objects in context. ECCV (2014) [16] Liu, K., Mattyus, G.: Fast multiclass vehicle detection on aerial images.
IEEE TGRS Letters (2015)
[17] Liu, L., Pan, Z., Lei, B.: Learning a rotation invariant detector with rotat-able bounding box. arXiv preprint arXiv:1711.09405 (2017)
[18] Liu, W., Anguelov, D., Erhan, D., Szegedy, C., Reed, S.E., Fu, C., Berg, A.C.: SSD: single shot multibox detector. ECCV (2016)
[19] Ma, J., Shao, W., Ye, H., Wang, L., Wang, H., Zheng, Y., Xue, X.: Arbitrary-oriented scene text detection via rotation proposals. IEEE Trans-actions on Multimedia (2018)
[20] Newell, A., Yang, K., Deng, J.: Stacked hourglass networks for human pose estimation. ECCV (2016)
[21] Pinheiro, P.H.O., Lin, T., Collobert, R., Doll´ar, P.: Learning to refine object segments. ECCV (2016)
[22] Redmon, J., Farhadi, A.: Yolo9000: Better, faster, stronger. CVPR (2017) [23] Ren, S., He, K., Girshick, R., Sun, J.: Faster R-CNN: Towards real-time
object detection with region proposal networks. NIPS (2015) [24] Ross, G.: Fast R-CNN. CVPR (2015)
[25] Shrivastava, A., Gupta, A., Girshick, R.: Training region-based object de-tectors with online hard example mining. CVPR (2016)
[26] Simonyan, K., Zisserman, A.: Very Deep Convolutional Networks For Large-Scale Image Recognition. ICRL (2015)
[27] Sommer, L.W., Schuchert, T., Beyerer, J.: Deep learning based multi-category object detection in aerial images. SPIE Defense and Security (2017) [28] Szegedy, C., Liu, W., Jia, Y., Sermanet, P., Reed, S., Anguelov, D., Erhan, D., Vanhoucke, V., Rabinovich, A.: Going deeper with convolutions. CVPR (2015)
[29] Tang, T., Zhou, S., Deng, Z., Zou, H., Lei, L.: Vehicle detection in aerial images based on region convolutional neural networks and hard negative example mining. Remote Sensing (2017)
[30] Xia, G., Bai, X., Ding, J., Zhu, Z., Belongie, S.J., Luo, J., Datcu, M., Pelillo, M., Zhang, L.: DOTA: A large-scale dataset for object detection in aerial images. CVPR (2018)
[31] Yang, X., Sun, H., Fu, K., Yang, J., Sun, X., Yan, M., Guo, Z.: Automatic ship detection in remote sensing images from google earth of complex scenes based on multiscale rotation dense feature pyramid networks. Remote Sens-ing (2018)
[32] Yang, X., Sun, H., Sun, X., Yan, M., Guo, Z., Fu, K.: Position detection and direction prediction for arbitrary-oriented ships via multiscale rotation re-gion convolutional neural network. arXiv preprint arXiv:1806.04828 (2018) [33] Zhao, H., Qi, X., Shen, X., Shi, J., Jia, J.: Icnet for real-time semantic segmentation on high-resolution images. arXiv preprint arXiv:1704.08545 (2017)
[34] Zhu, H., Chen, X., Dai, W., Fu, K., Ye, Q., Ji, X.: Orientation robust object detection in aerial images using deep convolutional neural network. ICIP (2015)