University of Pennsylvania
ScholarlyCommons
Business Economics and Public Policy Papers
Wharton Faculty Research
5-2016
Estimating Top Income and Wealth Shares:
Sensitivity to Data and Methods
Jesse Bricker
Alice Henriques
Jacob Krimmel
University of Pennsylvania
John Sabelhaus
Follow this and additional works at:
https://repository.upenn.edu/bepp_papers
Part of the
Business Analytics Commons
,
Design of Experiments and Sample Surveys Commons
,
Economics Commons
,
Management Sciences and Quantitative Methods Commons
, and the
Public
Affairs, Public Policy and Public Administration Commons
This paper is posted at ScholarlyCommons.https://repository.upenn.edu/bepp_papers/150
For more information, please [email protected].
Recommended Citation
Bricker, J., Henriques, A., Krimmel, J., & Sabelhaus, J. (2016). Estimating Top Income and Wealth Shares: Sensitivity to Data and Methods.American Economic Review, 106(5), 641-645.http://dx.doi.org/10.1257/aer.p20161020
Estimating Top Income and Wealth Shares: Sensitivity to Data and
Methods
Abstract
Administrative income tax data indicate that U.S. top income and wealth shares are both substantial and larger than shares observed in household surveys. However, these estimates are sensitive to the unit of analysis, the income concept measured in tax records, and, in the case of wealth, to assumptions about the correlation between income and wealth. We constrain a household survey—the Survey of Consumer Finances—to be conceptually comparable to tax records and are able to reconcile the much of the difference between the survey and administrative estimates. Wealth estimates from administrative income tax data are sensitive to model parameters.
Disciplines
Business | Business Analytics | Design of Experiments and Sample Surveys | Economics | Management Sciences and Quantitative Methods | Public Affairs, Public Policy and Public Administration
641 American Economic Review: Papers & Proceedings 2016, 106(5): 641–645 http://dx.doi.org/10.1257/aer.p20161020
Measuring Top WealTh shares
‡Estimating Top Income and Wealth Shares:
Sensitivity to Data and Methods
†By Jesse Bricker, Alice Henriques, Jacob Krimmel, and John Sabelhaus*
‡Discussants: Jirka Slacalek, European Central Bank;
Jeff Larrimore, Federal Reserve Board; Christopher D. Carroll, John Hopkins University; Faith Guvenen, University of Minnesota.
* Bricker: Board of Governors of the Federal Reserve, 20th and C Street, NW, Washington, DC 20551 (e-mail: [email protected]); Henriques: Board of Governors of the Federal Reserve, 20th and C Street, NW, Washington, DC 20551 (e-mail: [email protected]); Krimmel: The Wharton School, University of Pennsylvania, 3620 Locust Walk, Suite 3000, Philadelphia, PA 19104 (e-mail: [email protected]); Sabelhaus: Board of Governors of the Federal Reserve, 20th & C Street, NW, Washington, DC 20551 (e-mail: john.e.sabelhaus@frb. gov). The analysis and conclusions set forth are those of the authors and do not indicate concurrence by other members of the research staff or the Board of Governors. We would like to thank our colleagues on the SCF project who made this research possible: Lisa Dettling, Sebastian Devlin-Foltz, Joanne Hsu, Lindsay Jacobs, Kevin B. Moore, Sarah Pack, Jeff Thompson, and Richard Windle. We also thank Jeff Larrimore, our conference discussant.
† Go to http://dx.doi.org/10.1257/aer.p20161020 to visit
the article page for additional materials and author disclo-sure statement(s).
Estimates of top income and wealth shares in US household survey data are generally lower than the estimates from US administra-tive income tax data. However, these top share estimates are sensitive to the unit of analysis, the income concept being measured, and, in the case of wealth, to assumptions about the cor-relation between income and wealth. We con-strain a household survey—the 2010 Survey of Consumer Finances (SCF)—to be conceptually comparable to tax records and are able to rec-oncile the cross-sectional difference between the survey and administrative estimates.
A survey with sample coverage at the top of the distribution—like the SCF—has measure-ment advantages over the tax data. Surveys, in general, measure a wider concept of income
than does the income tax data, and wealth esti-mates from the income tax data are heavily dependent on rates of return. Overall, top share estimates derived from income tax data gener-ally overstate income and wealth concentration levels relative to SCF survey data.
I. Measurement: Methods and Data
Both household surveys and administrative data can be used to measure US income and wealth distributions. Comparisons between these are difficult, however, as these two sources of data often differ in the conceptual measure-ment of income and wealth and the population available for measurement. Each of these differ-ences can impact distributional share estimates.
Typically, administrative tax data offer nearly universal coverage at the top of the distributions, as tax filing is virtually compulsory for those at the top. However, tax data are often missing information on those that do not have to file (nearly 20 million units in recent years). And the unit of observation in tax records are tax units, an arbitrary unit defined by the tax code rather than by economic theory.
Survey data typically come from a random sam-ple of families, a more economically-meaningful unit of observation. Many tax units may choose to reside within one family and pool economic resources.
Surveys, though, often suffer from low response and from measures of income and wealth that are too low at the top (Burkhauser et al. 2012; Bricker et al. forthcoming).
We use the 2010 SCF, which has an over-sample of wealthy families and a weighting scheme that corrects for under-coverage at the top. Using sampling frame data, wealthy SCF nonrespondents are observationally equivalent to
MAY 2016 642 AEA PAPERS AND PROCEEDINGS
wealthy SCF respondents even among the high-est wealth families (Bricker et al. forthcoming).1
A. Income Measurement
The concept of income being measured differs between the survey data and tax data. Income in the tax data is conceptually limited by the infor-mation being collected for tax purposes, while surveys can choose to include a more expansive set of income measures.
For instance, the income concept in the US tax system is narrower than that found in the SCF or in other sources, such as the National Income and Product Accounts (NIPA). Tax data may capture as little as 60 percent of 2010 NIPA Personal Income, and the SCF has typically collected about 15 percent more income than the tax aggregate in recent years (Bricker et al. forthcoming). The SCF, for example, collects information on transfer income that the tax sys-tem does not.
B. Wealth Measurement
Estimates of the US wealth distribution can come from a household survey with a wealthy oversample (such as the SCF, Bricker et al. forthcoming), estate tax data (Kopczuk and Saez 2004), or by capitalizing income tax data (Saez and Zucman forthcoming). The concepts are generally similar across datasets—including all assets and debts—but measurement differs.
Household Survey Data.—The SCF survey directly measures assets and debt values by querying the family.2 These survey measures of wealth compare favorably to external aggre-gates (Dettling et al. 2015). Among cases in the
1 Because the SCF oversample is sampled from
statisti-cal records derived from tax returns, nonrespondents can be compared to respondents. Kennickell and Woodburn (1999) describe the SCF weighting process.
2 The SCF questionnaire asks detailed questions about
the value of the family’s assets held in housing, businesses, vehicles, other nonfinancial assets, financial transaction accounts, privately-held stocks, bonds, mutual funds, and trust accounts, as well as assets held in retirement accounts. Information of receipt of defined-benefit pension accounts is collected but not typically included in asset estimates. There are also detailed questions about the balances owed on mort-gages, credit cards, lines of credit, household installment debts, and pension loans. The difference between the assets and debts is the SCF estimate of family net worth.
oversample—for whom sampling frame data are known—the income and predicted wealth distribution of the responding families matches that of the nonresponding families (Bricker et al. forthcoming).
Estate Tax Data.—Data on estate tax filers are the only direct measurement of wealth in the tax data; estate tax filings occur at death and for very few families. The SCF, then, can directly measure wealth for a much wider set of families than administrative tax data can. Estimates from estate data rely on mortality models.
Income Tax Data.—Wealth can also be esti-mated from income tax data (Saez and Zucman forthcoming; Kennickell and Woodburn 1999; Greenwood 1983). In contrast to survey data, these wealth estimates are measured indirectly with the help of a model that “capitalizes” tax-able income into wealth, and calibrates to exter-nal wealth aggregates. These wealth estimates are sensitive to model parameters and to taxable income concepts.
The most straightforward capitalization model involves estimating financial wealth by capitalizing k types of capital income from the tax data by a general rate of return on assets associated with that income ( r k ), then adding an
estimate of nonfinancial wealth.3 For family i: (1) ˆ wealt hi = ˆ nonfi ni +
∑
∀k
incom e i,k
_
r k .
Rates of return for income type k can be esti-mated using annual market rates of return or derived using the ratio of aggregate tax income of type k to its related concept in the Financial Accounts of the United States (FA) data (Saez and Zucman forthcoming). For example, the rate of return on interest income is the ratio of total interest income in the tax data to total stock of interest-bearing assets in the FA. Wealth esti-mates derived from income tax data are heavily
3 See Greenwood (1983); Bricker et al. (forthcoming);
and Saez and Zucman (forthcoming) for three examples. In Saez and Zucman (forthcoming) eight different types of cap-ital income are included in the model. Bricker et al. ( forth-coming) describe the oversampling model in the SCF, which is based on Greenwood (1983) and similar to Saez and Zucman (forthcoming), though using nine income sources and market-based rates of return.
VOL. 106 NO. 5 Estimating top incomE and WEalth sharEs 643
dependent on rates of return (Bricker et al. 2016; Kopczuk 2015).
Estimates of nonfinancial wealth (mainly for housing and defined-benefit (DB) pensions) can be estimated by known aggregates such as the FA (Saez and Zucman forthcoming) or through survey data (Bricker et al. forthcoming).
C. Top Share Measurement
Aside from differences in coverage and mea-surement, the differences in unit of measure-ment between income tax data and survey data impact the measurement of top income and wealth shares. Top share estimates using the income tax data in 2010 are based on 156 mil-lion tax units, but SCF estimates are based on 117 million families. Most tax units in the top 1 percent are families, but many families at lower percentiles are split into multiple tax units.4 If a tax unit is always a family at the top, then identi-fying the top 1 percent of tax units (1.56 million tax units) is equivalent to identifying roughly the top 1.3 percent of families. The unadjusted tax data, then, are predisposed to estimating more concentration at the top relative to a household survey.
The SCF provides good coverage of the entire wealth distribution up to the Forbes 400 fami-lies, which the SCF is precluded from sampling. Many families in the SCF are as wealthy as these families, though, so the SCF provides coverage even within the top 400. SCF top share estimates need to be augmented for the missing families, though.5
The tax unit issue is common to both income and wealth measurement. In the next two sec-tions we describe these and other steps needed to reconcile survey and administrative estimates of top income and wealth shares.
4 In the 2013 SCF, less than 3 percent of families in the
top 1 percent had multiple tax units in a family, while nearly 20 percent of the bottom 99 percent of families had multiple tax units. The measure of 156 million tax units includes an estimate of nearly 20 million non-filers.
5 Augmenting the SCF estimates to include
miss-ing Forbes 400 wealth typically adds about 2 percentage points to the SCF top share estimates (Figure 2), similar to Vermeulen (2016).
II. Reconciling Income Concepts and Measurement
Top income share estimates differ between the tax data and the SCF. The top 1 percent of families in the SCF held 17.3 percent of 2009 income, while the top 1 percent of tax units held 18.1 percent of total income in the administrative income tax data. Similarly, the top 0.1 percent of SCF families held 5.9 percent of 2009 income, while the top 0.1 percent of tax units held 8.3 percent of total income in the administrative income tax data (Figure 1).
18.1 17.3 19.6 22.0 0 5 10 15 20 25 Tax Data SCF (1) SCF (2) SCF (3) P er ce nt
Panel A. Top 1 percent
8.3 5.9 7.1 8.0 0 3 6 9 12 Tax Data SCF (1) SCF (2) SCF (3) P er ce nt
Panel B. Top 0.1 percent
Figure 1. Share of Income Received by Top Percentiles in 2010
Notes: Data for black bars drawn from administrative tax data for income earned in 2009. Data for gray bars drawn from 2009 income reports in the 2010 SCF. The bar labeled “SCF (1)” represents the SCF estimate of the share of total income held by the top 1 or top 0.1 percent of families. The bar labeled “SCF (2)” shows the top share estimate when the SCF income concepts are reconciled to the adminis-trative data income concepts. The final bar labeled “SCF (3)” shows the top share estimate when the SCF estimate is further modified: from a household-level estimate to a tax-unit-based estimate. The line in the final bar shows a 95 percent confidence interval.
MAY 2016 644 AEA PAPERS AND PROCEEDINGS
The concept of income, though, differs between the two data sources (Section IA). However, when the SCF household survey data are constrained to have the same income con-cepts, the top 1 percent and top 0.1 percent income shares increase to 19.6 and 7.1 percent, respectively (Figure 1, bar SCF (2)), making the SCF top 1 percent share slightly more concen-trated than the tax data and eliminating much of the difference between the SCF and tax data estimates of the top 0.1 percent share.
Next, we adjust the SCF family level data to be comparable to a tax unit level in the tax data (see Section I). If the top 1.56 million SCF fam-ilies are considered the top 1 percent, as in the tax data, then the SCF top 1 and top 0.1 esti-mates increase to 22.0 percent and 8.0 percent, respectively (Figure 1, bar SCF (3)). Thus, in comparable terms the SCF top 1 percent share is
more concentrated than the tax data and nearly identical to the tax data estimates of the top 0.1 percent share.
III. Reconciling Wealth Concepts and Measurement
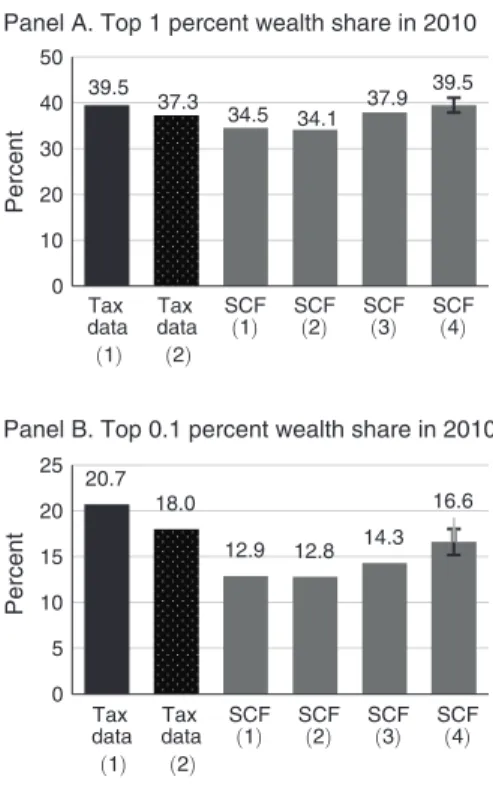
Top wealth share estimates differ between the SCF and the capitalized income tax data (Figure 2, first and third bars).6 The top 1 per-cent of families in the SCF held 34.5 perper-cent of 2010 wealth, while the top 1 percent of tax units held 39.5 percent of total wealth in the capital-ized income tax data. Similarly, the top 0.1 per-cent of SCF families held 12.9 perper-cent of 2010 wealth, while the top 0.1 percent of tax units held 20.7 percent of total wealth in the capital-ized income tax data.
A. Rates of Return in Modeled Wealth
Estimates
The estimates based on income tax data are sen-sitive to even small deviations in rates of return, and about 40 percent of the gap between SCF and
6 The estate tax data estimates end in the year 2000, but
the focus of this article is on recent wealth estimates. Thus, we concentrate on reconciling the 2010 SCF to the 2010 capitalized income tax estimates. The level of wealth con-centration among the top 1 percent in the estate tax data (20 percent in the year 2000) is lower than in either the SCF (33 percent in 2001) or the capitalized income tax data (33 per-cent in 2001). However, the time trend in the SCF estimates more closely resemble the time trend in the estate tax data.
income tax estimates are explained by a small change in the rate of return on interest-bearing assets. The 1 percent estimate drops to 37.3 per-cent and the top 0.1 perper-cent estimate drops to 18.0 percent when a conservative market-based rate of return on interest-bearing assets—the ten-year Treasury rate—is used to capitalize
Figure 2. Share of Wealth Held by Top Percentiles in 2010
Notes: Data for black bars drawn from administrative tax data for income earned in 2010 and wealth inferred as in Saez and Zucman (2016). Bar labeled “Tax Data (1)” is the baseline wealth share in Saez and Zucman (2016). Data in the bar labeled “Tax Data (2)” uses alternate capitalization of taxable income ( ten-year Treasury yield, see Saez and Zucman 2016, Appendix Table 40). Data in gray bars drawn from 2010 wealth reports in the 2010 SCF. The bar labeled “SCF (1)” represents the SCF estimate of the share of wealth held by the top 1 or top 0.1 percent of families. The next bar labeled “SCF (2)” shows the top share estimate when the SCF wealth concepts are reconciled to the Financial Accounts values and concepts (as in Saez and Zucman, 2016). The next bar labeled “SCF (3)” shows the top share estimate when the SCF estimate is further modified: from a household-level estimate to a tax-unit-based estimate. The final bar labeled “SCF (4)” shows the SCF estimate of top wealth shares when further augmented to include an esti-mate of the wealth held by the Forbes 400, a group that the SCF is legally obligated to not sample. The line in the final bar shows a 95 percent confidence interval.
39.5 37.3 34.5 34.1 37.9 39.5 0 10 20 30 40 50 Tax data (1) Tax data (2) SCF (1) SCF(2) SCF(3) SCF(4) Tax data (1) Tax data (2) SCF (1) SCF(2) SCF(3) SCF(4) Percent
Panel A. Top 1 percent wealth share in 2010
20.7 18.0 12.9 12.8 14.3 16.6 0 5 10 15 20 25 Percent
VOL. 106 NO. 5 Estimating top incomE and WEalth sharEs 645
interest income and all other rates of return are unchanged (Figure 2, bar Tax Data (2)).7
B. Reconciling SCF and Modeled Income Tax
Wealth Estimates
As in the case of income, the capitalized tax data effectively use different wealth concepts than the SCF. The capitalized income tax data are calibrated to match the FA household data, which includes an estimate of aggregate DB pension wealth. The SCF wealth estimate does not include DB pension wealth.
Further, the composition of assets dif-fers somewhat between the SCF and the FA, even though aggregate asset totals are similar. Notably, the SCF estimate of housing wealth as a share of assets is larger than that in the FA. The wealth estimates from capitalized income in Figure 2, then, bias down housing wealth—a key middle-class asset—relative to the SCF.
We adjust the SCF wealth concept to match the FA concept by including an estimate of DB pension wealth, which lowers the SCF top share. We also adjust SCF wealth to match the values in the FA, as is done in the income tax estimates, which raises the estimated top share. These changes mostly offset each other (Figure 2, bar SCF (2)).
Adjusting the SCF family level data to be comparable to a tax unit level in the tax data leads to larger top share estimates: 37.9 percent for the top 1 percent and 14.3 percent for the top 0.1 percent. The top 1 percent is now reconciled with the alternative capitalized income data, though the top 0.1 percent is still a few percent-age points below (Figure 2, bar SCF (3)).
The SCF, recall, is precluded from sampling families in the Forbes 400. Incorporating an esti-mate of the wealth held by these families further increases top wealth shares in the SCF. Wealth share levels are about equal in the augmented SCF and capitalized income tax estimates (Figure 2, bar SCF (4)).
7 The estimates in Saez and Zucman (forthcoming), and
presented as the first bar in Figure 2, use a 1.46 percent return on interest-bearing assets while the ten-year Treasury rate is about 3 percent. The average AAA corporate bond rate for 2010 was about 4.5 percent. Kopczuk (2015) and Bricker et al. (forthcoming) have noted that the interest-bearing asset rate of return in Saez and Zucman (forthcoming) is different from what both estate tax data imply and what market rates imply.
REFERENCES
Bricker, Jesse, Alice M. Henriques, Jacob A.
Krimmel, and John E. Sabelhaus.
Forthcom-ing. “Measuring Income and Wealth at the Top Using Administrative and Survey Data.”
Brookings Papers on Economic Activity.
Burkhauser, Richard V., Shuaizhang Feng,
Ste-phen P. Jenkins, and Jeff Larrimore. 2012.
“Recent Trends in Top Income Shares in the United States: Reconciling Estimates from March CPS and IRS Tax Return Data.” Review
of Economics and Statistics 94 (2): 371–88.
Dettling, Lisa J., Sebastian J. Devlin-Foltz, Jacob Krimmel, Sarah J. Pack, and Jeffrey P.
Thomp-son. 2015. “Comparing Micro and Macro
Sources for Household Accounts in the United States: Evidence from the Survey of Consumer Finances.” Divisions of Finance and Econom-ics Discussion Series Working Paper 2015-086.
Greenwood, Daphne. 1983. “An Estimation of
US Family Wealth and Its Distribution from Microdata.” Review of Income and Wealth 29 (1): 23–44.
Kennickell, Arthur B., and R. Louise Woodburn.
1999. “Consistent Weight Design for the 1989, 1992, and 1995 SCFs, and the Distribution of Wealth.” Review of Income and Wealth 45 (2): 193–215.
Kopczuk, Wojciech. 2015. “What Do We Know
about the Evolution of Top Wealth Shares in the United States?” Journal of Economic
Per-spectives 29 (1): 47–66.
Kopczuk, Wojciech, and Emmanuel Saez. 2004.
“Top Wealth Shares in the United States, 1916–2000: Evidence from Estate Tax Returns.” National Tax Journal 57 (2): 445–87.
Piketty, Thomas, and Emmanuel Saez. 2003.
“Income Inequality in the United States, 1913– 1998.” Quarterly Journal of Economics 118 (1): 1–41.
Saez, Emmanuel, and Gabriel Zucman.
Forth-coming. “Wealth Inequality in the United States since 1913: Evidence from Capitalized Income Tax Data.” Quarterly Journal of
Eco-nomics.
Vermeulen, Philip. 2016. “Estimating the Top
Tail of the Wealth Distribution.”
Ameri-can Economic Review 106 (5): http://dx.doi. org/10.1257/aer.p20161021.
This article has been cited by:
1. Livio Di Matteo. Wealth Inequality: Facts, Figures and Approaches to Its Study 25-40. [Crossref] 2. Jacob Lundberg, Daniel Waldenström. 2017. Wealth Inequality in Sweden: What can we Learn from