Procedia Computer Science 89 ( 2016 ) 324 – 332
1877-0509 © 2016 The Authors. Published by Elsevier B.V. This is an open access article under the CC BY-NC-ND license (http://creativecommons.org/licenses/by-nc-nd/4.0/).
Peer-review under responsibility of organizing committee of the Organizing Committee of IMCIP-2016 doi: 10.1016/j.procs.2016.06.079
ScienceDirect
Twelfth International Multi-Conference on Information Processing-2016 (IMCIP-2016)
Optimizing Feature Selection using Particle Swarm
Optimization and Utilizing Ventral Sides of Leaves for
Plant Leaf Classification
Arun Kumar
∗, Vinod Patidar, Deepak Khazanchi and Poonam Saini
Sir Padampat Singhania University, Udaipur 313601, Rajasthan, IndiaAbstract
As the digital images produce a lot of information about the pixels, there is a need to find alternative methods to reduce the image feature dataset for faster and automatic classification of plants through digital leaf images. In the present work, the leaf image texture features have been extracted through Gabor based techniques and then subjecting them to PSO-CFS based search method for identifying the best set of features from the complete feature set and then classifying them using four classification algorithms like KNN, J48, CART and RF. Another objective of this work is to utilize the two faces available on the plant leaves (Dorsal and Ventral), instead of one (i.e. Dorsal) for classification of plants on the basis of digital leafimages and to analyse the effects on classification accuracy values for dorsal and ventral sides of leaf images.
© 2016 The Authors. Published by Elsevier B.V.
Peer-review under responsibility of organizing committee of the Twelfth International Multi-Conference on Information Processing-2016 (IMCIP-2016).
Keywords: Dorsal Side; Gabor Filter; Leaf Images; Particle Swarm Optimization; Ventral Side.
1. Introduction
Man has been enjoying the boons of nature, its flora and fauna since the ages. Due to the technical advancement and the human need for better roads, bridges and houses, there has been a reckless felling of trees and cutting of vegetation to pave the way for roads and bridges. The development on one end is leading to disappearance of flora and fauna, though essential in maintaining the ecological balance. But, at the same time, the human quest for identifying and taxonomically classifying the plants and their sub-species and then devising methods for preserving them for the future before the plant species get extinct, has been going on in scientific world since decades. The plants have been studied for their flowers, leaves, seeds and fruits. There are millions of different plant species, but many of the sub species are still unknown and would die and become extinct, before their turn comes up to know them. Therefore, there is a need for automatic plant identification and taxonomically classification methods which could speed up the process of knowing the individual plant species. The biologist and computer scientists have been playing their roles in suggesting newer methods for identifying the plant species. The computer vision methods have revolutionized the work of automatic plant classification and are based on finding suitable characteristic features from the digital images
∗Corresponding author. Tel.: +09828752479. E-mail address:[email protected]
© 2016 The Authors. Published by Elsevier B.V. This is an open access article under the CC BY-NC-ND license (http://creativecommons.org/licenses/by-nc-nd/4.0/).
study the effects of Particle Swarm Optimization technique, a technique within the family of evolutionary optimization algorithms, to search for the best set of features for predicative classification of digital leaf image dataset. The overall process involves extracting the important texture features from the dorsal and ventral parts of the leaves of digital images and then subjecting them to feature selection and further classification process, and to study the effects of PSO based feature search on the overall classification accuracy values. The work substantiates the fact that ventral leaf images can be another valuable alternative for the discrimination of plant images on the basis of application of PSO based feature search techniques applied on the digital leaf images.
In this present work, the Section 2 explains about the techniques utilized to extract the important features from the different leaf images of different plant species and the formation of the complete dataset which has all the extracted features. After the preparation of the feature dataset, the 3rd Section describes about the adoption of the feature selection methodology to the complete dataset, to extract unique, useful and uncorrelated features and the preparation of the subset of dorsal and ventral feature sets with the application of PSO-CFS based technique over the entire dataset. The 4thpart of this research work, describes about the application of classification algorithms like KNN, J48,
CART and RF on two different sets of data, one representing dorsal and the other representing the ventral feature set extracted from leaf images. The 5thpart represents the result analysis and comparative study with other works of similar nature.
2. Methodology Adopted
2.1 Database creation and its preprocessing
The plant leaves have two faces viz.: dorsal and ventral, therefore there is a need for paying critical attention on both the sides of the leaves, as both have independent and unique set of features. The existing leaf image databases available on the internet contain the leaf images of dorsal sides, but to achieve the objective of this work, there is a need to create an independent leaf image database with dorsal as well as ventral sides of the leaves. Therefore, 25 dorsal side and 25 ventral side leaf images were clicked for each plant species and a database of ten plant species has been created with 250 dorsal and 250 ventral sides of leaf images and 500 images in totality. A sample of such colored leaf images is shown in Fig. 1.
The 500 images captured were subjected to the process of background removal, size reduction to 256×256 and converting them to gray scale. The gray scaled images were subjected to the process of image contrast and intensity enhancement techniques and then stacked together as slices for further processing.
2.2 Extraction of texture features
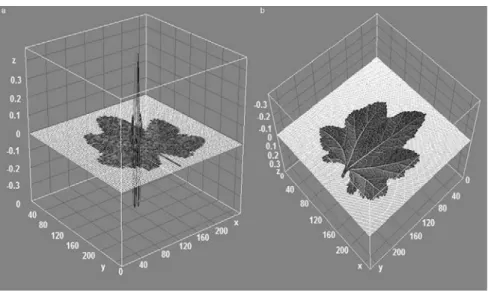
The digital leaf images have been studied by using their color, geometrical shape, texture etc. for discrimination of plants. In the present work, the leaf images have been studied through the texture features present on its dorsal and ventral sides. The term texture refers to the visual features present on the objects of interest. The Fig. 2 shows the 3D surface plot of texture of the digital leaf image with dorsal (Fig. 2(a)) and ventral sides (Fig. 2(b)) of the Slice-24E from the leaf image dataset created in the present study. Here E in Slice-24E represents the enhanced image.
Fig. 1. The Input GraphGand SubgraphsSofG.
Fig. 2. 3D Surface Plot of the Leaf Texture for Slice-24E, (a) Dorsal Side; (b) Ventral Side.
The texture features for digital images can be calculated using co-occurrence matrix based on the principles put forward by1. The texture features are also studied through the Tamura texture features2. In the present study the texture features have been extracted using Gabor Filter. The Gabor based texture features has been an all-time popular technique to extract texture features from the digital images. The frequency and angular orientation based features obtained by using Gabor filter based technique has similarity with the human visual identification system and Eq. (1) represents the Complex form of Gabor filter3
g(x,y;λ, θ, ψ, σ, γ )=exp −x2+γ2y2 2σ2 exp i 2πx λ +ψ (1)
wherex=xcosθ+ysinθandy= −xsinθ+ycosθ.
In the above Eq. (1),λrepresents the wavelength of the sinusoidal factor,θrepresents the orientation of the normal to the parallel stripes of a Gabor function,ψis the phase offset,σis the sigma or standard deviation of the Gaussian
envelope andγis the spatial aspect ratio, and specifies the ellipticity of the support of the Gabor function. For a single leaf image, a single Gabor filter finds the patterns within the image with a certain frequency and corresponding angular orientation value. But, in order to capture the complete texture features present on the digital leaf image, the Gabor filter bank is to be appropriately tuned at particular set of frequencies and corresponding angular orientation values. The researchers in4have proposed a guideline in selecting the values for scale parameterσ to around 10. The orientation parameterθlies in the interval 0◦and 180◦, the symmetry makes the other directions redundant. In the present work 8 orientation values have been chosen and the total number of filters is calculated using 4 log2(W/2), whereW is the width of W pixels. In the present work 256×256 images have been chosen which require 28 filters but with 8 orientations, 32(8×4)filters has been used. For each image in the dataset, the Gabor filter generates 32 real images for 4 different values ofscale (2, 4, 8, 16) and 8 different orientation values(22◦,44◦,66◦,88◦,110◦,132◦,154◦,176◦).
The Fig. 3 represents the set of 32 images computed by the convolution of Gabor Filter for single slice of enhanced leaf image Slice-24E from the stack of enhanced leaf image set. The Fig. 3 has been obtained at different frequency and angular orientation values. The similar approach has been applied to all the 500 images in the enhanced leaf image dataset. After this process, a comma separated value file (CSV) is prepared which contains six variables with respect to six texture based features extracted by using Gabor filter bank. The six important features are: Mean, Energy, Standard Deviation, Skewness, Contrast and Kurtosis. This data file is further subjected to the process of classification. The detailed explanation of these features have been described through Eq. (2) to (6)
• Mean(V1): The Mean is denoted as mentioned in Eq. (2)
μ(s,θ)= 1 N M N x=1 M y=1 G(s,θ)(x,y) (2)
• Energy(V2): Energy is obtained by computing the absolute average deviation of the transformed values of the
filtered images from the meanμ(s,θ). The texture energy is expressed asE(x,y)and is as mentioned in the Eq. (3)
E(x,y)= 1 M
(a,b∈w)
|R(a,b)−μ| (3)
• Standard Deviation(V3): The standard deviation has been calculated using Eq. (4)
σ(s,θ)= 1 N M N x=1 M y=1 (G(s,θ)(x,y)−μ(s,θ))2 (4)
• Skewness (V4): The term Skewness (γ ) is used for finding the asymmetry in the dataset and it can be a
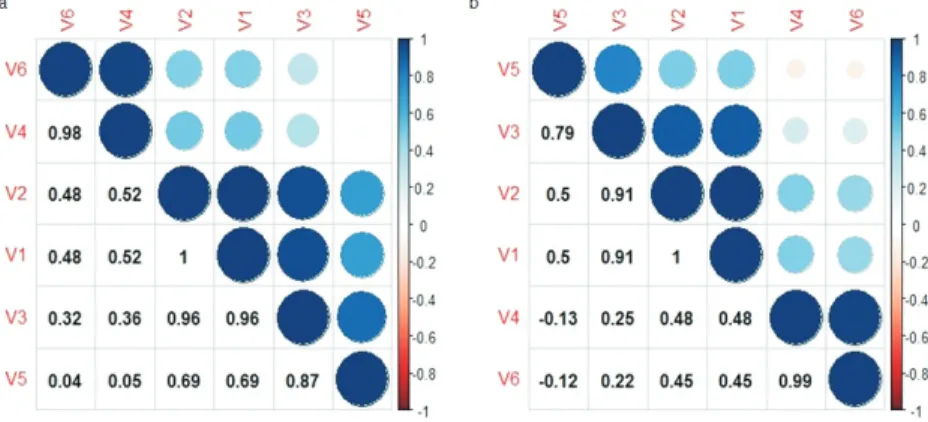
Fig. 4. Correlation Plot for Gabor, (a) Dorsal Dataset; (b) Ventral Dataset.
the left side respectively, when the data distribution is represented graphically, the same has been represented through Eq. (5) γ(s,θ)= μ 3 (s,θ) σ3 (s,θ) (5)
• Contrast(V5)and Kurtosis(V6): Contrast is defined as the separator between darkest and the brightest area of the
image. Contrast is expressed asψ(s,θ)and is mentioned in Eq. (6)
ψ(s,θ)= μ(s,θ) k0.25 (s,θ) (6) wherek(s,θ)= μ 4 (s,θ) σ4
(s,θ) is the Kurtosis or the degree of peakedness in a dataset.
The Texture Feature Dataset (TFD) has been prepared using all the Gabor texture features and has been shown in Eq. (7)
T F D=(V1,V2,V3,V4,V5,V6) (7)
HereV1,V2, . . . ,V6indicate all the 6 different values of Gabor texture features obtained using Eq. (2) to Eq. (6).
In Fig. 4, a correlation plot6 between the different feature variables as computed using Eq. (2) to Eq. (6) has been shown for dorsal dataset in Fig. 4(a) and for ventral dataset in Fig. 4(b) respectively. The basic purpose of showing such a plot is to understand the nature of correlation amongst the feature variables, and also to reduce redundancy and irrelevancy in the dataset. The feature variables which are highly correlated have a fair chance of getting dropped from the final feature list.
In the Fig. 4(a), variableV1is having a correlation value of unity withV2, variableV3is having a correlational value
of 0.96 withV1 andV5is having a correlational value of 0.87. In the Fig. 4(b), variableV2is having a correlational
value of 0.91 with V3 andV3 is having a correlational value of 0.79 withV5. In the Fig. 4, the highly correlated
variables can be considered for dropping them from subset feature set, but their correlation values with each other must be observed before coming to any conclusion. Therefore, there is a need to study the features further through box plots. Figure 5(a) and Fig. 5(b) show the normalized boxplot values obtained for the different feature variable in the dorsal and ventral datasets respectively. The value of variableV1 is an indication for brightness in the image, and is found
to be more in the case of ventral leaf image dataset due to prominent venation pattern observed on the ventral side of the leaf as shown in the Fig. 5(b). The value for variableV2is an indication for uniformity in the pixel intensity level
distribution. It tells about the local homogeneity and is found to be more on the ventral side of the leaf images in the dataset, as shown in the Fig. 5(b).
The value of smoothness is measured through variableV3, an indicator for the standard deviation calculated for the
datasets and has been found to be more on the ventral sides as shown in the Fig. 5(b). The variableV4indicates the pixel
intensity level distribution about the mean in a gray digital image. If the value is zero or near around zero, then it is an indication for equal distribution of pixel intensity on both sides of the mean of the pixel intensity values. A negative value indicates that a large deviation of the pixel intensity data towards the right side of the mean of the pixel intensity values. In this study, both the sides, dorsal and ventral of the leaf images have positive skewness value as shown in the Fig. 5(a) and Fig. 5(b). The high value of variableV5texture feature indicates presence of edges in the images and is
found to be more prominent in the ventral side of the leaf images as shown in the Fig. 5(b). The variableV6texture
feature indicates the peak of the distribution of pixel intensity values around the mean. A high peak in the case of kurtosis indicates that the pixel intensity value distribution is sharp and a low value indicates the flat distribution7and has been found to be more in the dorsal sides as shown in the Fig. 5(a). Therefore, there is a need for some concrete method for identifying suitable feature subset which could not only reduce the dataset but also choose those best set of appropriate features which are unique and uncorrelated and could serve a boon for the classification process.
3. Optimization of Features Using Particle Swarm Optimization
In the Section 2, for each of the 500 leaf images, 32 (8 orientation and 4 scale values as mentioned in Section 2) tuples for six Gabor texture feature values were generated. A total of 8000(32×250 = 8000 tuples) tuples for dorsal and 8000 tuples for ventral images datasets were generated. Therefore, in order to expedite the process of discrimination of leaf images into various classes, there is a need to reduce size of the dorsal and ventral datasets. The popular technique involves the application of feature selection algorithm which shall pick up the most unique feature set and neglect the rest, thereby reducing the dorsal and the ventral dataset and paving a way for convenient, effective and fast discrimination of the images into various classes.
The present study involves the use of PSO (Particle Swarm Optimization) based search method applied under WEKA8. In this study, CFS (correlation based feature selection) is used as subset evaluator. The CFS subset evaluator helps in finding the subset of attributes by considering the individual predictive ability of each feature along the degree of redundancy between them. In this method, only those subset of features are selected which are highly correlated with the class and having low inter-correlation values. CFS is a correlation based filter method and letSbe an attribute subset that has attributes,r e f models the correlation of the attributes to the class attribute,r f f is the inter-correlation between the attributes, the merit is represented in Eq. (8)
meritS=k∗ref/(k+k(k−1)∗r f f) (8) The PSO9based method is utilized to optimize the problem of feature subset selection by iteratively improving the candidate solution with regard to the given measure of quality i.e. improving the predictive accuracy values. PSO uses the population candidate solution to the given problem, called particles. Each particle has velocity and position values. The particles are guided along the search space towards the best known positions, while also being pulled towards their best known local positions. An evaluation function is used to determine the values of positions and also to determine
the best positions with each iteration. As and when new best positions are found in each iteration, the particle values are updated. At every iteration, each particle is updated according to the two valuespbest andgbest(local best and global best values). On the application of PSO-CFS feature subset selection under WEKA, the search method gave three featuresV2,V4 andV6 for the dorsal leaf images. For ventral leaf image Gabor features, the PSO based search
method gave four featuresV1,V2,V4andV6. Now, there are two different feature datasets: PSO based dorsal feature
subset(PDFS) and PSO based ventral feature subset(PVFS) represented through Eqs. (9) and (10) for discriminating the plant specieson the basis of dorsal and ventral sides of the leaf images
P D F S=(V2,V4,V6) (9)
P V F S=(V1,V2,V4,V6) (10)
4. Application of Classification Algorithms
The feature dataset prepared using Eq. (9) and (10) i.e. PDFS and PVFS has been subjected to the process of feature discrimination using K-Nearest Neighbor (KNN), J48, Classification and Regression Trees (CART), Random Forest (RF) using10. The KNN algorithm is a nonparametric parametric algorithm which can deal with both continuous and categorical datasets. J48 is a java based algorithm used for creating decision trees. CART algorithm is a greedy top down binary recursive partitioning technique that divides feature space into heterogeneous rectangular regions. RF is an ensemble classifier technique which builds thousands of trees.
Both PDFS and PVFS have been split into training and test sets in the ratio of 75:25. The training data set contains the class labels, whereas the testing dataset does not contain the class labels. The pre-processing of the data involved centring and the scaling of the data matrix. In the classification procedure, a 10-fold cross validation technique has been applied which is repeated three times for validating any predictive model. Predictive accuracy and kappa values have been adopted as a measurable parameter for the classification process. Kappa is defined as the degree of right predictions of a model. This is originally a measure of agreement between two classifiers i.e. Proportion of observed results,Pr(a)and Proportion of expected results,Pr(e)of data and is calculated with Eq. (11)
κ = Proportion of Observed Results1−Proportion of Expected Results−Proportion of Expected Results (11) In broad terms a kappa below 0.2 indicates poor agreement and a kappa above 0.8 indicates very good agreement beyond chance11.
5. Results and Analysis
On applying four classification algorithms to the two datasets, the results have been presented through graphs in this section.
It has been observed from Fig. 6, that by applying the classification algorithms on the two datasets, the ventral datasets perform better as compared to the dorsal image datasets. The maximum achievable predictive accuracy is 92.09% from PVFS dataset using RF algorithm. The combined accuracy and kappa values for the two datasets have been shown through Fig. 7(a) and Fig. 7(b) respectively. The Fig. 7 represents the resampling results and Fig. 8(a) and Fig. 8(b) represent the difference of the values between the various classification algorithms (RF, J48, KNN, CART) for PDFS and PVFS respectively.
The results obtained for the predictive classification accuracy values have been compared with12and13. The results
obtained by12and13are not directly comparable with the results obtained from present work due to different datasets used, but are comparable on the basis of predictive accuracy results in general.
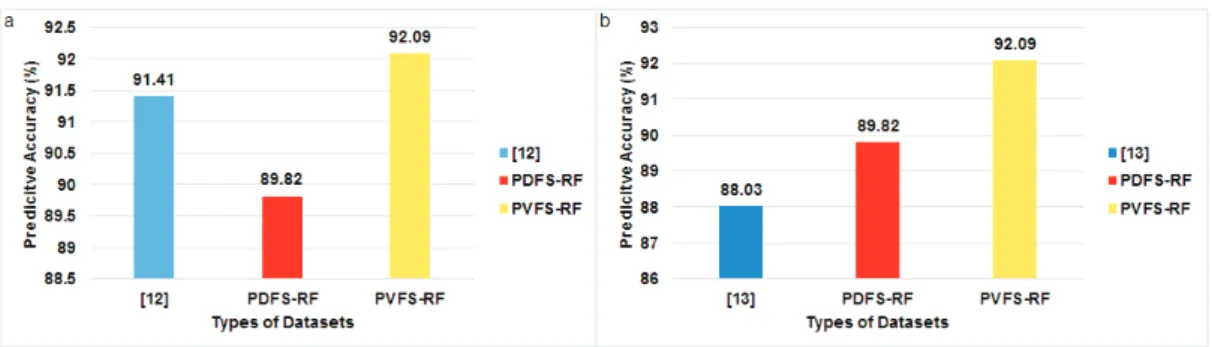
The researchers12have worked with 1200 simple leaves of 30 different plant species to discriminate the different leaf images. This work has extracted shape features like eccentricity, area, perimeter, major axis and minor axis. These features have been passed through probabilistic neural network (PNN) and has obtained a predictive accuracy value as high as 91.41% which is higher than PDFS (89.82%) but lower than PVFS (92.09%). The results have been graphically portrayed through Fig. 9(a).
Fig. 6. Predictive Classification Accuracy Results for PSO based Subset of Features.
Fig. 7. Resampling Results for (a) PDFS; (b) PVFS.
Fig. 9. Comparison of the Present Work with the Work of Researcher, (a)12; (b)13.
The researcher13 has worked with 100 different plant species and has extracted shape features using Fourier descriptors and merged them with other shape features like aspect ratio, roundness factor, irregularity, solidity and convexity. The overall predictive accuracy value achieved by this work is 88.03% using Bayes Classifier, which is lower than the results obtained from PDFS (89.82%) and PVFS (92.09%). The results have been graphically portrayed through Fig. 9(b).
6. Conclusions
By selecting optimized feature subset using PSO-CFS technique, the size of the overall dataset, be it dorsal or ventral has reduced considerably as mentioned in Section 3. On observing the predictive accuracy values obtained for PDFS and PVFS, the PVFS dataset provides better predictive accuracy results as compared to PDFS. Therefore, the objective of this work, to utilize the ventral sides of the leaves has been achieved. This work shows that the ventral side of the leaf images can be another alternative for the extraction of unique features for leaf image classification and the predictive accuracy results for the ventral side are better as compared to the dorsal side, which substantiates the proposition of this work.
References
[1] R. M. Haralick, K. Shanmugam and I. Dinstein, Textural Features for Image Classification,IEEE Transactions on Systems, Man, and Cybernetics, vol. 6, pp. 269–285, (1973).
[2] H. Tamura, S. Mori and T. Yamavaki, Textural Features Corresponding to Visual Perception,IEEE Transactions on Systems, Man and Cybernetics, vol. 8, pp. 460–472, (1978).
[3] Gabor Filter 2015. Available from: URL: https://en.wikipedia.org/wiki/Gabor−filter.
[4] D. Dunn, W. Higgins and J. Wakeley, Texture Segmentation Using 2-D Gabor Elementary Function,IEEE Transactions on Pattern Analysis Machine. Intelligence, vol. 16, pp. 130–149, (1994).
[5] D. Zhang, A. Wong, M. Indrawan and G. Lu, Content-Based Image Retrieval Using Gabor Texture Features, InProceedings of the IEEE Pacific-Rim Conference on Multimedia, University of Sydney, Australia, pp. 91–110, December 13–15 (2000).
[6] T. Wei, Corrplot: Visualization of a Correlation Matrix. R package version 0.73, (2013). Available from: URL: http://CRAN.R-project.org/package=corrplot.
[7] A. Gebejes and R. Huertas, Texture Characterization Based on Gray-Level Co-occurrence Matrix, InProceedings of the International Conference of Informatics and Management Sciences, Catania, Italy, pp. 375–378, March 25–29 (2013).
[8] M. Hall, E. Frank, G. Holmes, Pfahringer B. Reutemann and I. H. Witten, The WEKA Data Mining Software: An Update. ACM SIGKDD Explorations, vol. 11(Pt 1), pp. 10–18, (2009).
[9] R. Poli, J. Kennedy and T. Blackwell, Particle Swarm Optimization: An Overview,Swarm Intelligence, vol. 1(Pt 1), pp. 33–57, (2007). [10] R Development Core Team, R:A Language and Environment for Statistical Computing, R Foundation for Statistical Computing, Vienna,
Austria. ISBN 3-900051-07-0. (2008).
[11] J. Sim and C. C. Wright, The Kappa Statistic in Reliability Studies: Use, Interpretation, and Sample Size Requirements,Physical Therapy, vol. 85(Pt 3), pp. 257–268, (2005).
[12] J. Hossain and M. A. Amin, Leaf Shape Dentification Based Plant Biometrics,Proceedings of 13th International Conference on Computer and Information Technology, IEEE Xplore Press, Dhaka, Bangladesh, DOI: 10.1109/ICCITECHN.2010.5723901, pp. 458–463. December 23–25 (2010).
[13] A. Kadir, Leaf Identification Using Fourier Descriptors and Other Shape Features,Gate to Computer Vision and Pattern Recognition, vol. 1(Pt 1), pp. 3–7, (2015).