Application of Fuzzy Logic on Understanding of
Risks in Supply Chain and Supplier Selection
Thesis submitted in partial fulfillment of the requirements for the Degree of
Master of Technology (M. Tech.)
In
Production Engineering
By
POORNA CHANDU KARUTURI
Roll No. 211ME2349
Under the Guidance of
Prof. SAURAV DATTA
NATIONAL INSTITUTE OF TECHNOLOGY
ROURKELA 769008, INDIA
ii
NATIONAL INSTITUTE OF TECHNOLOGY
ROURKELA 769008, INDIA
Certificate of Approval
This is to certify that the thesis entitled
APPLICATION OF FUZZY LOGIC ON
UNDERSTANDING OF RISKS IN SUPPLY CHAIN AND SUPPLIER SELECTION
submitted by
Sri Poorna Chandu Karuturi
has been carried out under my
supervision in partial fulfillment of the requirements for the Degree of
Master of
Technology
in
Production Engineering
at National Institute of Technology, NIT
Rourkela, and this work has not been submitted elsewhere before for any other
academic degree/diploma.
---
Dr. Saurav Datta
Assistant Professor
Department of Mechanical Engineering
National Institute of Technology, Rourkela
Rourkela-769008
iii
Acknowledgement
It lifts heart to have received expert guidance and support from Dr. Saurav Datta, Assistant Professor, Department of Mechanical Engineering, National Institute of Technology, Rourkela and extend my sincere gratitude towards the same. His meticulous guidance at each phase of this research work has inspired and helped me in innumerable ways. His persistent support throughout my project work helped me in realizing this thesis. It was my greatest honor to work under such a dynamic, young and intellectual Professor. I am greatly indebted for his constant encouragement and valuable advice at every phase of our association.
I would also like to show my sincere thanks to Prof. K. P. Maity, Professor and Head of
the Department, Mechanical Engineering for his support. Also I would like to thank Prof.
S. K. Patel, Associate Professor, Department of Mechanical Engineering, NIT Rourkela, who first inculcated interest in me towards management subject. I am indebted to all professors for their support.
Special thanks to Mr. Chitrasen Samantra who helped me in every aspect regarding my
research work. Also I thank all my classmates who were there with me at all times especially Srihari, Rakesh, Shakti, Kishor, Aditya, Pradeep and many others who encouraged me in my odd times and for their useful assistance and cooperation during the entire course of my work and helping me in all possible ways. Friendly environment and cooperative company I have enjoyed during my stay at NIT Rourkela are memorable and pleasant.
Finally, I would like to express my deepest gratitude to my beloved parents and my brother who made all of this possible, for their endless encouragement, support, love throughout the research period.
Last, but not the least, I offer my regards and thanks to all of those, whose names have not been explicitly mentioned, yet, have supported me in any respect during the completion of this thesis.
iv
Abstract
The aim of this research is firstly to determine the key risk factors of Supply Chain Management (SCM) and developing an efficient model to assess them. In this work, first the risks involved in SCM has been identified and arranged in a systematic hierarchical structure. Questionnaire surveys have been used for data collection from a managerial decision-making group of a case industry. Next, based on the obtained linguistic data, a fuzzy logic based assessment module has been designed for the evaluation of aggregated SC risks. Finally, various risk factors have been categorized; then ranked using ‘fuzzy maximizing and minimizing fuzzy set theory’ in order to identify/assess the major risk factors that need to be managed or controlled.
The present trend in the market is no longer the competition among the enterprises but the supply chain. Supplier selection is the most critical decision of the whole procuring department. Selection of supplier is a complicated decision involving many criteria to take into consideration. In later part, this study tries to rank the suppliers centered on different risks and draw a compromise solution. In order to achieve this, understanding risks is of utmost important. In this work, risks associated with the supplier selection have been recognized and analyzed to rank candidate suppliers based on their affinity to risk using fuzzy based VIKOR method. These risks have varied probability of occurrence and impact on the supply chain. Risks have been represented by linguistic variables and then parameterized by Triangular Fuzzy Number (TFN). Fuzzy risk extent has been calculated and thereby Fuzzy Best Value (FBV) and Fuzzy Worst Value (FWV) have been determined. Fuzzy Utility value has been calculated and utilizing this, ranking has been made by closeness to FBV and farness to FWV. Best alternative has been preferred by maximizing utility group and minimizing regret group.
v
Contents
Items Page Number
Title Sheet I Certificate II Acknowledgement III Abstract IV Contents V List of Tables VI
List of Figures VII
Chapter 1: Background 01-20
1.1 Introduction 01
1.1.1 Supply Chain Risk 01
1.1.2 Suppliers Selection 06
1.2 Supply chain Risk: Prior State of Art 08
1.3 Suppliers Selection: Prior State of Art 17
1.4 Problem Statement 19
Chapter 2: Fuzzy Preliminaries 21-32
2.1 Fuzzy Set Theory 21
2.1.1 Definition of Fuzzy Sets 21
2.1.2 Definition of Fuzzy Numbers 22
2.1.3 Definition of Linguistic Variables 24
2.1.4 The Concept of Generalized Trapezoidal Fuzzy Numbers 24
2.2 Ranking of Fuzzy Numbers 27
2.3 VIKOR Method 29
Chapter 3: Supply Chain Risk Assessment Module 33-49
3.1 Understanding of Risk 33
3.2 Proposed Risk Assessment Module: Case Study 34
3.3 Concluding Remarks 37
Chapter 4: Suppliers Selection Considering Suppliers Risk 50-63
4.1 Suppliers Selection by VIKOR Method 50
4.2 Proposed Supplier Selection Module 50
4.3 Numerical Illustration 53
4.4 Concluding Remarks 55
vi
List of Tables
Tables Page
Number
3.1 Supply Chain Risk Assessment Module 39
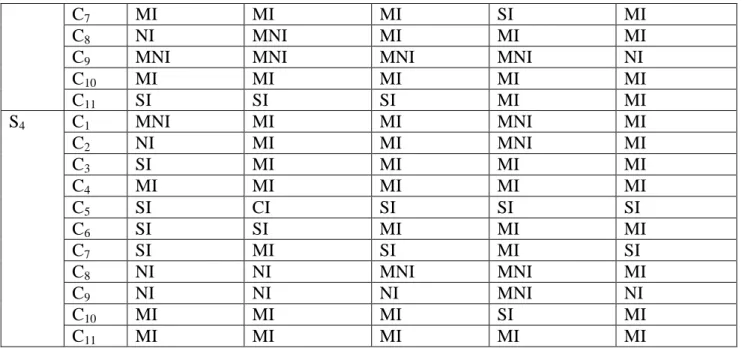
3.2 Definitions of Linguistic Variables for Expert Judgment (A 7- member linguistic term set) 40 3.3 Risk Impact of 2nd Level Indices Assigned by the DM’s using Linguistic Terms 41 3.4 Likelihood of Occurrence of 2nd level Assigned by the DM’s using Linguistic Group 42 3.5 Aggregated Fuzzy Likelihood of Occurrence as well as Risk Impact of 2nd level Indices. 44 3.6 Computed Risk Extent of 1st level Indices 45 3.7 Ranking of Risk Sources/Indices (at 2nd level) 46 4.1 Different Risk Sources in Relation to Suppliers Performance 56 4.2 Probability and Impact Assessment Scale 56
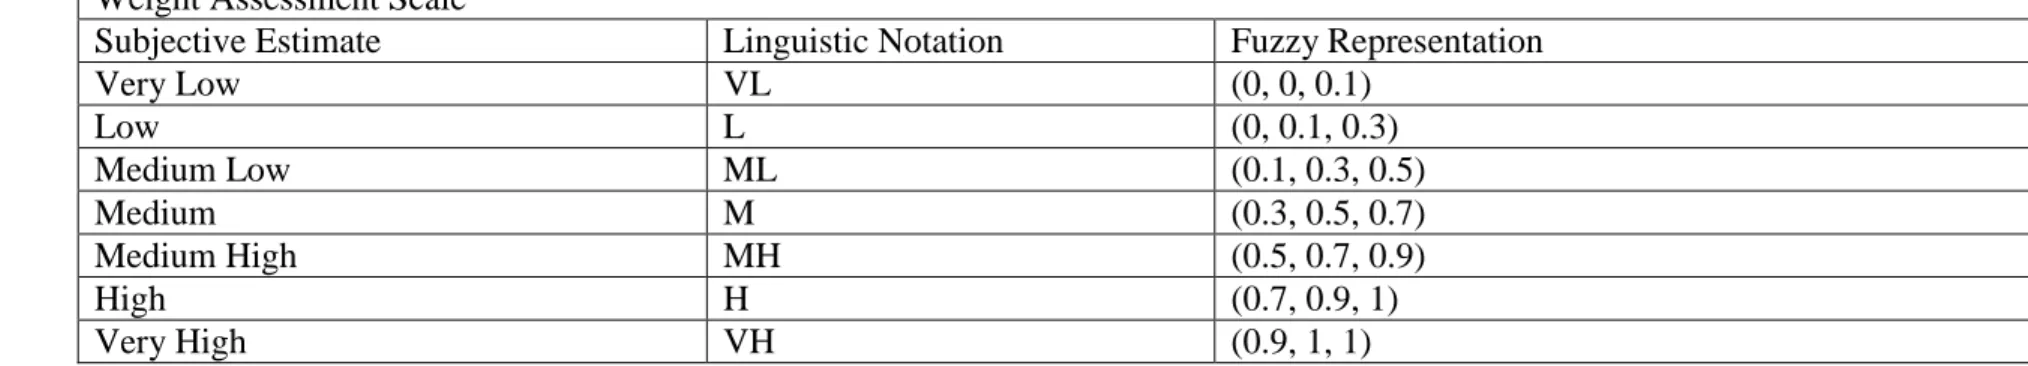
4.3 Weight Assessment Scale 57
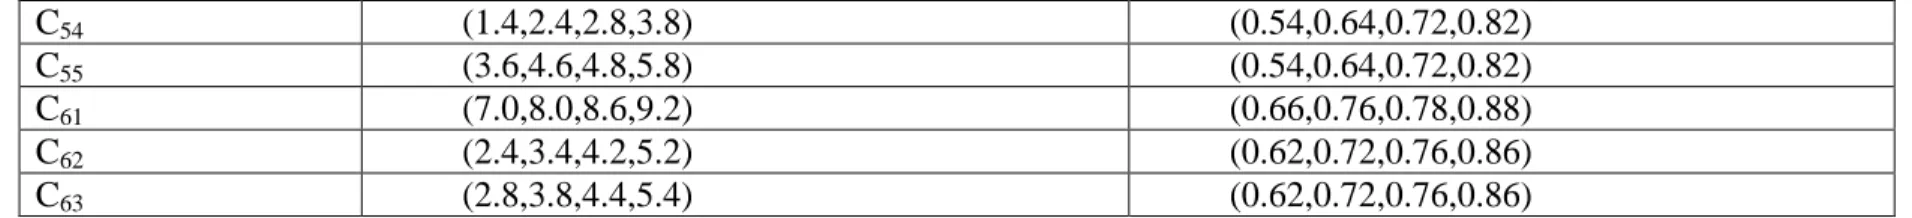
4.4 Priority Weight Assigned by Decision Makers Group 57 4.5 Risk Impact Assigned by Decision Makers group 58 4.6 Likelihood/(Probability of Occurrence) of Risk Assigned by the Decision Making Group 59 4.7 Priority Weight Assigned by the Decision Making Group Represented by Fuzzy Numbers 61 4.8 Risk Extent for each of the Criteria Expressed in Crisp Values 62 4.9 Best and Worst Values of the Criteria Ratings 62 4.10 Computation of ‘Q’, ‘R’, and ‘S’ Values 62
4.11 Computed’ S* ‘and ‘S-‘ Values 63
vii
List of Figures
Figures Page Number
2.1 A Fuzzy Number n~ 22
2.2 A Triangular Fuzzy Number A~ 23
2.3 Trapezoidal Fuzzy Number A~ 25
3.1 Pictorial Representation on Ranking Various Risk Indices (at 2nd level) 48 3.2 Bar Diagram representing Ranking order of Various Risk Indices of 2nd Level 49
1 | P a g e
Chapter 1: Background
1.1.
Introduction
1.1.1
Supply Chain Risk
Swiftness in the change/ mutation of manufacturing and marketing techniques led the organizations to think of possible alternatives. With the increase in sophistication in techniques, every organization tries to achieve competitive advantage and gain market share. Under these circumstances, organizations are forced to increase productivity further and further more. This results in production of high quality products or services at economic costs. Under these criteria, achieving profits is a mere possibility. Therefore, the organization has to look for alternative areas to achieve profits and also to increase market share. This led them to focus on concepts of management, related to supply of raw materials, inventory control, production, logistics, distribution and delivery to the customers. Bringing all these under one roof led them towards supply chain. Besides its benefits, comes greater complexity and risks in the supply chain. These risks are inevitable. However, they can be mitigated by supply chain risk identification, evaluation and control. Thus, risk evaluation has become an important part of today’s Supply Chain Management (SCM).
Supply chain management involves a set of approaches used to efficiently incorporate suppliers, manufacturers, warehouses and distribution centers so that the product is produced and distributed in the quantity to the right locations and at the right time when there is market demand. For achieving this, there should be co-ordination and communication among all the members of the supply chain network.
Key factors to have an effective SCM are effective flow of information, communication, cooperation and trust among various members of the supply chain. The only goal with the SCM
2 | P a g e
is to respond to uncertainties in customer demand without incurring any additional costs for carrying inventory. SCM has to cope with uncertainties like demand forecast errors, variation in travel times, weather and natural catastrophe, breakdown of machines, war etc., labour conditions, local politics, border issues etc. SCM must try to understand and manage various activities within SC in a systematic manner [Berenji and Anantharaman, 2011].
Supply chain management increases the efficiency of supply chain, along with it added risk. SCM involves an ocean of decisions regarding selection of supplier, logistics, quantity, distributors etc. These decisions are to be made to improve profit and productivity for the organization also contains certain amount of risk. These risks are inevitable and so effort should be made to mitigate them. The main aim of the Supply Chain Risk Management (SCRM) is to check the optimality for both efficiency and underlying risk. Its aim is to subdue risks, so that they don’t affect the proper functionality of existing supply chain. It means decreasing the vulnerability of a supply chain, increasing its ability to withstand unexpected adverse issues, improving sustainability or increasing resilience [Norrman and Jansson, 2004].
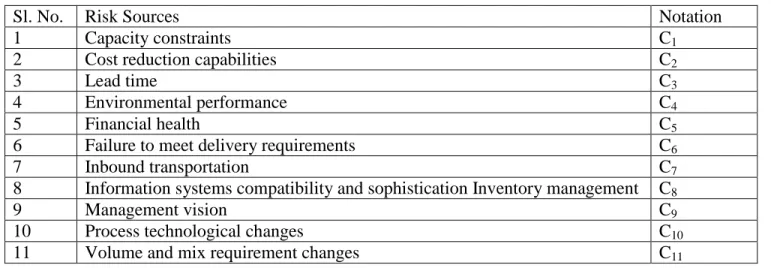
For in depth understanding of supply chain risks; different risks (risk sources) involved in supply chain as classified by Berenji and Anantharaman (2011) have been reported below. Supply chain risks were classified majorly into six categories viz. Supply risks, Demand risks, Operational risks, Social/political risks, Competitive/economic risks and Control & plan risks.
Supply risks: Any risk that involves the raw materials or semi-finished goods or finished goods
that are to supplied to the next level in the supply chain comes under supply risk. The problem may be delay or insufficiency or low quality of raw material. This may result due to many reasons. An exclusive supplier having a problem directly impacts the organization. The risk of bankruptcy may extend from a little disruption to shutdown of company. Keeping track of
3 | P a g e
financial records of critical suppliers and searching for alternative suppliers or providing some aid to them might help. Cargo damages are manageable if the quantity is less and parts are not damaged beyond they can be repaired. But if it is the other way results increase in per part cost as well as insufficiency of parts. Its sub categories include:
1. Materials quality 2. Supplier satiation 3. Global sourcing 4. Exclusive supplier 5. Delivery times 6. Cargo damages 7. Bankruptcy of supplier
Demand risks: the factors that influence the change in demand results in demand risk. Various
factors that might affect demand may be sales withdrawal by customers, changes in the market demand either increase or decrease, changes in the product requirement etc. These should be handled very carefully and if not incurs a loss of expenditure through idling of workers and machinery, increase in inventory carrying etc. during decrease in demand and while increase, there occurs an increase in lead time resulting customer dissatisfaction. To mitigate this kind of risks proper alignment of production with demand has to be made. To cope with changes in product requirement, frequent market survey has to be done. Under this sub categories include:
1. Sale withdrawal
2. Market demand changes 3. After sale service
4 | P a g e
4. Changes in product preferences 5. Non-flexibility
Operational risks: The risks associated with planning and manufacturing comes under
operational risk. These risks may include human error resulting defective parts, improper planning of production line which might result halt in assembly line. Changes in product design or changes in production technology might need reordering of production line in the workshop or modified machinery needing operating personnel training. Problems with the supplier when the raw material has to be changed and his contract tenure left. Searching for a new supplier or old one being transformed takes time. This produces discontinuities in supply chain. This further can be categorized into:
1. Changes by employer
2. Changing production technology 3. Human error
4. Sharing comments among departments 5. Changes in product design and engineering 6. Operation quality
Social/Political risks: Political risk is the kind of risk occurs when there happens to be changes
in political scenario or policies. Shifting of government might result in many changes in taxing policies etc. Globalizations being the trend, political changes around the world that adversely affect, create disruptions in supply chain. Cancelation of export/import licenses lead to excess of goods required for the local market requires idling. Power sanctions might alter according to the
5 | P a g e
availability results breakdown of plant causing disruptions in supply chain. This sub categorized into:
1. Agreement terms and type 2. Losing personnel
3. Grey propaganda in public 4. Socio political lobby 5. Sanctions
6. Controlling export/import 7. Custom delays and damages
Competitive/economic risk: The risk which incurs loss to Supply Chain due to changes in
economic factors like exchange rate changes, collapse of stock market or increase in the inflation rate. This risk can be called as external risk. The organization has nothing to do for avoiding these situations. So, it can only be design of Supply Chain so that it can cope with such situations. Its sub categories include:
1. Inflation rate
2. Partners bankruptcy 3. Stock market crash 4. Exchange rate changes 5. Financial crises
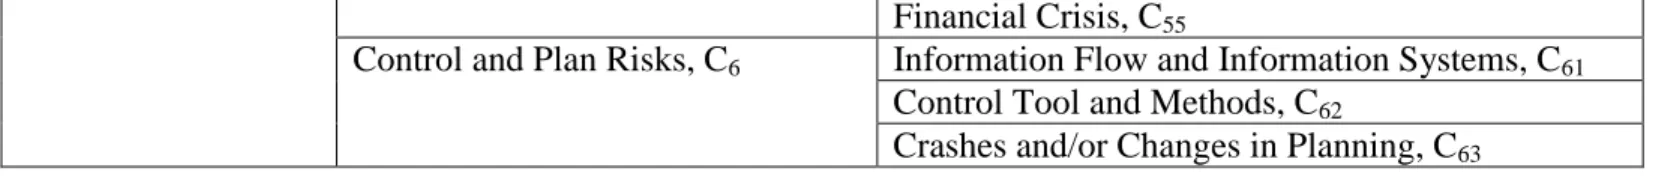
Control/Plan risk: The risks associated with changes of managerial decision or crashes in
operational schedule planning or failure of control tools/methods comes under this. Flaws in decision making or external agents forcing change yield to modify the production processes or
6 | P a g e
schedules. This causes delays and break in supply chain. Supply chain should be designed to subdue these situations. This again sub categorized as:
1. Information flow and information systems 2. Control tools and methods
3. Crashes and/or changes in planning
1.1.2
Suppliers Selection
Supplier selection is an important decision-making process in supply chain management. Different suppliers have varied ‘pros and cons’ associated with them. Therefore, selecting an appropriate supplier is always a difficult task. Supplier section has a major impact on proper functioning of supply chain as well as product quality. Selection of right supplier improves the efficiency of supply chain and significantly increases corporate competitiveness. Organizations must be very cautious not only about price and quality of raw material but also about the structure of the organization, production capabilities, reliability, company policy etc. For some cases, it is not only enough to look at supplier conditions but also suppliers’ supplier reliability and capability. For the case of Just in Time (JIT) manufacturing, supplier selection is of utmost importance.
Today at an average manufacturer spends approximately half its revenue to purchase goods and services, thus making a company’s success reliant on their interactions with suppliers. The role of procurement managers within companies has become particularly important. Supplier selection involves the congregation of decisions made by different organizational levels in the company. Each level or each department may have their own priorities based on their ease of manufacturing. Taking all these into study, one cannot have an optimal solution. So, in selecting
7 | P a g e
an appropriate supplier, one has to consider all these requirements and should take a compromising decision. With much of company’s money being spent and increasing dependency on the outsourcing of many critical and complex parts, the role of buyer is not only critical but also challenging. Buyers must define and calculate what will be the best value means for the buying organization, and undertake procurement actions accordingly. To identify the best value, the procurement manager must have a common meeting with technical, operations and legal experts within the company, and should be a professional negotiator and director across many internal and external parties.
Supplier selection is the process by which the buyer identifies, estimates, and deals with suppliers. The challenges mentioned make supplier selection a rich topic for industrial operations and management disciplines.
To cope with the growing competition it isn’t enough only to select from the existing or known suppliers but the management should be able to identify new suppliers. New supplier identification is so important that it might a novel production technology or may have structural advantage or low labor cost which ultimately impact the cost of the product and may be able to supply it for cheaper than any other or may be able to deliver with lesser lead time that might allow to maintain minimum inventory which reduces expenses for maintenance as well as money will be put to best use.
Again there involves a key factor for selection of suppler i.e. risk associated with them. Supplier risk is more important than any because it directly affects the buyer in all aspects of production involving that part or operation that has to be done only after the part is assembled. These situations may lead to complete halt of the company incurring huge loss in the form of
8 | P a g e
manufacturing holiday, idling of labor, loss of customer faith etc. Sometimes it can be even worse and might lead to lockup of the factory.
Therefore, supplier selection, evaluation and monitoring are crucial for an industry to survive in long term. Ranking of suppliers becomes complex when suppliers must be evaluated across multiple dimensions/ evaluation indices. For example, if the buyer wishes to evaluate suppliers’ bids on the extents of price and lead-time, the buyer must build a trade-off between these two dimensions to determine whether it favors, say, a bid with a high price and less lead time to a bid with a low price and higher lead time. The real challenge of supplier evaluation lies in constructing this tradeoff in a way that perfectly reflects the buyer’s preferences (Srividhya and
Jayaraman; 2007; Beil, 2010).
1.2.
Supply Chain Risk: Prior State of Art
Risks in supply chains represent one of the major business issues today. Since every organization strives for success and uninterrupted operations, efficient supply chain risk management is very crucial (Jereb et al., 2012). The following section provides results of in depth literature review on supply chain risk management and related aspects.
Zsidisin (2003) provided a grounded definition of supply risk. The study focused on the sources
of supply risk, emanating from individual supplier factors and market characteristics, and the outcomes of supply risk events, which involved the inability of purchasing firms to meet customer requirements and threats to customer life and safety. Findings from this research provided practitioners and academicians a starting point for understanding supply risk and insights as to how supply risk could negatively affect business operations. Jüttner et al. (2003)
9 | P a g e
vulnerability and risk management was reviewed and compared with findings from exploratory interviews undertaken to discover practitioners’ perceptions of supply chain risk and current supply chain risk management strategies.
Hallikasa et al. (2004) focused on risk management in supplier networks. The primary aim was
to illustrate challenges that network co-operation brings to risk management. The paper outlined the general structure of the risk management process and presented methods for risk management in a complex network environment. The results indicated that risk management was an important development target in the studied supplier networks. When the dependency between companies increased, they became more exposed to the risks of other companies. The presented processes facilitated understanding and managing of uncertainties and risks in supplier networks. Norrman and Jansson (2004) reported that supply chain risk management (SCRM) was of growing importance, as the vulnerability of supply chains increased. The main thrust of this article was to describe how Ericsson, after a fire at a sub-supplier, with a huge impact on Ericsson, had implemented a new organization, and new processes and tools for SCRM. The approach described here tried to analyze, assess and manage risk sources along the supply chain, partly by working close with suppliers but also by placing formal requirements on them. This explorative study also indicated that insurance companies might be a driving force for improved SCRM. The article concluded with a discussion of risk related to traditional logistics concepts (time, cost, quality, agility and leanness) by arguing that supply chain risks should also be put into the trade-off analysis when evaluating new logistics solutions-not with the purpose to minimize risks, however, but to find the efficient level of risk and prevention.
Kleindorfer and Saad (2005) reported two broad categories of risk affecting supply chain design
10 | P a g e
(2) risks arising from disruptions to normal activities. This paper was concerned with the second category of risks, which might arise from natural disasters, from strikes and economic disruptions, and from acts of purposeful agents, including terrorists. The paper provided a conceptual framework that reflected the joint activities of risk assessment and risk mitigation that were fundamental to disruption risk management in supply chains.
Faisal et al. (2006) presented an approach to effective supply chain risk mitigation by
understanding the dynamics between various enablers that helped to mitigate risk in a supply chain. Using interpretive structural modeling, the research presented a hierarchy-based model and the mutual relationships among the enablers of risk mitigation. Gaudenzi and Borghesi
(2006) provided a method to evaluate supply chain risks that stand in the way of the supply chain
objectives. An analytical hierarchy process model was proposed to identify supply chain risk factors with a view to improving the objective of customer value. The two phases of the method were the prioritization of supply chain objectives; and the selection of risk indicators. Wu et al.
(2006) aimed to reinforce inbound supply chain risk management by proposing an integrated
methodology to classify, manage and assess inbound supply risks. Inbound supply risk factors were identified through both an extensive literature review as well as a series of industry interviews. A hierarchical risk factor classification structure was created with an analytical hierarchy processing (AHP) method to rank risk factor for suppliers. Tang (2006) reviewed various quantitative models for managing supply chain risks. A unified framework was developed for classifying SCRM articles. This review could serve as a practical guide for some researchers to navigate through the sea of research articles in this important area. By highlighting the gap between theory and practice, the study might motivate researchers to develop new models for mitigating supply chain disruptions.
11 | P a g e
Kumar and Viswanadham (2007) suggested the framework of a Decision Support System (DSS)
adopting Case-Based Reasoning approach; which could support decision makers in preventive as well as interceptive construction supply chain risk management. Badr and Stephan (2007)
proposed a framework to bridge the gap between security concerns and risk management in a supply chain; typically, the Supply Chain Operations Reference (SCOR) model. The framework extended risk management with security awareness by proposing roles for each process in SCOR. Its underlying approach focused on the types of threats in SCOR implementation projects and applied empirical benchmarks to measure risks in processes with respect to the security-oriented framework.
Liu and Wang (2008) assumed that supply chain risk evaluation is a multi-criteria decision making problem under fuzzy environments. To tackle the problem, this paper firstly identified and discussed some of the important and critical decision criteria and constructed the evaluation indicator framework. This paper presented a modified grey relational analysis method based on the concepts of ideal and anti-ideal points. Iranmanesh et al. (2008) explored fuzzy analytical hierarchy process (FAHP) as a means of risk evaluation methodology to prioritize and organize risk factors faced in IT projects. A real case of IT projects, a project of design and implementation of an integrated information system in a vehicle producing company in Iran was studied. Related risk factors were identified and then expert qualitative judgments about these factors were acquired. Translating these judgments to fuzzy numbers and using them as an input to FAHP, risk factors were then ranked and prioritized by FAHP in order to make project managers aware of more important risks and enable them to adopt suitable measures to deal with these highly devastative risks.
12 | P a g e
Russell and Smith (2009) provided a literature review on reversing supply chain outsourcing and
framed the sourcing decision in terms of multiple options, including multi- sourcing, near sourcing, and in-sourcing. A decision tree model was presented to aid the decision maker in evaluating the expected value of various sourcing decisions when risks and returns were explicitly considered. Trends and conditions that influenced the outsourcing decision were also discussed. Trkman and McCormack (2009) presented preliminary research concepts regarding a new approach to the identification and prediction of supply risk. This approach to the assessment and classification of suppliers was based on supplier’s attributes, performances and supply chain characteristics, while it was also modified by factors in the supplier’s specific environment. The challenges posed to supply chains due to a turbulent environment (both from within the industry and external influences) were examined. A new method for the assessment and classification of suppliers based on their characteristics, performances and the environment of the industry in which they operate was presented. Pujawan and Geraldin (2009) provided a framework to proactively manage SC risks. The framework would enable the company to select a set of risk agents to be treated and then to prioritize the proactive actions, in order to reduce the aggregated impacts of the risk events induced by those risk agents.A framework called house of risk (HOR) was developed, which combined the basic ideas of two well-known tools: the house of quality of the quality function deployment and the failure mode and effect analysis. The framework consisted of two deployment stages. HOR1 was used to rank each risk agent based on their aggregated risk potentials. HOR2 was intended to prioritize the proactive actions that the company should pursue to maximize the cost-effectiveness of the effort in dealing with the selected risk agents in HOR1.
13 | P a g e
Moeinzadeh and Hajfathaliha (2010) aimed to reinforce SC risk management by proposing an
integrated approach. SC risks were identified and a risk index classification structure was created. Then, the authors developed a SC risk assessment approach based on the analytic network process (ANP) and the VIKOR methods under the fuzzy environment where the vagueness and subjectivity were handled with linguistic terms parameterized by triangular fuzzy numbers. By using FANP, risks weights were calculated and then inserted to the FVIKOR to rank the SC members and find the most risky partner. Tuncel and Alpan (2010) aimedto show how a timed Petri nets framework could be used to model and analyze a supply chain (SC) network which was subject to various risks. The method was illustrated by an industrial case study. We first investigated the disruption factors of the SC network by a failure mode, effects and criticality analysis (FMECA) technique. The authors then integrated the risk management procedures into design, planning, and performance evaluation process of supply chain networks through Petri net (PN) based simulation. The developed PN model provided an efficient environment for defining uncertainties in the system and evaluating the added value of the risk mitigation actions. The findings of the case study showed that the system performance could be improved using risk management actions and the overall system costs could be reduced by mitigation scenarios.
et al. (2011) studied to identify and assessing the risk in supply chain using Fuzzy Analytic Network Process (for allocating weights to risk factors) and Fuzzy TOPSIS (for ranking the supply chain members). Ebrat and Ghodsi (2011) aimed at determining the key risk factors of construction projects in Iran and developing an intelligent system to assess them. In this research, first the risks involved in construction projects were identified and arranged in a systematic hierarchical structure. Next, based on the obtained data a network was based on the adaptive
14 | P a g e
fuzzy system was designed for the evaluation of project risks. The results showed that the ANFIS models were more promising in the assessment of construction projects risks. Azari et al. (2011)
used the fuzzy TOPSIS method, and provided a rational and systematic process for developing the best model under each of the selection criteria. Decision criteria were obtained from the nominal group technique (NGT). The proposed method could discriminate successfully and clearly among risk assessment methods. Shemshadi et al. (2011) investigated a new novel approach for this problem based on ANP and fuzzy TOPSIS methods while it took into account the risk factor solely regarding the decision maker’s venture strategy. In addition to an ANP model that determined the effects of decision criteria, in the said approach, a set of five risk categories was deployed to affect the decision maker’s choice by normalizing the weights of risk criteria. Ravasizadeh et al. (2011) proposed a model integrated fuzzy Delphi, fuzzy AHP and VIKOR under fuzzy environment methods towards identifying and evaluating E-Supply Chain Risks. The authors contributed E-supply chain risk by identifying thirteen critical criteria for evaluating suppliers’ risk. The findings showed that four criteria; the extent of acceptable information, interrelationship risk, lack of honesty in relationships and product quality and safety were the most important for evaluating suppliers’ risk. Pfoh et al. (2011) reported the potentiality of structural analysis for supply chain risks. It demonstrated how interpretive structural modeling (ISM) supported risk managers in identifying and understanding interdependencies among supply chain risks on different levels (e.g. 3PL, first-tier supplier, focal company, etc.).
Danaa et al. (2011) presented a model of risk control in equipment manufacturing supply chain.
The authors provided a solution methodology using unascertained mathematics and fuzzy theory to measure risk in electronic manufacturing supply chain; the model combined the unascertained theory with fuzzy method. The authors constructed the model considering the occurrence
15 | P a g e
probability and the loss magnitude of risk simultaneously in single model using risk utility function. In this model, the unascertained mathematical was applied to measure occurrence probability of electronic manufacturing supply chain risk, and the fuzzy theory was utilized to solve loss magnitude caused by electronic manufacturing supply chain risk, then the whole risk of electronic manufacturing supply chain was given according to the mean of risk by the utility function of the risk probability and the risk loss. A key process involved in supply chains is a priori evaluation of potential partners, not only in terms of expected cost (which includes exchange rate risk), but also in terms of other risks. These risks can include product failure, producing company failure (such as bankruptcy), and even political risk. Olson and Wu (2011)
aimed to compare tools to aid supply chain organizations in measuring, evaluating, and assessing risk in this environment. The authors demonstrated the use of DEA, followed by a DEA simulation model and also a Monte Carlo simulation using a risk-adjusted cost concept. Once non-dominated partners were identified by DEA, simulation analysis was applied to compare expected performance of vendors, and the range of expected outcomes could be identified, aiding supply chain core organizations to better select producing partners. Thun and Hoenig (2011)
reported the empirical analysis of supply chain risk management practices based on a survey with various manufacturing plants conducted in the German automotive industry. After investigating the vulnerability of supply chains in general and examining key drivers of supply chain risks, the paper identified supply chain risks by analyzing their likelihood to occur and their potential impact on the supply chain. The results were visualized in the probability-impact-matrix distinguishing between internal and external supply chain risks.
Shameli-Sendi et al. (2012) presented a practical model for information security risk assessment.
16 | P a g e
integrated fuzzy inference methodology with failure modes effects analysis (FMEA) to develop a two stage risk assessment model. The first stage systematically identified potential risks in DC, employing the FMEA method. The second stage evaluated risk by using a risk inference expert system, developed in this study, to obtain the risk priority number (RPN). The RPN of a given failure mode was evaluated using three indexes: degree of severity, frequency of occurrence, and chance of detection. Chen (2012) explained the financial innovation service product-fundamental mode of supply chain finance, and explored the risk of supply chain finance. Fuzzy ordinal regression support vector machine was used to analysis the risk of supply chain finance by the index system of risk assessment.
Vosooghi (2012) identified main risks related to crude oil supply chain and implements fuzzy analytic hierarch process (FAHP) for weighing them. The results showed that the most important risk area was the regulatory and environmental risks and that the transference and cooperation policy was rated as the best response strategy. The paper provided a comprehensive framework of risks that need to be considered in crude oil supply chain risk management (SCRM) context; and it illustrated that how various risks and risk management strategies could be assessed through the FAHP approach to aid managers in their decision making processes. Cunbin and
Peng (2012) proposed a new modeling method based on trapezoidal fuzzy number FAHP to
solve the problem of risk element transmission in enterprise project evaluation chain. The authors firstly put forward enterprise project chain risk element transmission and constructed enterprise project chain risk element transmission tetrahedron model and then proposed the theory of enterprise project evaluation chain risk element transmission based on trapezoidal fuzzy number FAHP.
17 | P a g e
Vilkon and Hallikas (2012) presented concepts and findings concerning the identification and analysis of risks in multimodal supply chains. This research approach was holistic, and incorporated perspectives from different parts of the chain. The multimodal maritime supply chain in focus runs from the Gulf of Finland to the Finnish mainland. The authors mapped the process and the structure, and presented a framework for categorizing the risks in terms of their driver factors in order to assess the overall impact on the performance of the supply chain. Finally, the authors analyzed the risk impacts in terms of delays in the chain by means of Monte-Carlo-based simulation. Ohmori and Yoshimoto (2012) discussed how to manage supply-chain disruption risks from natural disasters or other low-likelihood-high-impact risk drivers. In this paper, the authors described a framework for assessing how much individual mitigation strategies had the impact on the entire supply-chain protection against disruption, using network reliability. The authors proposed three categories of risk-mitigation approaches: Stability, Absorb, and Alternative. With a clear understanding of relations between these mitigation strategies and the entire supply-chain risks, mangers could select effective risk-reduction approaches to their supply-chain.
1.3.
Suppliers Selection: Prior State of Art
Supplier selection is the process by which firms identify, evaluate, and contract with suppliers. The supplier selection process deploys a tremendous amount of a firm’s financial resources. In return, firms expect significant benefits from contracting with suppliers offering high value (Beil, 2009). Supplier selection is the process by which the buyer identifies, evaluates, and contracts with suppliers. The challenges mentioned above make supplier selection a fertile topic for operations and management science disciplines. There is also a growing audience for such
18 | P a g e
research, as the importance of fostering talent by employing buyers with analytical expertise, general management backgrounds, and deep knowledge in a particular purchasing category becomes widespread (Reinecke et al. 2007).
Hallikas et al. (2004) provided the general structure of risk management methods in a complex
network environment. This study helped to understand the risk of other companies thus facilitate in choosing the right supplier.
Chen et al. (2006) applied a hierarchy multiple criteria decision-making (MCDM) model based
on fuzzy-sets theory to deal with the supplier selection problems in the supply chain system. According to the concept of the TOPSIS, a closeness coefficient was defined to determine the ranking order of all suppliers by calculating the distances to the both fuzzy positive-ideal solution (FPIS) and fuzzy negative-ideal solution (FNIS) simultaneously. Finally, an example was shown to highlight the procedure of the proposed method.
Chan and Kumar (2007) discussed some critical decision-making criteria along with the risk
factors for development of an effective structure for selection of appropriate supplier. Fuzzy
extended Analytic Hierarchy Process (FAHP) was used to handle the different criteria of suppliers’ selection like cost, service, quality, and risk profile of the supplier.
Levary (2008) used analytical hierarchy process to evaluate and rank potential suppliers.
Ranking was done among the potential foreign customers based on several criteria of supply chain reliability including potential risk of the supplier. Trkman and McCormack (2009)
presented concepts based on suppliers’ attributes, performances and supply chain characteristics which also depended on the supplier’s specific environment in which they were supposed to operate, for the assessment and classification of suppliers.
19 | P a g e
Guo et al. (2009) introduced a potential support vector machine technology combined with
decision tree to address issues on supplier selection including feature selection, multiclass classification etc. Ravindran et al. (2010) presented a risk classification and quantification method for optimizing supplier section. Risk quantification involves separation of risk into ‘value at risk’ (VaR) and ‘miss the target’ (MtT). Extreme value theory was proposed to quantify VaR type and Taguchi’s loss functions for MtT type risks. These were used as objectives in the multi-criteria models and solved for supplier selection.
Keskin et al. (2010) applied Fuzzy Adaptive Resonance Theory (ART)’s classification ability to
the supplier evaluation and selection area. The proposed selection method, using Fuzzy ART not only selected the most appropriate supplier(s) and also clustered all of the vendors according to chosen criteria. To explain the Fuzzy ART method a real-life supplier selection problem was solved and suppliers were categorized according to their similarities. The obtained results showed that the proposed method was well suited as a decision-making tool for supplier evaluation and selection problem.
Shemshadi et al. (2011) proposed a hybrid model based on ANP and fuzzy TOPSIS for
improving the solution for the supplier selection problem. This method utilized ANP to determine weights and risk impact and final solution based on TOPSIS method.
1.4.
Problem Statement
In the present context, supply chain risk evaluation is seemed to be a Multi-Criteria Decision Making (MCDM) problem under complexity and vagueness. To tackle the problem, this study explores fuzzy evaluation of the decision criteria (measures and metrics/dimension of risk or different risk sources) and constructs the evaluation indicator framework to measure aggregated
20 | P a g e
risk involved with organizations and their supply chains. In this method, the risk related information has been partially known (incomplete, inconsistent and imprecise) and the vagueness and subjectivity have been handled with linguistic terms parameterized by trapezoidal fuzzy numbers. A fuzzy-based risk assessment module has been developed in this reporting.
Suppliers’ risk is one of the crucial components in supply chain risks. Appropriate suppliers selection decision-making can mitigate such risks. The objective of supplier selection is to reduce purchasing risk, maximize overall value to the purchaser and build a long term, reliable relationship between buyers and suppliers.
Many methods have been proposed and used for supplier evaluation and selection; most of them try to rank the suppliers from the best to the worst and to choose the appropriate supplier(s). Supplier evaluation and selection is a complex and typical multi criteria decision-making problem. Because of human judgment needs in many area of supplier selection such as preferences on alternatives or on the attributes of suppliers or the class number and borders supplier selection becomes more difficult and risky (Keskin et al., 2010).
In order to facilitate suppliers’ selection decision-making considering suppliers’ risk, the study proposes application of VIKOR method in fuzzy environment. Numerical illustration demonstrates application feasibility of the said approach towards effective suppliers’ selection. The objectives of this research are two-fold:
1. To develop an efficient supply chain risk assessment module in fuzzy context.
2. To develop an efficient decision support system using fuzzy logic and VIKOR concept towards appropriate suppliers’ selection and to cope up with suppliers’ risk.
21 | P a g e
Chapter 2: Fuzzy Preliminaries
2.1 Fuzzy Set Theory
To deal with vagueness in human thought, Lotfi A. Zadeh (1965) first introduced the fuzzy set theory, which has the capability to represent/manipulate data and information possessing based on non statistical uncertainties. Moreover fuzzy set theory has been designed to mathematically represent uncertainty and vagueness and to provide formalized tools for dealing with the imprecision inherent to decision making problems. Some basic definitions of fuzzy sets, fuzzy numbers and linguistic variables are reviewed from Zadeh (1965; 1975), Buckley (1985), Negi
(1989), Kaufmann and Gupta (1991).The basic definitions and notations below will be used
throughout this thesis until otherwise stated.
2.1.1 Definitions of fuzzy sets:
Definition 1. A fuzzy set A~in a universe of discourse X is characterized by a membership
function A~
x which associates with each element xin X a real number in the interval
0,1 . The function valueA~
x is termed the grade of membership ofxinA~(Kaufmann and Gupta,1991).
Definition 2. A fuzzy setA~in a universe of discourseX is convex if and only if
1 2
~
1 ~ 2
~ x (1 )x min x , x A A A (2.1) For all x1,x2inX and all
0,1 , where mindenotes the minimum operator (Klir and Yuan, 1995).22 | P a g e
Definition 3. The height of a fuzzy set is the largest membership grade attained by any element
in that set. A fuzzy set A~in the universe of discourse X is called normalized when the height of A~is equal to 1 (Klir and Yuan, 1995).
2.1.2 Definitions of fuzzy numbers:
Definition 1. A fuzzy number is a fuzzy subset in the universe of discourseX that is both convex
and normal. Fig. 2.1 shows a fuzzy number n~ in the universe of discourseX that conforms to this definition (Kaufmann and Gupta, 1991).
Fig. 2.1. A fuzzy numbern~
Definition 2. The-cut of fuzzy number n~ is defined as:
x x x X
n i : n i , i ~ ~ , (2.2) Here
0,1 .The symboln~represents a non-empty bounded interval contained inX , which can be denoted byn~
nl,nu
,
l
n andnu are the lower and upper bounds of the closed interval, respectively
(Kaufmann and Gupta, 1991; Zimmermann, 1991). For a fuzzy numbern~ , if nl 0and 1
u
n
for all
0,1 , then n~ is called a standardized (normalized) positive fuzzy number (Negi, 1989).23 | P a g e
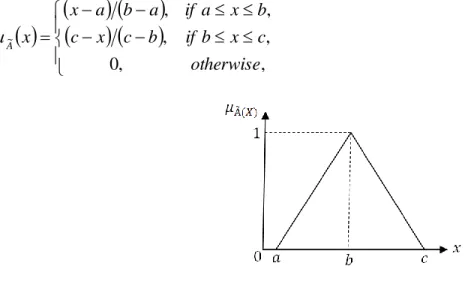
Definition 3. Suppose, a positive triangular fuzzy number (PTFN) is A~and that can be defined
as
a,b,c
shown in Fig. 2.2. The membership function n~
x is defined as:
, , 0 , , , , ~ otherwise c x b if b c x c b x a if a b a x x A (2.3)Fig. 2.2 A triangular fuzzy numberA~
Based on extension principle, the fuzzy sum and fuzzy subtraction of any two triangular fuzzy numbers are also triangular fuzzy numbers; but the multiplication of any two triangular fuzzy numbers is only approximate triangular fuzzy number (Zadeh, 1975). Let’s have a two positive triangular fuzzy numbers, such as A~1
a1,b1,c1
, and A~2
a2,b2,c2
,and a positive real number r
r,r,r
, some algebraic operations can be expressed as follows:
1 2 1 2 1 2
2 1 , , ~ ~ c c b b a a A A (2.4)
1 2 1 2 1 2
2 1 , , ~ ~ c c b b a a A A (2.5)
1 2 1 2 1 2
2 1 , , ~ ~ c c b b a a A A (2.6)
1 1 1
1 , , ~ rc rb ra A r (2.7) 1 ~ A ØA~2
a1 c2,b1 b2,c1 a2
(2.8)The operations of (max) and (min)are defined as:
2
1 2 1 2 1 2
1 , , ~ ~ c c b b a a A A (2.9)24 | P a g e
2
1 2 1 2 1 2
1 , , ~ ~ c c b b a a A A (2.10) Here, r0,and a1,b1,c1 0,Also the crisp value of triangular fuzzy number set A~1can be determined by defuzzification which locates the Best Non-fuzzy Performance (BNP) value. Thus, the BNP values of fuzzy number are calculated by using the center of area (COA) method as follows: (Moeinzadeh and Hajfathaliha, 2010) BNPi =
, , 3 a i a b a c (2.11)Definition 4. A matrixD~is called a fuzzy matrix if at least one element is a fuzzy number
(Buckley, 1985).
2.1.3 Linguistic variable:
Definition 1.A linguistic variable is the variable whose values are not expressed in numbers but
words or sentences in a natural or artificial language, i.e., in terms of linguistic (Zadeh,
1975).The concept of a linguistic variable is very useful in dealing with situations, which are too
complex or not well defined to be reasonably described in conventional quantitative expressions
(Zimmermann, 1991). For example, ‘weight’ is a linguistic variable whose values are ‘very low’,
‘low’, ‘medium’, ‘high’, ‘very high’, etc. Fuzzy numbers can also represent these linguistic values.
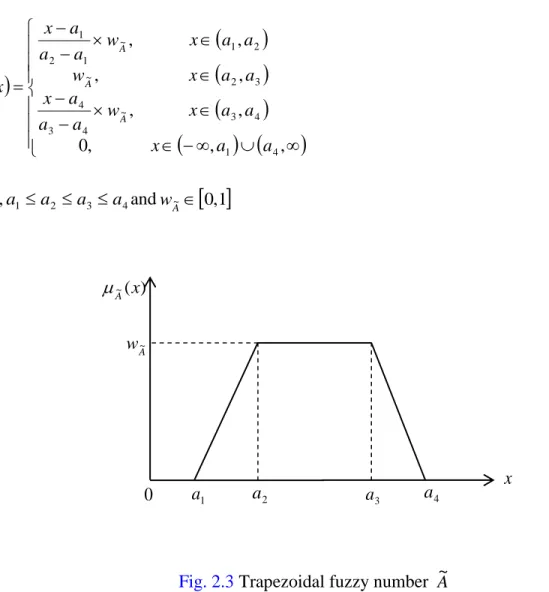
2.1.4 The concept of generalized trapezoidal fuzzy numbers
By the definition given by (Chen, 1985), a generalized trapezoidal fuzzy number can be defined as ~
1, 2, 3, 4; ~
, A w a a a a A as shown in Fig. 2.3.and the membership function ~
x :R
0,1A
25 | P a g e
, , , 0 , , , , , , 4 1 4 3 ~ 4 3 4 3 2 ~ 2 1 ~ 1 2 1 ~ a a x a a x w a a a x a a x w a a x w a a a x x A A A A (2.12) Here,a1 a2 a3 a4andw~A
0,1Fig. 2.3 Trapezoidal fuzzy number A~
The elements of the generalized trapezoidal fuzzy numbers xRare real numbers, and its membership functionA~
x is the regularly and continuous convex function, it shows that themembership degree to the fuzzy sets. If1a1a2 a3a4 1,thenA~is called the normalized trapezoidal fuzzy number. Especially, if ~ 1,
A
w then A~ is called trapezoidal fuzzy number
a1,a2,a3,a4
; if a1 a2 a3 a4, then A~ is reduced to a triangular fuzzy number. If,
4 3 2
1 a a a
a thenA~is reduced to a real number.
1 a 0 a2 ) ( ~ x A x 4 a A w~ 3 a
26 | P a g e
Suppose that a~
a1,a2,a3,a4;wa~
and b
b1,b2,b3,b4;wb~
~
are two generalized trapezoidal
fuzzy numbers, then the operational rules of the generalized trapezoidal fuzzy numbersa~ andb~
are shown as follows (Chen and Chen, 2009):
b a a a a wa b b b b wb a 1, 2, 3, 4; ~ 1, 2, 3, 4; ~ ~ ~
a1b1,a2b2,a3b3,a4b4;min wa~,wb~
(2.13)
b a a a a wa b b b b wb a 1, 2, 3, 4; ~ 1, 2, 3, 4; ~ ~ ~
a1b4,a2 b3,a3b2,a4 b1;min w~a,wb~
(2.14)
b a a a a wa b b b b wb a 1, 2, 3, 4; ~ 1, 2, 3, 4; ~ ~ ~
a,b,c,d;min wa~,w~b
(2.15) Here,
1 1, 1 4, 4 1, 4 4
min a b a b a b a b a
2 2, 2 3, 3 2, 3 3
min a b a b a b a b b
2 2, 2 3, 3 2, 3 3
max a b a b a b a b c
1 1, 1 4, 4 1, 4 4
max a b a b a b a b d If a1,a2,a3,a4,b1,b2,b3,b4are real numbers, then
a b a b a b a b wa wb
b a 1 1, 2 2, 3 3, 4 4;min ~, ~ ~ ~
b
a w b b b b w a a a a b a ~ 4 3 2 1 ~ 4 3 2 1 ; , , , ; , , , ~ / ~
a1/b4,a2/b3,a3/b2,a4/b1;min w~a,wb~
(2.16)27 | P a g e
Chen and Chen (2003) proposed the concept of COG point of generalized trapezoidal fuzzy
numbers, and suppose that the COG point of the generalized trapezoidal fuzzy number
a a a a wa
a 1, 2, 3, 4; ~ ~ is
,
, ~ ~ a a y x then: 4 1 ~ 4 1 1 4 2 3 ~ ~ , 2 , 6 2 a a if w a a if a a a a w y a a a (2.17)
a a a a a w y w a a a a y x ~ ~ ~ 4 1 3 2 ~ ~ 2 (2.18)2.2 Ranking of Fuzzy Numbers
The ranking methodology adapted here has been described as follows (Chou et al., 2011). Considering n normal fuzzy numbers Ai,
i1,2,...,n
, each with a trapezoidal membership function f
xi
A . The revised method performs pair-wise comparisons on thenfuzzy numbers. For
each pair of fuzzy numbers, sayA1andA2, the pair-wise comparison is preceded as follows.
The maximizing setM and minimizing setGwith membership function fMis given as,
. , 0 , min max min max min Otherwise x x x x x x x x f k M (2.19)28 | P a g e
. , 0 , min max min max max Otherwise x x x x x x x x f k G (2.20)Herexmin Inf S,xmax SupS,S U 1S ,S
x/ f (x)0
, i A i i n i andkis set to be 1. The revised
ranking method defines the right utility values of each alternativeAias:
sup
, 1,2; 1 i f x f x i u R i i x M A M (2.21)
sup
, 1,2. 2 i f x f x i u R i i x G A G (2.22)The let utility values of each alternativeAias:
sup
, 1,2; 1 i f x f x i u L i i x G A G (2.23)
sup
, 1,2. 2 i f x f x i u L i i x M A M (2.24)The revised ranking method defines the total utility value of each fuzzy numberAiwith index of optimism as:
1
1
1
, 1,2. 2 1 1 2 2 1 u i u i u i u i i i U i i i i G M G M T (2.25)The index of optimism
represents the degree of optimism of a decision-maker (Kim and Park,1990; Liou and Wang, 1992; Wang and Luo, 2009). A larger indicates a higher degree of
optimism. More specifically, when 0,the total utility value uT0
Ai representing a pessimistic decision-maker’s viewpoint is equal to the total left utility value of Ai. Conversely, for an29 | P a g e
value ofAi. For a moderate (neutral) decision-maker, with 0.5,the total utility value of each
fuzzy numberAi become
1
, 1,2. 2 1 1 2 1 2 1 1 2 2 1 2 1 u i u i u i u i i i U i i i i G M G M T (2.26)The greater theuT
Ai
, the bigger the fuzzy numberAiand the higher it’s ranking order.
As described by (Chou et al., 2011), if Ai is a normal trapezoidal fuzzy number, i.e.
i, i, i, i;1
,i a b c d
A the total utility value of each fuzzy numberAican be written as:
min max min min max min min max min min max min 1 2 1 x x a b x b x x b a x a x x d c x c x x c d x d i u i i i i i i i i i i i i T (2.27)2.3 VIKOR Method
There are numerous methods that aid managers in making decisions in conflicting situations where the decision has to be taken by considering various possibilities all having their ‘pros and cons’. Of all, Multi-Criteria Decision Making (MCDM) methods are most popular among the organizational decision-making situations. Tong et al. (2007) gave comparative disadvantages of other methods over MCDM methods as:
Many methods disregard variation in quality losses for multiple responses.
Solution obtained from methods is calculated by individually optimizing each variable. Problems arise where the situation of variables having different direction of optimality.
30 | P a g e Some methods require very strong mathematical and statistical background.
Not every situation can have optimality when using the conventional methods.
Even MCDM techniques are complex requiring both engineers and managers to take part in the decision-making. Engineers evaluate the situation having multi-criteria and alternatives mathematically. Now, it is the manager’s part to consider the alternatives provided in the order of preference and chose the feasible alternative.
Human interpretation in situation of low and high is not sudden but of slow transition. This creates some vagueness and ambiguity in the information and each alternative may have its own advantages and drawbacks. Classical MCDM technique cannot handle these situations with indefinite information. To deal with such situations Zadeh (1965; 1975; 1976) proposed that key elements in human thinking are not numbers but of fuzzy sets. Fuzzy set theory a powerful tool to deal with these fuzzy and inexplicit data than the conventional mathematics.
The VlsekriterijumskaOptimizacija I KompromisnoResenje (i.e. VIKOR) was developed by
(Opricovic, 1998; Opricovic and Tzeng, 2002) for optimization of complex problems with
conflicting and non-commensurable criteria striving for compromise ranking order. This method introduces ranking index based on particular measure of closeness to the ideal solution
(Opricovic and Tzeng, 2004). The multi-criteria measure for compromise ranking is developed
from the Lp-metric used as an aggregating function in a compromise programming method (Yu,
1973; Zeleny, 1982).
*
*
1/ 1 / P n P Pi j j ij j j j L w f f f f
(2.28)Here, 1P;j 1,...,n, with respect to criteria and the variable i1,...,m, represent the number of alternatives such asA1,A2,...Am. For alternativeAi, the calculated value of the jth