Abstract
The general anti-avoidance rule, or GAAR, is an enforcement mechanism that gives the taxing authority of a country broad power to deny a taxpayer tax benefits associated with any transaction.Although a GAAR being enacted within a country is becoming increasingly more common, the presence of a GAAR is generally overlooked and thus its effect left unstudied. In this paper we provide an initial investigation by studying the effect that a GAAR within a country has on corporate tax avoidance behaviors. Using an indicator for the enactment of a GAAR within a specific country, we find a statistically and economically significant increase in aggregate tax collections and a statistically and economically significant decrease in firm-level tax avoidance. Ad-ditional analyses show that the firm-level results are strongest for firms with higher levels of tax avoidance, for countries with lower levels of tax enforcement prior to the implementation of a GAAR, and for countries where the burden of proof lies, at least partially, with the taxpayer. In final analyses, we find that the GAAR is associated with a decrease in the volatility of reported ETRs.
1
Introduction
The general anti-avoidance rule (hereafter, GAAR) is an enforcement mechanism that gives the taxing authority of a country broad power to deny a taxpayer tax benefits associated with any transaction. Although the powers are broad, the intended target of these powers are those transactions that have have no substantial purpose other than achieving a tax benefit. As the GAAR is a mechanism to curtail tax abuse, the OECD has increasingly advocated for its use while the EU has called on member states to uniformly adopt a minimum standard domestic GAAR (Ernst&Young 2013). However, despite the growing interest in the GAAR and their increasingly widespread adoption around the world, these rules and their impact have largely been ignored in the international tax and accounting literature. This paper aims to begin that investigation by examining the effect that implementing a GAAR within a country has on both aggregate income tax revenue collections and in the pooled, cross-section of firm-level tax avoidance behavior.
To better understand the intended purpose of enacting a GAAR within a country, consider the following. Generally, taxpayers arrange their affairs in such a way that enables them access to varying levels of tax benefits. While many of these transactions are for legitimate non-tax reasons, others can be undertaken exclusively for tax benefits and therefore contain no substance apart from its potential tax advantages. In these situations, a GAAR provides a tool by which the tax authority may deny a transaction’s tax benefits by looking past the form of the transaction (which are likely intentionally structured to follow the letter of the
law) to its substance (or lack thereof). In addition, the GAAR can serve as a means by which the tax authority can challenge claimed tax savings they feel are out-sized, but for which they lack a separate, relevant enforcement tool. Through these channels, the GAAR is a means to limit corporate tax avoidance.
Despite this intuition, there are also many reasons corporate tax avoidance would be insensitive to a GAAR or why we might fail to find an observable effect. First, in the face of greater enforcement, firms may behave like high-income individuals and seek additional means (whether transactions or strategies) of tax avoidance to obtain the targeted after-tax results after a full resolution with the tax authority (Slemrod et al. 2001). For example, similar to the audit-related argument in Slemrod et al. (2001), the enactment of a GAAR may act to highlight the strength of the enforcement regime and thus induce firms to seek higher and more effective levels of tax avoidance. Alternatively, firms at the high end of the tax avoidance spectrum may be unaffected by tax enforcement strength. This finding would be consistent with the negative coefficient depicted in Figure 2 of Hoopes et al. (2012), which provides evidence that a higher likelihood of tax audit may be irrelevant to the most tax aggressive firms. This is similar to PricewaterhouseCoopers LLP (2004), which states: “[i]n a number of countries the final agreement of a tax return often ends in a ‘horse trade’ between the taxpayer and the relevant revenue authority.” Therefore, aggressive taxpayers may need to have multiple aggressive positions with which to engage in such a trade and thereby have greater room for negotiating with the tax authority. Under these scenarios, the enactment of the GAAR would increase tax avoidance.
Second, irrespective of tax-related laws in place, the average firm may, by default, refuse to engage in behaviors that aggressively reduce their tax to avoid the non-tax costs associated with such actions (see Hanlon and Slemrod 2009, Mills et al. 2013). As the GAAR may only be invoked when firm-specific tax-related transactions result in benefits that are out-sized or which lack a purpose other than the sought after tax advantages, the average firm may not view the GAAR as a threat to their current tax avoidance behaviors and thus not alter their actions when faced with its enactment. This would leave little room for a GAAR to have an effect and would thus hinder the researcher’s ability to observe an impact in pooled, cross-sectional tests.
Third, the enactment and application of a GAAR is often intertwined with judicial action and review, thus potentially making the effectiveness of the GAAR less reliant on the tax authority’s use of it, and more on how the courts interpret and respond to it. For example, Poland enacted a GAAR beginning in 2003. However, by May 11, 2004, the Polish Consti-tutional Tribunal had ruled the Polish GAAR to be unconstiConsti-tutional and repealed the new law. Fourth, even when judicial review looks favorably upon the GAAR, the tax authority may be unable to effectively wield it as determining which transactions to apply the GAAR to, or to what extent those transactions should be disallowed, may not be readily apparent. For example, it is not always easy to distinguish genuine transactions consummated in a tax efficient manner from creative devices used for avoiding taxation. This is especially impor-tant as strategic tax planning is largely permissible in all jurisdictions and thus one often
well as all transactions and all positions when evaluating the appropriateness or legitimacy of a specific transaction. In addition, the effectiveness of this determination is likely to be affected by which entity, the firm or the government, carries the burden of proof.
Although the oldest GAAR has been in place for some time, considerable uncertainty continues to persist for GAARs, not only in country-specific implementation, but also in scope, application, and interactions with other law and precedent. In whole all these reasons indicate that whether or not a GAAR will be applied, how far-reaching that application will be, and how the taxpayer will be affected by or respond to its enactment is not without tension. Thus, whether or not a GAAR has an observable effect on tax avoidance remains an open, empirical question, the answer to which interests researchers and policymakers alike.
By examining the effect of the GAAR we also add new evidence regarding the tax en-forcement black box which has historically been under-investigated. We begin by providing evidence that the GAAR is associated with an increase in tax revenue collections in the aggregate. For the dependent variable we use corporate tax collections as a percentage of GDP. As the main independent variable of interest here and in later tests, we use a binary variable set equal one for the country-years after which either an intial GAAR is enacted or, in the case of some countries with a long tradition of a GAAR, significant changes are made to strengthen an existing GAAR, and zero otherwise. We hand collect information on the implementation of GAARs by country. We also include several controls shown to affect tax avoidance in prior literature. We find evidence that the GAAR is associated with a statistically significant increase in corporate tax revenue collections.
We next perform a series of pooled, OLS tests at the firm level using a broad cross-country sample. In these analyses, we find that the enactment of a GAAR is associated with a statistically and economically significant decrease in tax avoidance, where tax avoidance is measured using reported ETRs. This is consistent with our findings in the aggregate using corporate tax revenue collections and provides evidence that the GAAR is effective at curbing both aggregate and firm-level tax avoidance. Furthermore, as the enactment of a GAAR is largely exogenous to a specific firm’s activities, this result and its effect is interpretable without suffering from issues regarding reverse causality and endogeneity.1
After establishing this initial baseline for the effect of the GAAR in the pooled, cross-section, we next provide a host of analyses that further investigate the effects of the GAAR. Although it is interesting that we observe an effect in the pooled, cross-section of firms, the application of the GAAR by a tax authority is most likely to directly impact tax avoidance at the high end of the spectrum. Accordingly, we investigate if there is a differential effect for firms engaged in more aggressive tax planning relative to their peers. Consistent with this expectation, we find that firms with greater levels of tax avoidance experience a greater reduction in reported ETRs relative to those firms with lower levels of tax avoidance.
1We recognize these findings have two potential, but not mutually exclusive, implications. First, one interpretation of these findings is that the average firm in a non-GAAR regime is engaged in activities to which a GAAR might apply and thus the average firm ceases those activities in the presence of a GAAR. Second, another interpretation is that the enactment of a GAAR creates substantial tax- and enforcement-related concern for the average firm such that that firm responds to the increase in uncertainty and risk by decreasing tax avoidance. Since the first interpretation requires the average firm in our sample be engaged in aggressive tax avoidance behaviors and since extant empirical evidence suggests this is unlikely (see Hanlon and Slemrod 2009, Frank et al. 2009, Armstrong et al. 2012, Kerr et al. 2017, Kerr 2018a), we interpret this result following the second.
Next, we investigate whether the enactment of a GAAR has a differential effect depending on the prior level of tax enforcement. For example, economies with strong tax enforcement prior to the enactment of the GAAR may find a GAAR to be an effective, additional tool at their disposal. Thus, the GAAR would act to complement prior tax enforcement. However, as the GAAR is ultimately an additional law layered upon preexisting law, the GAAR might have little (greater) incremental effect when laws curbing tax avoidance are already strong (weak). Thus, the GAAR might act as a supplement to prior tax enforcement. In tests focusing on only those countries which implement a GAAR during our sample period when using a regression model that includes an interactive effect between the GAAR indicator and prior low tax enforcement, we find that the GAAR has a greater effect when prior tax enforcement is low, suggesting a supplementary effect.
Next, we investigate whether there is a differential effect depending on whether the tax-payer or tax authority bears the burden of proof. To our knowledge, ours is the first study to investigate a differential effect on an enforcement mechanism related to who bears the burden of proof. In regards to enforcement, the burden of proof is especially relevant as it signals the party that, inherently, has the larger judicial hurdle to overcome regarding that enforcement action. In empirical analyses we find evidence that the effect of the GAAR is greater when the taxpayer bears, at least partially, the burden of proof.
Finally, we investigate the effect a GAAR has on the volatility of the ETR. ETR volatility is often viewed as a measure of tax risk, therefore our results can be interpreted as evidence of the effect of the GAAR on firm-level tax risk. Providing answers to this question is important
as firms may view the GAAR as increasing their tax risk as the tax authority might have carte blanche in regards to challenging otherwise legitimate tax-related transactions. However, in contrast, limiting the upper bound of tax aggressiveness might mechanically limit ETR volatility such that tax risk declines overall. In tests that investigate the effect of the GAAR on reported ETR volatility, we find evidence that supports the GAAR being associated with a decrease in that volatility.
This paper provides many important contributions to the literature. Specifically, it pro-vides evidence of a broad effect on tax avoidance, not just on the point estimate but also on the distribution, due to the presence of a GAAR in the pooled cross-section. Document-ing this effect is important as it provides evidence to both researchers and policymakers on an important and increasingly prevalent enforcement tool available to the tax authority. Thus, these results are helpful to policymakers in evaluating the effectiveness of a GAAR for their regime. In addition, our study provides direct evidence on a specific mechanism of tax enforcement largely left unstudied.
The rest of this paper is organized as follows. Section 2 discusses the relevant research and develops hypotheses. Section 3 provides our empirical framework as well as data and variable description. Section 4 presents the results of empirical tests, and Section 5 concludes.
2
Related Research and Hypothesis Development
Although tax enforcement is often treated as a single step and effect, it is, in actuality, a multi-faceted and multi-step process. Specifically, the typical enforcement procedure follows a process similar to the following: 1) a taxpayer engages in a series of transactions with varying levels of tax benefits which are captured in tax and financial statements and disclo-sures, 2) with some level of probability, the tax authority audits the tax and/or statutory statements, disclosures, and positions claimed, 3) the tax authority comes to a determination regarding the taxpayer’s positions, 4) the tax authority then uses relevant law and policies to challenge those tax positions with which it disagrees, and 5) a resolution is reached, either by court ruling or otherwise, which provides either a mutually agreed on or forced reconciliation of the positions of the taxpayer with the determinations of the tax authority.
Despite the intricacies of this process, extant research within the United States on the effects of tax enforcement has focused almost exclusively on the effect of discovery via tax audits (e.g., El Ghoul et al. 2011, Hoopes et al. 2012, Hanlon et al. 2014) and thus on the second step of the process. However, strictly speaking, research on the effect of enforcement as proxied for by audit incidence and probability should be interpreted as the marginal effect that the increased probability of discovery has, keeping all other steps of the process and enforcement-related tools available to the tax authority constant, on a specific outcome (such as tax avoidance). As such, studies using the probability of audit discovery provide little evidence on the effect that changes in other enforcement tools has on that same outcome.
Because the enactment of a GAAR broadens the tools available to the tax authority irre-spective of the frequency of the audit discovery process, our study investigates and provides evidence on an aspect of enforcement significantly different from tax audit and discovery probability (i.e., the GAAR provides evidence related to the fourth step, and by backward reasoning the third step, rather than the second step).
Relatedly, the international literature that has studied the effect of tax enforcement (e.g., Dyck and Zingales 2004, Desai et al. 2007, Atwood et al. 2012, and Kerr 2018b) has relied on a single index based on survey response to variations of questions such as “Is tax evasion a threat to your economy?” Therefore, while the measure used by the prior literature likely captures a general sentiment regarding tax evasion, it is likely that it only indirectly captures tax enforcement while providing no evidence on the specific mechanisms at play. Therefore, our study illuminates other aspects of the tax enforcement black box by providing evidence on a specific, ever growing and increasingly present mechanism.
Specific research on the effects of general anti-avoidance rules, however, is both limited and nascent. For example, recent research by Johansson et al. (2017) investigates the role that various broad categories of country-level tax policies has on the transfer pricing outcomes used by multinational firms. Although that study focuses on policies and legislation that deal with the disclosure of transfer pricing, rules against debt manipulation, the capping of interest payments, and the degree of withholding tax rates, they also present results of a measure that includes the presence of controlled foreign corporation (CFC) rules and the
some evidence that these tax policies (what they term collectively as “anti-avoidance rules”, though their use of the term should not be confused with the “general anti-avoidance rule”, or GAAR, either here or elsewhere) is associated with a lower level of profit shifting among their sample of multinational groups. However, oddly their results appear to be weaker (both in statistical significance and economic strength) in the regression where they use a measure that includes the presence of both CFC rules and a GAAR, as opposed to limiting the variable of interest to only the policies dealing with transfer pricing, debt manipulation, and withholding tax rates. Although they do not provide a test of the difference in coefficient, the lower coefficient when the presence of a GAAR is included could imply that the presence of a GAAR works to increase tax avoidance, providing potential empirical support for the tension and arguments made above. Even if their reported coefficients are not statistically different, their study provides initial but limited evidence on the effect of the GAAR on profit shifting (a specific type of tax avoidance) for multinational corporate groups.
Although it lacks empirical hypotheses and tests, Johansson et al. (2016) provides de-scriptive evidence on the specific tax policies and legislation used in the empirical tests of Johansson et al. (2017). Therefore, Johansson et al. (2016) serves as a jumping off point for Johansson et al. (2017) as well as provides insight to our own study. As research into the effects of the GAAR is limited, our study aims to provide ground-floor evidence in a broad setting on this specific tax enforcement mechanism and its relationship with corporate tax avoidance as well as increase awareness of this important policy. In this vein, we look forward to future research that exploits the presence of a GAAR.
As the GAAR is a broad measure intended to disallow questionable tax compliance, our study is also related to those studies which investigate the impact of tax enforcement or enforcement-related changes on firm-level behavior. This literature has focused predomi-nantly on one of two variables depending on setting. For example, studies in a US setting rely predominantly on the frequency of IRS audits while the international setting uses vari-ation in cross-country tax enforcement. More specifically, these two veins of studies use, as empirical proxies, IRS audit incidence (based upon firm size grouping) from the Transac-tional Records Access Clearinghouse (TRAC) TracFed database and the tax evasion index from the IMD World Competitiveness Report, respectively.2
Research into the effects of IRS audit incidence include studies such as El Ghoul et al. (2011), Hoopes et al. (2012), and Hanlon et al. (2014) where audit probability is associated with lower cost of capital, lower tax avoidance, and higher quality financial reporting, re-spectively. In whole, these studies provide evidence on the effect of tax enforcement for one general element of tax enforcement.
In the international sphere, the link between specific mechanisms of enforcement and tax avoidance is weaker as the proxies used for enforcement are often indirect proxies based
2It is important to note a division in the international literature on specific measure of tax enforcement used in some studies. While a version of the index has continued to be supplied every year, historically, many studies have used the static 1996 version of the index (see Dyck and Zingales 2004, Desai et al. 2007, and Atwood et al. 2012). This is often done intentionally, though, as in their study Atwood et al. (2012) argue that the 1996 version better proxies for tax enforcement because of a subtle change in the survey question asked. Specifically, in 1996, respondents were asked how much they agreed with the statement: “Tax evasion is minimal in your country.” However, since 1996, respondents have been asked how much they agree with the statement: “Tax evasion is not a threat to your economy.” Despite this shift, other studies such as Kerr (2018b) use the newer versions of the index as it is a country-year measure with variation in the time series and thus allows for statistically stronger tests.
on survey responses to questions such as “tax evasion is minimal in your country” or “tax evasion is not a threat to your economy.” Regardless of which question survey respondents are responding to, using the tax evasion index as a measure of tax enforcement requires the researcher to assume that tax evasion is minimal or not a threat due to the level of tax enforcement and not due to other behavioral or economic forces. In addition, the index does not supply a direct link to the specific enforcement mechanism at work, leaving the black box of enforcement even more obscured. Regardless, though, research has found that the tax evasion index is associated with lower levels of private benefits of control (Dyck and Zingales 2004), lower levels of tax avoidance (Atwood et al. 2012), and greater incremental information content of tax surprise (Kerr 2018b), though Desai et al. (2007) fail to find that the tax evasion index affects the relation between corporate governance and taxes. Therefore, this study builds upon the findings in Atwood et al. (2012) by opening the black box of tax enforcement.
Also relevant to our study is the work of two separate studies which use a US-only sample to investigate the role the tax authority plays in curbing financial accounting abuses. First, in a study of 27 firms accused of fraudulently overstating earnings by the SEC, Erickson et al. (2004) use restatements of current tax expense to provide evidence that the firms studied included amounts overstated for financial purposes in their tax returns and thus paid real cash on fake monies. Specifically, they estimate that the median firm in their sample deliberately overpaid their taxes by 8 cents per dollar of reported pre-tax income, resulting in firms in the sample overpaying taxes by as much as $320 million (on overstated earnings of $3.36
billion). As noted in Erickson et al. (2004), these findings suggest that managers committing accounting fraud “may willingly have their firms pay taxes on the earnings overstatements to avoid raising the suspicion of savvy investors, the Securities and Exchange Commission (SEC), or the Internal Revenue Service (IRS).” Similarly, using a pooled sample of firms, Lennox et al. (2013) find evidence consistent with tax aggressive US public firms being less likely to commit accounting fraud. In whole, these studies suggest that firm behavior is impacted by the actions of the tax authority.
3
Empirical Framework
We obtain data for firm-level financial and accounting variables from the Compustat Global Fundamentals Annual and the Compustat North America Fundamentals Annual databases along with their intersection with the Compustat Security Daily databases. We use firm-year observations with necessary data for fiscal years ending between 1998 and 2017. The data begins in 1998 due to the general lack of tax-related rate and financial data prior to that time. For firm-year tests, we limit our sample to those countries that enacted a GAAR or that had significant legislation strengthening the GAAR during our sample period. In addition, we limit our sample to those firms within those countries with 1) non-missing, positive assets at both the beginning and end of year, 2) non-missing, positive pre-tax book income during the year, and 3) non-missing control variables.
We make a few notes regarding the decision to use, as our sample, both those countries that enacted a GAAR and those that significantly strengthened an existing GAAR during our sample period. First, we note that by coding periods following the strengthening of an existing GAAR as 1 and periods prior to that strengthening as 0, we are potentially discarding some of the GAAR-related effect. Although coding in this manner is likely to only bias against finding the effect we are interested in (thereby ensuring the strength of any effect we do find), we note that legislation to strengthen an existing GAAR is likely to only occur if the existing GAAR is found to be ineffective. In this way, the effect of the GAAR prior to strengthening is plausibly similar to a lack of a GAAR (and thus a value of 0). Second, by constructing the sample in this way we are able to provide a good balance in the trade-off between focusing on the effect, and thus question, of interest while also ensuring adequate sample size, and thus power, in tests, the results of which can generalize broadly.3 To test the empirical predictions, we estimate pooled OLS regressions of the following form:
T axAvoidi,t =γ0+γ1GAARi,t+βControlsi,t+F ixed Ef f ects+εi,t (1)
whereGAARis the primary variable of interest and takes a value equal to one for the country-year presence of a GAAR, and zero otherwise. The dependent variable, TaxAvoid, is our measure of tax avoidance. We define tax avoidance similar to Hanlon and Heitzman (2010) as any activity that reduces a firm’s tax liability per dollar of pre-tax earnings. Accordingly,
3In untabulated tests, we find that our results remain unchanged, though of slightly lower economic significance if we use a full sample that includes all countries regardless of enactment year.
TaxAvoid is calculated using the reported GAAP (i.e., book) ETR. We calculate the reported ETR as the income tax expense for the year divided by income before taxes and minority interest (i.e., pre-tax income).
Although we calculate the reported ETR similar to prior research that uses mostly a US-only setting, our international sample has variation in the corporate statutory tax rate (CSTR) within countries across time (unlike a US-only setting which has seen little to no variation in the corporate statutory tax rate in recent history). Therefore, to ensure our results are not driven by cross-country fluctuations in the CSTR, we further modify the reported ETR in three ways. First, we scale the reported ETR by the CSTR to allow for comparability and remove differences in scale. Second, we use the unscaled ETR but include the CSTR as an additional control variable in the regression model. This allows the CSTR to take a value different from one, as opposed to including it as a scalar on the left-hand side. Third, we calculate the spread between the reported ETR and the CSTR. Therefore, for all three measures, a lower value of TaxAvoid signifies greater tax avoidance. We obtain corporate statutory tax rates from the Organisation for Economic Co-operation and Development (OECD) website for years 2000-2017, from KPMG’s online corporate tax rate table for years 2003-2017, from KPMG’s annual corporate tax rate survey for years 1998-2003, and from the Tax Foundation Github data archive for years 1998-2015. Where available, we crosscheck rates across multiple sources to ensure consistency in the inclusion of subnational taxes.
We focus on the reported ETR, as opposed to other potential measures of tax avoidance, for several reasons. First, prior research shows that both management and investors focus on earnings over cash (see Sloan 1996). In addition, Armstrong et al. (2012) find that tax directors (who are most likely to be concerned with the effects of a GAAR) are focused on the level of tax expense as reported in the financial statements as opposed to other measures such as cash taxes paid or the book-tax gap. Therefore, any response from management related to variation in enforcement might best be seen in an earnings-based measure (i.e., reported ETR) as opposed to a cash-based one (i.e., cash ETR).
Second, we note that tax expense in the Compustat Global database is much more broadly available than other potential measures. For example, requiring current tax expense reduces the final data set size by over a third while requiring cash taxes paid reduces the final data set size by nearly two-thirds. Thus, focusing on total tax expense allows for our sample to have the greatest sample size, to have the greatest statistical power, and to be the most broadly generalizable. Despite this, in untabulated results we also check our findings using as alternative measures either the current ETR (calculated using current tax expense divided by pre-tax income) or the cash ETR (calculated using cash taxes paid divided by pre-tax income). We find that our results generally hold using either of these two measures.
Our main variable of interest, GAAR, indicates the presence of a general anti-avoidance rule during the specific country-year.4 To obtain information on the enactment date of a
4For brevity, we do not distinguish between a GAAR or a GAAR-like provision and simply refer to them collectively as a GAAR. A GAAR-like provision is essentially a GAAR by another name. For example, Indonesian tax law regulations established the principle of substance over form in 2009, enabling the tax authority to recharacterize transactions that lack business purpose.
GAAR for each country, we manually search for and hand collect data from multiple sources. Our main sources include Ernst&Young (2013) and Appendix 1 of Johansson et al. (2016). Where the information in those two documents is missing or contradictory, we search for and find supplemental information including that from Bloomberg Law (2009), International Law Office (2011), Deloitte (2017), and Ernst&Young (2017). We summarize the effective dates, how we determine each date, and the appropriate source documents in Appendix B.
We include a variety of both firm- and country-level variables drawn from the prior liter-ature that have been shown to be associated with tax avoidance (e.g., Gupta and Newberry 1997, Rego 2003, Dyreng et al. 2008, Frank et al. 2009, and Wilson 2009). Specifically, we include firm-level controls for return on assets (calculated as pre-tax income scaled by be-ginning of year assets), market value of equity (calculated as year-end share price multiplied by shares outstanding scaled by total assets at the beginning of the year), size (calculated as the log of total assets), age (calculated as the log of 1 plus Compustat firm age), book-to-market ratio (calculated as the ratio of book value of equity to market value of equity), intangibles (calculated as intangibles scaled by total assets at the beginning of the year), pp&e (calculated as property, plant, and equipment scaled by total assets at the beginning of the year), research and development expenditures (calculated as total research and de-velopment expenditures scaled by total assets at the beginning of the year), the presence of consecutive losses (calculated as an indicator variable set equal to one if pre-tax income for the current and prior year are less than zero), and cash flow constraints (calculated as 1
minus the ratio of operating cash flows scaled by total assets at the beginning of the year). A detailed description of all variables can be found in Appendix A.
We also include country and year fixed effects in most regressions to control for country-and year-specific factors that may not be controlled for elsewhere. Although we include country fixed effects in our main analyses, the country fixed effect may subsume some of the intercept effect we are attempting to document. Therefore, we also test our main results while excluding country fixed effects and find that our results are robust to this alternative specification. In addition, we cluster standard errors by firm to account for the possible correlation in residuals. Finally, to reduce the influence of outliers, we winsorize all firm-level continuous variables at the top and bottom percentile.
4
Empirical Results
In this section we present the results of all empirical tests. We start with a test in the aggregate and then move to firm-level tests.
4.1
Effect on tax revenue collections in the aggregate
We begin our empirical tests by testing our main hypothesis in the aggregate. To ensure sufficient power of tests, we perform this test using all country-years regardless of whether the country enacted a GAAR during our sample period or not.5 Using OLS regressions we test
5Untabulated tests using only those countries that enacted a GAAR during our sample period show that the coefficient size and sign on GAAR is roughly equivalent, but that the statistical significance is mostly attenuated. Due to the low number of observations in this test, along with the large loss of observations after
whether the presence of a GAAR results in reduced tax avoidance and use, as our dependent variable, the amount of corporate tax revenues collected as a percentage of GDP (obtained from the OECD website). This test is similar in spirit and intent to the aggregate test found in Kerr (2018a) which shows that increased country-level opacity results in an increase in the country-level corporate tax revenues collected. We follow Kerr (2018a) and include a variety of country-level controls. Specifically, we include the presence of a worldwide tax system (obtained from Atwood et al. 2012 and, where missing, EY’s Worldwide Corporate Tax Guide 2017 and the Tax Foundation Special Report “A global perspective on territorial taxation”), the level of required book-tax conformity (obtained from Atwood et al. 2010), the anti-self dealing index (obtained from Djankov et al. 2008), an index of anti-director rights (obtained from La Porta et al. 1998), the level of ownership concentration (obtained from La Porta et al. 1998), and the civil law indicator obtained from Atwood et al. 2012 (where missing we use Central Intelligence Agency 2018).
Before presenting results of this test, we present descriptive statistics for the variables used in this test. These descriptive statistics can be found in Table 1, Panel A, and indicate wide variation in country characteristics, including corporate tax revenue collections and investor protections rights.6
limiting the sample, we see this as evidence of a lack of power in the tests when using the reduced sample and thus use the full sample.
6We note that Table 1, Panel A has a much reduced country composition than that which we present later in Table 3, Panel B when we move on to firm-level results. This reduction is due to limitations in many different data items. For example, the main variable of interest is the amount of corporate tax revenues collected as a percentage of GDP. As this item is obtained from the OECD website, we immediately eliminate non-OECD countries. In addition, the need for additional control variables further limits the sample of countries that can be included in the tests.
We next present results of this aggregate test in Table 1, Panel B. Similar to and as noted in Kerr (2018a), CorpTaxRev is expressed in percentage terms (i.e., 1 percent is expressed as 1 and not .01). This suggests that, in terms of economic significance, the presence of a GAAR increases CorpTaxRev by roughly three- to four-tenths of a percentage point and that the effect is slightly greater than the effect documented in Kerr (2018a) related to the transparency effects of the mandatory adoption of IFRS.
4.2
Effect on firm-level tax avoidance
Next, we test the effect of the presence of a GAAR on firm-level tax avoidance as measured using reported ETRs. Once again, before presenting the results of this test, we present descriptive statistics useful in interpreting subsequent results. We present our firm-level sample selection procedures in Table 2. In the lower part of Table 2, we show the number of firm-years excluded due to each missing data item. We note that the largest exclusion is due to firms with missing or negative pre-tax income. This step is necessary, however, in computing reported ETRs.
In Table 3, Panel A, we present firm-level descriptive statistics for the variables used in firm-level tests. As seen there, the sample of firms includes a wide variety of firms in terms of tax aggressiveness, profitability, leverage, size, age, and investment profiles.
In Table 3, Panel B, we present similar descriptive statistics, but do so by country. Again, the statistics shown illustrate the diversity of our sample as well as provide a sense of its
country-by-country representation. We find that the country with the largest representation is Japan, followed by China, and the United Kingdom.
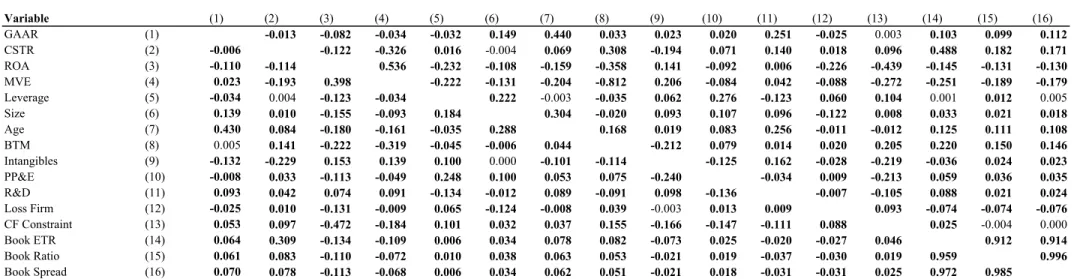
In Table 4 we present a correlation matrix of firm-level variables. Of interest here is that the GAAR is significantly positively associated with our measures of tax avoidance. This provides initial evidence for our hypothesis that the GAAR acts to reduce tax avoidance.
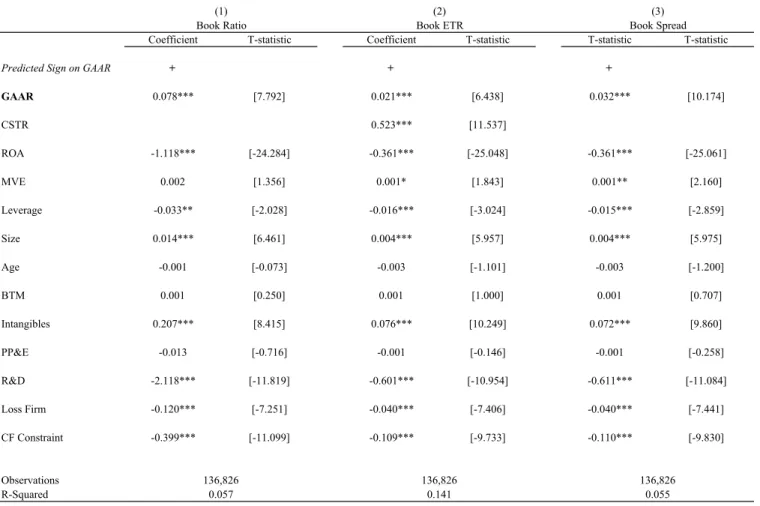
The results of our main analysis are presented in Table 5. These results act as a baseline for the additional tests we provide in later tables. We present results using three regression models, 1) using the reported ETRs scaled by the country-year CSTR, 2) using the unscaled reported ETR with CSTR as an additional control, and 3) using difference between the reported ETRs and the able country-year CSTR. The results of these specifications can be seen as Columns 1 through 3.
As seen, the indicator variable for the presence of a GAAR loads significantly and pos-itively in all specifications, implying that the GAAR has a significant effect in the pooled cross-section. In terms of economic significance, our results indicate that the GAAR increases reported ETRs by at least two percentage points.
4.3
GAAR and tax aggressive firms
The results in Table 5 show a significant mean effect. However, it is unclear if this mean effect is being driven by a particular section of the distribution. It is our expectation that, due to the nature of a GAAR, the effect of the presence of a GAAR will be greatest for firms
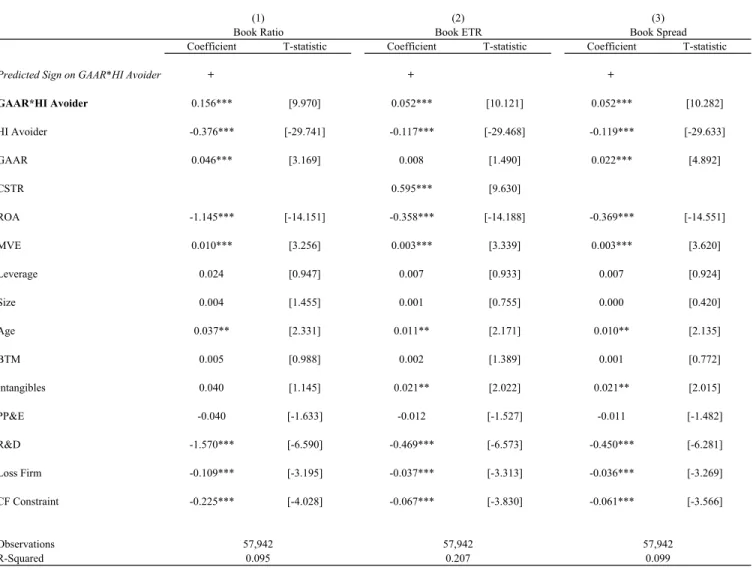
We next test this supposition. To do so, we create a measure of firms which are tax aggressive. Specifically, we create a firm-level indicator variable set equal to one when a firm’s long run ETR in the three years preceding the first year the GAAR was put into place exceeds the median long-run tax avoidance of all other firms in that particular country. We report the results in Table 6.
As seen there, we find that the effect of the GAAR is more pronounced on firms that previous to the GAARs enactment had been at the higher end of tax avoidance. Specifically, the interaction effect with the indicator for high tax avoidance is statistically and economi-cally significant in the direction expected. In addition, we find that the GAAR indicator in two of the three specifications continues to have a positive mean effect (with slightly reduced economic significance when compared to Table 5), implying that the GAAR affects firms with both high and low levels of tax aggressiveness. This finding is of particular interest as it implies that, although the stated target of the GAAR is on the most egregious of tax offenders, its effect applies broadly.
4.4
GAAR and prior enforcement
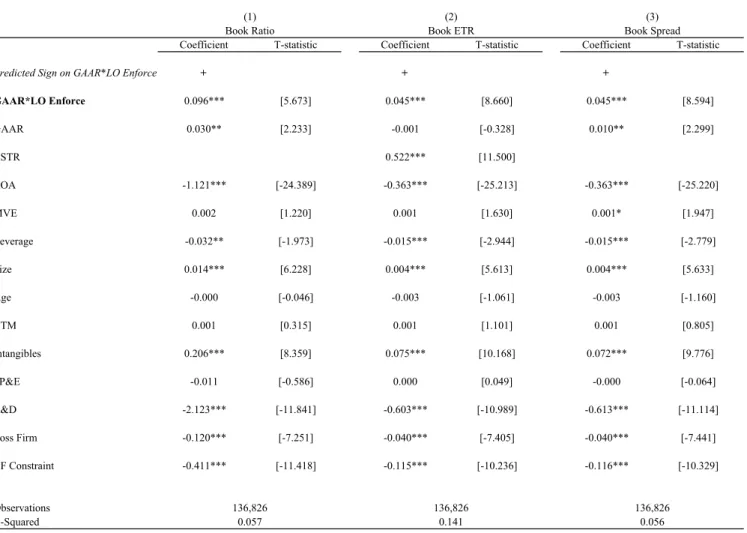
We next test how the GAAR interacts with prior levels of enforcement. This test is informa-tive because it shows whether the GAAR supplements or complements prior tax enforcement. To create a measure of the level of tax enforcement in place prior to the presence of a GAAR, we create a country-level indicator variable to capture those countries with a lower degree of tax enforcement prior to the enactment of a GAAR. Specifically, we create a new
variable, LO Enforce, set equal to one for countries with tax enforcement in the year prior to the enactment of a GAAR that falls below the median of tax enforcement of all countries in that sample year. We measure tax enforcement using the tax evasion index taken from the IMD World Competitiveness Report. The tax evasion index is based on responses to an executive opinion survey and measures respondents’ perceptions regarding the strength of tax enforcement within a country. As LO Enforce is a country-static variable subsumed by country fixed effects, the standalone effect is excluded from the regression model.
We present results of this test in Table 7. As seen there, the interaction effect with the indicator for enforcement is statistically and economically significant and in the direction expected. This implies that the effect of the GAAR is strongest in countries where tax enforcement prior to the enactment of the GAAR is weakest. In addition, we find that the GAAR indicator in two of the three specifications continues to have a positive mean effect (with slightly reduced economic significance when compared to Table 5), implying that, regardless of the strength of prior enforcement, the GAAR continues to have a significant effect.
4.5
GAAR and burden of proof
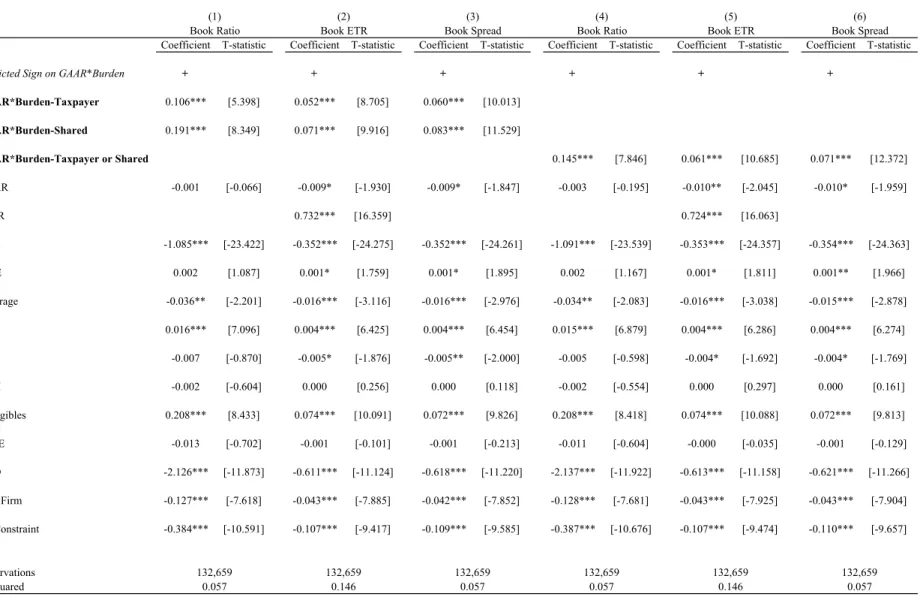
As discussed above, the effectiveness of the GAAR may be affected by which entity, the firm or the government, carries the burden of proof. In our next tests, we provide evidence in that regard.
Specifically, we create three new variables to measure which entity, the tax authority, the tax payer, or both, carry the burden of proof. Specifically, we measure Burden-Taxpayer as equal to one when the taxpayer carries the burden of proof, and zero otherwise. In addition, we measure Burden-Shared as equal to one when the burden of proof is shared between the tax authority and the taxpayer, and zero otherwise. Finally, we measure Burden-Taxpayer or Shared as equal to one when the taxpayer bears any burden (solely or shared), and zero otherwise.
We present the results of tests on the effect of the burden of proof in Table 8. As seen there, the effect of the presence of a GAAR is greater when the taxpayer bears either solely or partially, the burden of proof. This suggests that the GAAR is more effective when the onus of proving the legitimacy of a transaction is on the taxpayer and not on the tax authority.
4.6
GAAR and ETR volatility
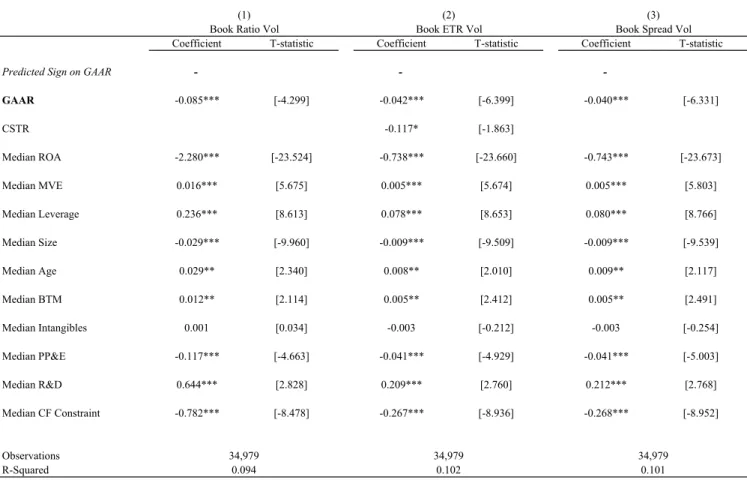
Next, we test the effect of the presence of a GAAR on the volatility of reported ETRs. Prior literature has used ETR volatility as a measure of tax risk. To measure ETR volatility, we take the standard deviation of reported ETRs over the rolling five-year period beginning with the prior year. In addition, we exclude the five year post-GAAR for each country from the analysis to ensure that we avoid overlapping the pre- and post-periods in calculating the volatility measure. We present the results of this test in Table 9.
As seen in Table 9, we find that the presence of a GAAR is statistically and significantly associated with a decrease in reported ETR volatility. These results suggest that the GAAR decreases the tax risk of the firm.
4.7
Robustness
We perform a host of robustness tests to ensure the legitimacy of our interpretation of results. First, for the firm-level analyses, although we limit our sample to include only those countries that enacted a GAAR or enacted legislation strengthening a GAAR during our sample period, we also perform untabulated tests using a sample of all countries for which we have GAAR-related data (i.e., the full sample) and a subsample of only those countries that initially enacted a GAAR during our sample period (i.e., a much reduced subsample). We find that our results remain unchanged.
Second, in our main tests we report results using the reported ETR. In untabulated robustness, we use two alternative measures of tax avoidance, namely the cash and current ETRs. Although using both of these measures results in a significant reduction of sample size (roughly a one-third reduction for the current ETR and a two-thirds reduction for the cash ETR), we find that our results remain robust to these alternative measures.
Third, we include country fixed effects in our main tests to control for unobserved country level differences. However, as these effects might also subsume some of effect we are investi-gating, we perform untabulated robustness tests that do not include these fixed effects. We
Fourth, although we use the unadjusted pre-tax income as a scalar to calculate ETRs in our main tests, we also adjust the pre-tax income scalar for extraordinary items and discontinued operations. In untabulated tests we find that our results continue to hold and are slightly greater in magnitude using this alternative measure.
Fifth, because tax avoidance may systematically vary by industry, we perform untabu-lated robustness tests that include industry fixed effects and find that our results continue to persist.
Sixth, since Japan is the country with the largest representation in our sample, in unt-abulated robustness tests we exclude Japan from each test and find our inferences remain qualitatively unchanged.
Seventh, because our study uses a broad cross-country sample, it is possible that country-level changes in accounting policies may materially impact measurement of our accounting-based variables and thus our results. In untabulated robustness tests, we remove all firm year observations that report a change in accounting method, such that for any given firm, the sample includes observations under only one accounting regime. We find our results are robust to this modification.
Finally, we perform untabulated tests in which both the year of GAAR enactment and the year immediately succeeding the enactment are excluded from the sample and find our inference remain unchanged.
5
Conclusion
This paper provides evidence of the effect of the presence of a GAAR on both the level and distribution of tax avoidance. Specifically, it shows that the presence of a GAAR increases corporate tax revenues collected, decreases firm-level tax avoidance, and lowers firm-level ETR volatility (a measure of tax risk). We find that, although the GAAR interestingly appears to have a significant effect on the average firm, that its effect is greatest for firms that are more aggressive in avoiding tax, for countries with lax enforcement prior to the enactment of the GAAR, and in countries where the taxpayer bears some portion of the burden of proof. Documenting these effects are important as it provides evidence on an important and increasingly prevalent tax enforcement tool available to the tax authority. In addition, these results are helpful to policymakers in evaluating the effectiveness of a GAAR for their regime. Finally, our study provides direct evidence on a specific mechanism of the tax enforcement black box.
References
Armstrong, C. S., Blouin, J. L., Larcker, D. F., 2012. The incentives for tax planning. Journal of Accounting and Economics 53, 391–411.
Atwood, T., Drake, M. S., Myers, J. N., Myers, L. A., 2012. Home country tax system char-acteristics and corporate tax avoidance: International evidence. The Accounting Review 87, 1831–1860.
Atwood, T., Drake, M. S., Myers, L. A., 2010. Book-tax conformity, earnings persistence and the association between earnings and future cash flows. Journal of Accounting and Economics 50, 111–125.
Bloomberg Law, 2009. Mexico’s journey to substance over form.
URLhttps://www.bna.com/mexicos-journey-substance-n2147483696/ Central Intelligence Agency, 2018. The World Factbook.
URLhttps://www.cia.gov/library/publications/the-world-factbook/
Deloitte, 2017. General anti-avoidance rules (GAAR): India and international experience. Desai, M. A., Dyck, A., Zingales, L., 2007. Theft and taxes. Journal of Financial Economics
84, 591–623.
Djankov, S., La Porta, R., de Silanes, F. L., Shleifer, A., 2008. The law and economics of self-dealing. Journal of Financial Economics 88, 430–465.
Dyck, A., Zingales, L., 2004. Private benefits of control: An international comparison. The Journal of Finance 59, 537–600.
Dyreng, S. D., Hanlon, M., Maydew, E. L., 2008. Long-run corporate tax avoidance. The Accounting Review 83, 61–82.
El Ghoul, S., Guedhami, O., Pittman, J., 2011. The role of IRS monitoring in equity pricing in public firms. Contemporary Accounting Research 28, 643–674.
Erickson, M., Hanlon, M., Maydew, E. L., 2004. How much will firms pay for earnings that do not exist? Evidence of taxes paid on allegedly fraudulent earnings. The Accounting Review 79, 387–408.
Ernst&Young, Feb. 2013. GAAR rising: Mapping tax enforcement’s evolution. Ernst&Young, 2017. Worldwide corporate tax guide.
Frank, M. M., Lynch, L. J., Rego, S. O., 2009. Tax reporting aggressiveness and its relation to aggressive financial reporting. The Accounting Review 84, 467–496.
Gupta, S., Newberry, K., 1997. Determinants of the variability in corporate effective tax rates: Evidence from longitudinal data. Journal of Accounting and Public Policy 16, 1–34.
Hanlon, M., Heitzman, S., 2010. A review of tax research. Journal of Accounting and Eco-nomics 50, 127–178.
Hanlon, M., Hoopes, J. L., Shroff, N., 2014. The effect of tax authority monitoring and enforcement on financial reporting quality. The Journal of the American Taxation Associ-ation 36, 137–170.
Hanlon, M., Slemrod, J., 2009. What does tax aggressiveness signal? Evidence from stock price reactions to news about tax shelter involvement. Journal of Public Economics 93, 126–141.
Hoopes, J. L., Mescall, D., Pittman, J. A., 2012. Do IRS audits deter corporate tax avoid-ance? The Accounting Review 87, 1603–1639.
International Law Office, 2011. Anti-avoidance rules for reorganisation transactions. URLhttps://www.internationallawoffice.com
Johansson, A., Skeie, O. B., Sorbe, S., 2016. Anti-avoidance rules against international tax planning: A classification, OECD Working paper.
Johansson, A., Skeie, O. B., Sorbe, S., Menon, C., 2017. Tax planning by multinational firms: Firm-level evidence from a cross-country database, OECD Working paper.
Kerr, J. N., 2018a. Information opacity, information shocks, and tax avoidance. Contempo-rary Accounting Research, Forthcoming.
Kerr, J. N., 2018b. The value relevance of taxes: International evidence on the proxy for profitability role of tax surprise, Working paper, The Ohio State University.
Kerr, J. N., Price, R., Rom´an, F. J., 2017. Corporate governance and tax avoidance: Evidence from governance reform, Working paper, The Ohio State University.
La Porta, R., de Silanes, F. L., Shleifer, A., 1998. Law and finance. Journal of Political Economy 106, 1113–1155.
Lennox, C., Lisowsky, P., Pittman, J., 2013. Tax aggressiveness and accounting fraud. Jour-nal of Accounting Research 51, 739–778.
Mills, L. F., Nutter, S. E., Schwab, C. M., 2013. The effect of political sensitivity and bargaining power on taxes: Evidence from federal contractors. The Accounting Review 88, 977–1005.
PricewaterhouseCoopers LLP, 2004. Tax risk management.
Rego, S. O., 2003. Tax-avoidance activities of U.S. multinational corporations. Contemporary Accounting Research 20, 805–833.
Slemrod, J., Blumenthal, M., Christian, C., 2001. Taxpayer response to an increased prob-ability of audit: Evidence from a controlled experiment in Miinnesota. Journal of Public Economics 79, 455–483.
Sloan, R. G., 1996. Do stock prices fully reflect information in accruals and cash flows about future earnings? The Accounting Review 71, 289–315.
Wilson, R., 2009. An examination of corporate tax shelter participants. The Accounting Review 83, 519–548.
Appendix A: Variable Definitions
Variable Description and Data Source
Book ETR The ratio of total tax expense (TXT) to pre-tax income (PI).
Book ETR Vol One-year lagged five-year rolling standard deviation of tax avoidance, where tax avoidance is computed by Book ETR.
Book Ratio Book ETR / CSTR
Book Ratio Vol One-year lagged five-year rolling standard deviation of tax avoidance, where tax avoidance is computed by Book Ratio.
Book Spread Book ETR - CSTR
Book Spread Vol One-year lagged five-year rolling standard deviation of tax avoidance, where tax avoidance is computed by Book Spread.
CorpTaxRev Country-year level measure of total corporate income, profits, and capital gains taxes, scaled by country GDP.
Burden-Shared An indicator variable set equal to 1 for observations in countries where the burden of proof is shared by the taxpayer and the tax authority.
Burden-Taxpayer An indicator variable set equal to 1 for observations in countries where the burden of proof falls on the taxpayer.
Burden-Taxpayer or Shared
An indicator variable set equal to 1 for observations in countries where the burden of proof either falls on the taxpayer or is shared by the taxpayer and the tax authority.
GAAR Indicator variable set equal to 1 for firms years ending after the GAAR (or GAAR-like provision) enactment (or legislative strengthening) date.
HI Avoider Indicator variable set equal to 1 for firms with 3-year long run tax avoidance in year t-1 exceeding the median long-run tax avoidance of all other firms in that particular country, where t is the year of the GAAR. Tax avoidance is computed as book ETR, book ratio, and book spread, as defined above. LO Enforce Indicator variable set equal to 1 for countries with tax enforcement in year t-1 that falls below the median enforcement of all countries in the sample in that year, where t is the year of the GAAR. Yearly tax enforcement is measured using the tax evasion index obtained from the IMD World Competitiveness Report website. The tax evasion index measures manager's perception of the strength of the tax enforcement in that country.
Age Log of 1 + firm Age, where Age is computed as the current firm year less the first year the firm’s GVKEY or ISIN appears in Compustat.
AntiDirRights Country-level index variable for anti-director rights as reported in La Porta et al. (1998). Higher scores correspond to less director-related rights.
ASD Index Country-level index variable based on the anti-self dealing index (Djankov et al. 2008), which measures the strength of minority shareholder protection against self-dealing by the controlling shareholder. Higher values correspond to greater protection.
BookTaxConf Country-level variable for conformity between book and tax income as reported in Atwood et al. (2012). Higher scores correspond to greater conformity between book and tax.
BTM Ratio of book value of equity (CEQ) to market value of equity (PRCCD * shares outstanding)
CF Constraint 1 minus the ratio of operating cash flows (OANCF) to beginning of year assets (ATt-1). If OANCF is
missing, this variable is set equal to zero.
Civil Law Indicator variable set equal to 1 for country-years with Civil Law systems.
CSTR Statutory corporate income tax rate for a given country-year.
Cross-Sectional Variables Dependent Variables
Variable Description and Data Source
Leverage Sum of long term debt (DLTT) and current debt (DLC), scaled by beginning of year assets (ATt-1).
Loss Firm Indicator set equal to 1 if a the sum of pre-tax income (PI) for the current and prior year is less than zero.
MVE Month-end price close (PRCCD) multiplied by the number of shares outstanding, in millions, (CSHOC / 1,000,000), scaled by beginning of year assets (ATt-1).
OwnCon Country-level index variable representing the concentration of ownership as reported in La Porta et al. (1998). Measured as the average percentage of common shares owned by the three largest
shareholders in the ten largest non financial, privately-owned domestic firms in a given country. Higher scores correspond to more concentrated ownership.
PBOpp_C Country-level variable for the opportunities of private benefits extraction based upon the Anti-Self Dealing Index as reported in Djankov et al. (2008). Set equal to one when a country has an index score in the bottom quartile of all countries, and zero otherwise.
PP&E Total property, plant, and equipment, net of depreciation (PPENT), scaled by beginning of year assets (ATt-1).
R&D Total R&D expense (XRD), scaled by beginning of year assets (ATt-1). If XRD is missing, this value
is set equal to zero.
ROA Pre-tax income (PI), scaled by beginning of year assets (ATt-1).
Size Log of firm size, where size is equal to total assets (ATt) converted to a common currency (USD).
VOL Rank Decile ranking of ROA volatility, measured at the country-year level, where higher values represent higher earnings volatility.
Worldwide Country-level indicator variable for the presence of a worldwide taxation system as reported in Atwood et al. (2012). Set equal to one if the country has a worldwide tax system in place, and zero otherwise.
Country ISO Code In Country-Level Sample? In Firm-Level Sample? Effective Date GAAR Type E&Ya Johansson et al. (2016)b Other
Source Ref Note
Australia AUS YES YES 1/1/2016 GAAR 5/27/1981 1981 c 2
Belgium BEL YES YES 4/6/2012 GAAR 4/6/2012 2012 a 2
Brazil BRA YES YES 1/1/2001 GAAR 2001 2001 1/1/2001 c
Canada CAN YES NO 9/12/1988 GAAR 9/12/1988 1988 a
China CHN NO YES 1/1/2008 GAAR 1/1/2008 2008 a
Czech Republic CZE NO YES 1/1/2005 GAAR-LIKE - 2005 b 1
Estonia EST NO YES 1/1/2002 GAAR - 2002 b 1
France FRA YES NO 1/1/1941 GAAR 1941 1981 a 1
Germany DEU YES YES 1/1/2008 GAAR 1/1/2008 2008 a 2
Greece GRC NO YES 1/1/2014 GAAR - 2014 b 1
Iceland ISL NO NO 1/1/1971 GAAR - 1971 b 1
India IND NO NO 4/1/2017 GAAR-LIKE 4/1/2016 - 4/1/2017 f
Indonesia IDN NO YES 1/1/2009 GAAR-LIKE 1/1/2009 - a 3
Ireland IRL NO YES 10/23/2014 GAAR 1/25/1989 1989 f 2
Italy ITA YES NO 1/1/1997 GAAR 1997 1997 a 1
Japan JPN YES YES 1/1/2001 GAAR-LIKE - - 1/1/2001 d 1,4
Luxembourg LUX NO NO 1/1/1948 GAAR - 1948 b 1
Malaysia MYS NO NO 1/1/1967 GAAR - 1967 b 1
Mexico MEX YES YES 1/1/2008 GAAR-LIKE - - 1/1/2008 e 5
New Zealand NZL NO NO 1/1/1974 GAAR - 1974 b 1
Poland POL NO YES 7/15/2016 GAAR-LIKE - - 7/15/2016 f 6
Russia RUS NO YES 10/12/2006 GAAR-LIKE 10/12/2006 2006 a
Singapore SGP YES NO 1/29/1988 GAAR 1/29/1988 1988 a
South Africa ZAF YES YES 11/2/2006 GAAR 11/2/2006 2006 a
South Korea KOR YES NO 1/1/1990 GAAR-LIKE 1/1/1990 1990 a
Spain ESP YES YES 1/1/2003 GAAR - 2003 b 1,2
Sweden SWE YES NO 1/1/1995 GAAR 1995 1995 a 1
Switzerland CHE YES NO 12/14/1962 GAAR 12/14/1962 1962 a
The Netherlands NLD YES NO 1/1/1924 GAAR 1924 1987 a 1
Turkey TUR NO NO 12/30/1980 GAAR 12/30/1980 1980 a
Appendix B: GAAR effective dates
References: a
b
c Deloitte, "General Anti-Avoidance Rules (GAAR) India and International Experience". March 2017.
d International Law Office, "Anti-avoidance rules for reorganisation transactions". https://www.internationallawoffice.com. e Bloomberg Law, "Mexico's Journey to Substance over Form". March 2, 2009.
f E&Y, "Worldwide Corporate Tax Guide". 2017. Notes: 1 2 3 4 5 6 7
Johansson does not note a GAAR or economic substance rule for Indonesia. However, the Indonesian tax law regulations established the principle of substance over form, which we classify as GAAR-like, in 2009.
E&Y shows Japan as having a GAAR-like regime; Johansson does not show an economic substance rule or GAAR for Japan. Per E&Y, Japanese corporate tax law provides a general tax avoidance rule for closely held corporations and a general tax avoidance rule for transactions within a consolidated group. Under these rules, the Japanese National Tax Agency can recalculate the taxpayer’s taxable income or corporate tax due if the NTA determines a transaction results in an unreasonable reduction of corporate tax due. We classify these 2001 rules as GAAR-like.
E&Y show Mexico as having a GAAR-like regime; Johansson does not show an economic substance rule or GAAR for Mexico. Per Bloomberg Law, Article 213 of the MITL was effective in 2008 and allowed tax authorities to recharacterize tax treatment of transactions. We classify this law as GAAR-E&Y shows Poland as having a GAAR-like regime; Johansson does not show an economic substance rule or GAAR for Poland. Poland had a GAAR enacted beginning in 2003 until it was overturned in May 11, 2004. The GAAR was reintroduced in 2016.
Johansson et al. (2016) and E&Y 2013 show the UK as having no GAAR, likely due to these studies ending prior to the UK GAAR enactment. E&Y, "GAAR rising – Mapping tax enforcement’s evolution". February 2013.
Johansson Å., Skeie Ø. and S. Sorbe (2016b), “Anti-avoidance rules against international tax planning: a classification”, OECD Economics Department Working Papers No. 1356, OECD Publishing.
In cases where only the year of GAAR enactment was identified (as opposed to the specific day within the enactment year), January 1 of the GAAR enactment year was used as the effective date for our analysis.
The effective dates listed for Australia, Belgium, Germany, Ireland, and Spain represent dates of major legislative changes to pre-existing GAAR regimes. Each of these countries had initial GAARs enacted prior to the sample period start.
Country N CorpTaxRev Worldwide Vol Rank
Burden
of Proof AntiDirRights BookTaxConf OwnCon ASD Index PBOpp_C
AUSTRALIA 19 5.04 1.0 9.11 T 4 0.13 0.28 0.76 0 BELGIUM 20 3.06 0.0 6.00 TA 0 0.22 0.54 0.54 0 BRAZIL 19 2.39 1.0 5.47 T 3 0.41 0.57 0.27 1 CANADA 20 3.39 0.0 9.35 S 5 0.03 0.40 0.64 0 FRANCE 20 2.56 0.0 6.05 TA 3 0.78 0.34 0.38 0 GERMANY 20 1.65 0.0 6.85 S 1 0.12 0.48 0.28 1 ITALY 20 2.68 1.0 3.55 TA 1 0.56 0.58 0.42 0 JAPAN 20 3.62 0.6 2.70 TA 4 0.71 0.18 0.50 0 MEXICO 15 2.04 1.0 3.33 TA 1 0.41 0.64 0.17 1 NETHERLANDS 20 3.15 0.0 5.05 TA 2 0.65 0.39 0.20 1 SINGAPORE 19 4.56 0.0 5.89 T 4 0.75 0.49 1.00 0 SOUTH AFRICA 19 2.46 1.0 8.05 S 5 0.09 0.52 0.81 0 SOUTH KOREA 20 3.15 1.0 4.85 T 2 0.59 0.23 0.47 0 SPAIN 20 2.80 0.0 4.35 4 0.91 0.51 0.37 0 SWEDEN 20 2.89 0.0 7.35 T 3 0.42 0.28 0.33 0 SWITZERLAND 20 2.56 0.0 3.35 S 2 0.88 0.41 0.27 1 UNITED KINGDOM 20 2.98 0.6 8.40 TA 5 0.47 0.19 0.95 0 331
Panel A: Country-level sample composition with descriptive statistics
This table presents sample composition for the country-level analysis, along with a summary of pertinent descriptive statistics. Variable definitions are available in the Appendix. The descriptive statistics are based on data for the fiscal years ending January 31, 1998 to December 31, 2017 and with data sufficient to estimate the least restrictive empirical model. The Anti-Self Dealing Index is as reported in Djankov et al. (2008) and is used to create the PBOpp_C variable.
Coefficient T-statistic Coefficient T-statistic GAAR + 0.355*** [3.352] 0.340*** [3.154] CSTR 0.140 [0.207] 0.563 [0.692] Worldwide 0.214** [2.201] 0.181* [1.876] VOL Rank -0.002 [-0.093] -0.005 [-0.206] Civil Law -1.437*** [-6.654] -1.491*** [-7.281] AntiDirRights -0.235*** [-4.819] -0.241*** [-5.246] BookTaxConf 1.012*** [4.265] 1.049*** [4.443] OwnCon -2.076*** [-4.900] -2.114*** [-5.112] PBOpp_C -0.491*** [-4.699] -0.476*** [-4.549] Fixed Effects Observations R-Squared
Panel B: Country-level analysis of the effect of the presence of a GAAR on corporate tax revenue collections Table 1 Predicted Sign -331 (1) CorpTaxRev CorpTaxRev (2) 0.379 Year 331 0.430
This table presents OLS regression estimations of country-level corporate tax revenues. The dependent variable in all specifications is CorpTaxRev, which is the corporate income tax collected by the jurisdiction for the year as a percentage of GDP. The primary independent variable of interest is GAAR, an indicator set equal to 1 for firm years ending after the GAAR effective date. All variables are as defined in the Appendix. T-statistics are reported in brackets next to the coefficients. Year fixed effects are included in
specification 2 as indicated, though coefficients are suppressed. Significance levels are based upon two-sided t-tests and are indicated as follows: * p<0.1, ** p<0.05, *** p<0.01.
Compustat Global observations for the fiscal years ending January 1, 1998 to December 31, 2017 229,229
Compustat North America observations for the fiscal years ending January 1, 1998 to December 31, 2017 2,538 Mexico
Total Observations obtained from Compustat 231,767
Less: observations with missing or non-positive AT (9,674) Less: observations with missing or non-positive PI (58,828) Less: observations with missing or non-positive one-year lagged AT (12,382) Less: observations with missing TXT (1,760) Less: observations with missing MVE (449) Less: observations with missing PP&E (6,501) Less: observations with missing Leverage (5,157) Less: observations with other missing control variables (190) Total Observations for Book Ratio, Book ETR, and Book Spread Samples 136,826
Table 2: Firm-level sample selection
Australia, Belgium, Brazil, China, Czech Republic, Estonia, Germany, Greece, Indonesia, Ireland, Japan, Poland, Russia, South Africa, Spain, and United Kingdom.
Variable Observations Mean Std. Dev. Min Max GAAR 136,826 0.644 0.479 0.000 1.000 CSTR 136,826 0.328 0.069 0.190 0.491 ROA 136,826 0.083 0.086 0.002 0.504 MVE 136,826 1.438 2.584 0.031 20.108 Leverage 136,826 0.225 0.212 0.000 0.996 Size 136,826 5.920 1.897 1.635 11.532 Age 136,826 2.521 0.546 1.099 3.401 BTM 136,826 1.016 1.087 0.001 7.565 Intangibles 136,826 0.079 0.163 0.000 0.887 PP&E 136,826 0.284 0.215 0.000 0.863 R&D 136,826 0.009 0.022 0.000 0.131 Loss Firm 136,826 0.068 0.252 0.000 1.000 CF Constraint 136,826 0.928 0.091 0.583 1.176 Book ETR 136,826 0.311 0.294 -0.675 1.924 Book Ratio 136,826 0.934 0.874 -2.236 5.761 Book Spread 136,826 -0.017 0.281 -0.992 1.583
Panel A: Firm-level descriptive statistics
This table presents a summary of firm-level descriptive statistics. Variable definitions are available in the Appendix. The descriptive statistics are based on data for the fiscal years ending January 31, 1998 to December 31, 2017 and with data sufficient to estimate the least restrictive empirical model.
Country N Book ETR Book Ratio Book Spread GAAR Effective Date CSTR IMD Tax Evasion Index Burden of
Proof ROA MVE Leverage Size Age BTM Intangibles PP&E R&D Loss Firm CF Constraint AUSTRALIA 8,291 0.219 0.713 (0.087) 1/1/2016 0.3056 5.8271 T 0.134 1.705 0.224 5.143 2.296 0.845 0.198 0.253 0.007 0.117 0.901 BELGIUM 1,414 0.221 0.623 (0.133) 4/6/2012 0.3543 3.5446 0.091 1.025 0.241 6.259 2.417 1.170 0.135 0.252 0.012 0.062 0.920 BRAZIL 2,941 0.241 0.705 (0.099) 1/1/2001 0.3404 3.0671 T 0.098 4.439 0.304 6.997 2.410 1.312 0.104 0.278 0.002 0.073 0.923 CHINA 26,700 0.197 0.731 (0.074) 1/1/2008 0.2702 3.6588 T 0.073 2.422 0.239 6.217 2.413 0.650 0.062 0.315 0.007 0.058 0.940 CZECH REPUBLIC 232 0.222 0.863 (0.044) 1/1/2005 0.2654 3.9918 0.080 0.627 0.148 6.561 2.014 1.896 0.028 0.501 0.001 0.034 0.898 ESTONIA 156 0.125 0.581 (0.099) 1/1/2002 0.2240 4.7818 0.140 0.736 0.208 4.731 2.257 3.074 0.076 0.392 0.002 0.026 0.856 GERMANY 7,522 0.302 0.861 (0.053) 1/1/2008 0.3503 5.0947 0.090 1.089 0.209 5.848 2.441 0.885 0.140 0.213 0.018 0.079 0.921 GREECE 2,004 0.369 1.265 0.069 1/1/2014 0.2964 2.2827 0.074 1.013 0.301 5.479 2.021 1.417 0.056 0.332 0.003 0.060 0.953 INDONESIA 3,971 0.273 1.001 (0.000) 1/1/2009 0.2718 3.5248 S 0.107 2.851 0.293 5.258 2.316 1.015 0.022 0.332 0.000 0.071 0.920 IRELAND 635 0.175 1.170 0.017 10/23/2014 0.2047 5.8259 0.089 1.166 0.240 6.586 2.533 0.753 0.182 0.275 0.009 0.066 0.904 JAPAN 54,322 0.427 1.104 0.039 1/1/2001 0.3893 5.9644 TA 0.064 0.775 0.215 5.937 2.772 1.204 0.024 0.291 0.012 0.066 0.940 MEXICO 1,766 0.283 0.914 (0.027) 1/1/2008 0.3098 2.3940 TA 0.095 1.090 0.268 9.352 2.451 1.066 0.129 0.373 0.000 0.028 0.905 POLAND 3,960 0.202 1.000 0.001 7/15/2016 0.1984 3.8668 S 0.093 1.290 0.203 4.386 2.141 1.043 0.101 0.272 0.002 0.079 0.925 RUSSIA 1,143 0.285 1.361 0.079 10/12/2006 0.2045 3.0220 T 0.104 2.059 0.270 6.962 2.270 2.401 0.037 0.412 0.001 0.063 0.910 SOUTH AFRICA 3,819 0.273 0.793 (0.079) 11/2/2006 0.3522 4.5212 S 0.144 1.373 0.184 5.683 2.258 0.933 0.107 0.242 0.002 0.045 0.896 SPAIN 1,775 0.213 0.670 (0.107) 1/1/2003 0.3200 4.1501 0.078 0.995 0.296 7.290 2.471 1.533 0.123 0.300 0.002 0.044 0.949 UNITED KINGDOM 16,175 0.244 0.870 (0.036) 7/17/2013 0.2784 5.5690 TA 0.105 1.382 0.205 5.604 2.343 0.848 0.191 0.230 0.012 0.069 0.897 136,826
Panel B: Firm-level sample composition by country with descriptive statistics
This table presents sample composition by country along with a summary of pertinent descriptive statistics. Variable definitions are available in the Appendix. Where relevant, mean values of firm-year variables are reported. The descriptive statistics are based on data for the fiscal years ending January 31, 1998 to December 31, 2017 and with data sufficient to estimate the least restrictive empirical model.