Data-driven Methods for
Course Selection and Sequencing
A THESIS
SUBMITTED TO THE FACULTY OF THE GRADUATE SCHOOL OF THE UNIVERSITY OF MINNESOTA
BY
Sara Morsy
IN PARTIAL FULFILLMENT OF THE REQUIREMENTS FOR THE DEGREE OF
Doctor Of Philosophy
Prof. George Karypis
c
Sara Morsy 2019
Acknowledgements
This thesis was done with the support and help of so many wonderful people, whom I would like to thank from the bottom of my heart.
First of all, I would like to thank my advisor George Karypis. He is an amazing teacher and researcher, and he really shows his interest in teaching all of his lab members on a very personal level. I have learned a lot from him, from research skills, to data mining and machine learning, to scientific writing and critical thinking. He has spent a lot of effort with me going deep into the small details of every piece of the research to teach me how to do everything right. He has been a great mentor to me, and has supported me through all the challenging times I have faced during my PhD. I could not thank him enough for all what he did with me.
I would like to thank Professors Rui Kuang, Vipin Kumar, Nikolaos Sidiropoulos, Zizhuo Wang, and Lana Yarosh for serving on my thesis and preliminary exams. They have such deep knowledge in the field that I was fortunate enough to have them on my committees. Their comments and feedback have been tremenedously useful to shaping my research.
A very special thanks goes to both my parents, who have supported me to a great extent during my PhD, and without whom I would have faced many more challenges during that period. Both of them have flied a very long distance just to come and support me when I gave birth to my daughter, until she grew old enough to go to a daycare. My husband, Hesham, has always been a great supporter for me and had taught me a lot of programming skills that helped me during my PhD. Being both PhD students during most of my PhD was such a positive thing for both of us. A special thanks to my little daughter, Jana, who has been the main source of joy and inspiration for me the moment she was born. I would also like to thank my siblings, Salma and
Moamen, who have been always supporting me and giving me positive comments when I needed them the most.
The PhD journey could have been a lot harder without my second Egyptian family whom I knew when I first went to Minnesota and we started our PhD journey together. Specifically, I would like to thank Amr, Eman, and Reem for everything and every moment we spent together. This second family also grew bigger when Ibrahim, Heba, Ahmed, and Sara joined us in Minnesota later. Our times together, in the bus shuttle going to and from campus, at one of our homes, and at the many places and restaurants we went to will always be great memories for me. Also, giving birth to our first kids at similar times and watching them grow and play together and spending most of their days together at the daycare will always be invaluable to me.
I was also lucky to belong to a wonderful research lab consisting of many bright minded and supportive people, where we spent good times together helping each other in research and in coding, as well as enjoying our free time together. Specifically, I would like to thank: Agi, Ancy, Asmaa, Eva, Maria, Shalini, Xia, David, Dominique, Haoji, Jeremy, Mohit, Rezwan, Santosh, Saurav, and Shaden. I would also like to thank a special friend from another lab: Cheng Jin, for all the funny times we spent together and all her help in Minnesota and in California as well.
Last, a great thanks to the staff the Department of Computer Science, the Digital Technology Center, and the Minnesota Supercomputing Institute at the University of Minnesota for providing the resources which were crucial for my research and for helping me so many times on so many things.
Dedication
To my parents, Faiza and Ahmed. To my love, Hesham. To my sweet little daughter, Jana. To my brother, Moamen. To my sister, Salma.
Abstract
Learning analytics in higher education is an emerging research field that combines data mining, machine learning, statistics, and education on learning-related data, in order to develop methods that can improve the learning environment for learners and allow edu-cators and administrators to be more effective. The vast amount of data available about students’ interactions and their performance in classrooms has motivated researchers to analyze this data in order to gain insights about the learning environment for the ul-timate goal of improving undergraduate education and student retention rates. In this thesis, we focus on the problem of course selection and sequencing, where we would like to help students make informed decisions about which courses to register for in their following terms. By analyzing the historical enrollment and grades data, this thesis studies the two main problems of course selection and sequencing, namely grade pre-diction and course recommendation. In addition, it analyzes the relationship between degree planning in terms of course timing and ordering and the students’ GPA and time to degree.
First, we focus on predicting the grades that students will obtain on future courses so that they can make informed decisions about which courses to register for in their following terms. We model the grade prediction problem as cumulative knowledge-based linear regression models that learn the courses’ required and provided knowledge components and use them to estimate a student’s knowledge state at each term and predict the grades that he/she can obtain on future courses.
Second, we focus on improving the knowledge-based regression models we previously developed by modeling the complex interactions among prior courses using non-linear and neural attentive models, in order to have more accurate estimation of a student’s knowledge state. In addition, we model the interactions between a target course, which we would like to predict its grade, and the other courses taken concurrently with it. We hypothesize that concurrently-taken courses can affect a student’s performance in a target course, and thus modeling their interactions with that course should lead to better predictions.
Third, we focus on analyzing the degree plans of students to gain more insights about how course timing and sequencing relate to their GPAs and time to degree. Toward this end, we define several course timing and course sequencing metrics and compare different sub-groups of students who have achieved high vs low GPA as well as sub-groups of students who have graduated on time vs over time.
Fourth, we focus on improving course recommendation by recommending to each student a set of courses which he/she is prepared for and expected to perform well in. We model this problem as a grade-aware course recommendation problem, where we propose two different approaches. The first approach ranks the courses by using an objective function that differentiates between courses that are expected to increase or decrease a student’s GPA. The second approach combines the grades predicted by grade prediction methods with the rankings produced by course recommendation methods to improve the final course rankings. To obtain the course rankings in both approaches, we adapted two widely-used representation learning techniques to learn the optimal temporal ordering between courses.
In summary, this thesis addresses two closely related problems by: (1) develop-ing cumulative knowledge-based regression models for grade prediction; (2) developdevelop-ing context-aware non-linear and neural attentive knowledge-based models for grade predic-tion; (3) analyzing degree planning and how the time when students take courses and how they sequence them relate to their GPAs and time to degree; and (4) developing novel approaches for grade-aware course recommendation.
Contents
Acknowledgements i
Dedication iii
Abstract iv
List of Tables x
List of Figures xii
1 Introduction 1
1.1 Key Contributions . . . 2
1.1.1 Cumulative Knowledge-based Regression Models (CKRM) . . . . 2
1.1.2 Context-aware Non-linear and Neural Attentive Knowledge-based Models . . . 3
1.1.3 Analysis of How Course Timing and Sequencing Relate to Stu-dents’ GPAs and Time to Degree . . . 4
1.1.4 Grade-aware Course Recommendation Approaches . . . 5
1.2 Outline . . . 6
1.3 Related Publications . . . 7
2 Notations and Definitions 9 3 Background and Related Work 10 3.1 Grade Prediction . . . 10
3.2 Course Recommendation . . . 13
3.3 Representation Learning . . . 14
3.3.1 Neural Attentive Models . . . 15
4 Evaluation Metrics for Grade Prediction 17 5 CKRM: Cumulative Knowledge-based Regression Models for Grade Prediction 18 5.1 Introduction and Motivation . . . 18
5.2 Main Contributions . . . 19
5.3 Proposed Models . . . 20
5.3.1 The Course Knowledge Component Space . . . 21
5.3.2 Parameter Estimation . . . 23
5.4 Experimental Evaluation . . . 25
5.4.1 Dataset Preprocessing . . . 25
5.4.2 Generating Train, Validation, and Test Sets . . . 26
5.4.3 Baseline/Competing Methods . . . 27
5.4.4 Evaluation Methodology and Performance Metrics . . . 28
5.4.5 Model Selection . . . 28
5.5 Results . . . 28
5.5.1 Quantitative Performance on Major Courses . . . 29
5.5.2 Quantitative Performance on Non-major Courses . . . 31
5.5.3 Predicted versus Actual Letter Grade Distribution . . . 33
5.5.4 Qualitative Analysis of CKRMtext’s Models . . . 33
5.6 Summary . . . 36
6 Context-aware Non-linear and Neural Attentive Knowledge-based Mod-els for Grade Prediction 38 6.1 Main Contributions . . . 39
6.2 Non-linear and Neural Attentive Knowledge-based Models . . . 40
6.2.1 Maximum Knowledge-based Models . . . 40
6.2.2 Neural Attentive Knowledge-based Models . . . 42
6.3 Context-aware Non-linear and Neural Attentive Models . . . 45
6.3.1 Context-aware Maximum Knowledge-based Models . . . 46
6.3.2 Context-aware Neural Attentive Knowledge-based Models . . . . 47
6.4 Model Optimization . . . 48
6.5 Evaluation Methodology . . . 48
6.5.1 Dataset . . . 48
6.5.2 Generating Training, Validation and Test Sets . . . 49
6.5.3 Baseline Methods . . . 49
6.5.4 Model Selection . . . 49
6.6 Experimental Results . . . 50
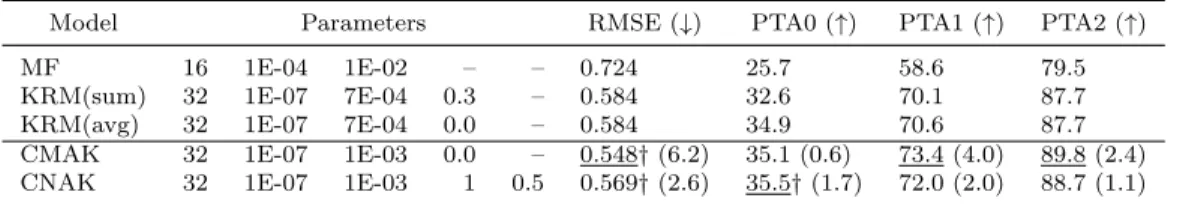
6.6.1 Performance against Competing Methods . . . 50
6.6.2 Effect of Estimating Student’s Knowledge State via Non-linear and Neural Attentive Models . . . 52
6.6.3 Effect of Modeling Concurrent Courses’ Effect . . . 53
6.6.4 Qualitative Analysis on the Prior Courses Attention Weights . . 54
6.7 Summary . . . 55
7 A Study on Degree Planning and Its Relationship with Graduation GPA and Time To Degree 56 7.1 Main Contributions . . . 58
7.2 Analysis of Degree Planning . . . 59
7.2.1 Data Extraction and Pre-processing . . . 59
7.2.2 Data Analysis . . . 60
7.3 Results . . . 64
7.3.1 How does the timing of taking courses with respect to the stu-dent’s academic level relate to their graduation GPA and TTD? 65 7.3.2 How does the pairwise degree similarity between pairs of students relate to the similarity in their graduation GPA and TTD? . . . 67
7.4 Case Study: TTD Prediction . . . 70
7.4.1 Features . . . 71
7.4.2 Experimental Setup and Evaluation . . . 72
7.4.3 Experimental Results . . . 73
7.5 Summary . . . 73
8 Grade-aware Course Recommendation Approaches 77
8.1 Main Contributions . . . 78
8.2 Proposed Approaches . . . 79
8.2.1 Grade-aware Representation Learning Approaches . . . 80
8.2.2 Combining Course Recommendation with Grade Prediction . . . 85
8.3 Experimental Evaluation . . . 86
8.3.1 Dataset Description and Preprocessing . . . 86
8.3.2 Baseline and Competing Methods . . . 87
8.3.3 Evaluation Methodology and Metrics . . . 89
8.3.4 Model Selection . . . 91
8.4 Results . . . 92
8.4.1 Comparison of the Representation Learning Approaches for Grade-aware Course Recommendation . . . 92
8.4.2 Comparison of the Grade-aware Recommendation Approaches Com-bining Grade Prediction with Course Recommendation . . . 93
8.4.3 Comparison of the Proposed Approaches for Grade-aware Course Recommendation . . . 94
8.4.4 Representation Learning vs Competing Approaches for Grade-aware Course Recommendation . . . 95
8.4.5 Grade-aware vs Grade-unaware Representation Learning Approaches 95 8.5 Analysis of Recommendation Accuracy . . . 96
8.6 Characteristics of Recommended Courses . . . 99
8.6.1 Course Difficulty . . . 99
8.6.2 Course Popularity . . . 100
8.7 Summary . . . 100
9 Conclusions and Future Directions 104 9.1 Summary of Contributions . . . 104
9.2 Future Research Directions . . . 107
References 108
List of Tables
5.1 Information about the Different Majors . . . 25 5.2 Datasets Statistics . . . 26 5.3 Prediction Performance of the Different Methods on Major Courses . . . 30 5.4 Effect of Major’s Flexibility on the Relative CKRM’s Performance on Major
Courses. . . 31 5.5 Prediction Performance of the Different Methods on Non-major Students . . . 32 5.6 Top-20 Keywords for a Sample of Four CSE Courses . . . 35 6.1 Sample of prior and target courses for a Computer Science student at the
University of Minnesota. . . 43 6.2 Comparison with baseline methods. . . 51 6.3 Severe under- and over-predictions by baseline and proposed models. . . 51 6.4 Effect of estimating students’ knowledge states via non-linear and neural
attentive models. . . 52 6.5 Effect of modeling concurrent courses on students’ performance in target
courses. . . 53 6.6 The attention weights of the prior courses with each target course for the
sample student from Table 6.1. . . 55 7.1 Dataset statistics. . . 60 7.2 Summary of the course timing metrics results among high and low
GPA-and TTD-based student groups across all majors. . . 65 7.3 Summary of the degree similarity metrics results among different pairs of
GPA- and TTD-based student groups across all majors. . . 68
7.4 Summary of the sequence similarity results among different pairs of GPA-and TTD-based student groups, grouped by their academic division, across all majors. . . 69 7.5 TTD prediction results using the academic (baseline) and new (course
timing and ordering) features. . . 73 8.1 Dataset statistics. . . 88 8.2 Prediction performance of the proposed representation learning based
approaches for grade-aware course recommendation. . . 93 8.3 Prediction performance of combining CKRM with the representation
learning based approaches for grade-aware course recommendation meth-ods. . . 94 8.4 Prediction performance of the representation learning based vs competing
approaches for grade-aware course recommendation. . . 96 8.5 Prediction performance of the representation learning based approaches
for grade-aware and grade-unaware course recommendation. . . 96 8.6 Average pairwise degree similarity between different pairs of GPA-based
student groups. . . 98 8.7 Statistics for the grades of all and recommended courses. . . 100
List of Figures
5.1 Predicted versus Actual Letter Grade Distribution using CKRMdep . . 33 5.2 Predicted Letter Grade Distribution Per Actual Letter Grade using
CK-RMdep . . . 34 6.1 Toy example showing the provided knowledge component vectors for two
Computer Science courses. . . 41 7.1 Distribution of graduation GPA vs time to degree across 25 different
majors (see Section 7.2.1). . . 57 7.2 Course timing metrics among different groups of full-time students. TTD
is shorthand for time-to-degree. Low and high time-to-degree is one that is≤9 and≥11 terms, respectively, both with GPA≥3.0. High and low GPA is one that is≥ 3.2 and≤ 2.8, respectively, both with TTD ≤10 terms. The line inside the box denotes the median value. The ends of the whiskers denote the lowest datum still within 1.5 IQR (interquartile range) of the lower quartile, and the highest datum still within 1.5 IQR of the upper quartile, while the red squares denote outliers that are outside these ranges. . . 66
7.3 Degree similarity metrics among different groups of full-time students. TTD is shorthand for time-to-degree. Low and high time-to-degree is one that is≤9 and≥11 terms, respectively, both with GPA≥3.0. High and low GPA is one that is≥3.2 and≤2.8, respectively, both with TTD ≤10 terms. The line inside the box denotes the median value. The ends of the whiskers denote the lowest datum still within 1.5 IQR (interquartile range) of the lower quartile, and the highest datum still within 1.5 IQR of the upper quartile, while the red squares denote outliers that are outside these ranges. . . 67 8.1 Grade difference from the student’s average previous grade. . . 80 8.2 Neural network architecture for Course2vec. . . 83 8.3 Performance of the different SVD-based methods with and without CKRM
(refer to Sec. 8.3.3 for the metrics definitions). . . 95 8.4 Per-major recommendation accuracy and the characteristics of the
stu-dents’ degrees. . . 102 8.5 Recommendation accuracy of SVD(+-) on different student sub-groups. 103 8.6 Popularity of the actual good courses, as well as courses recommended
by grp-pop(+-) and CKRM+SVD(+-). . . 103
Chapter 1
Introduction
The average six-year graduation rate across four-year higher-education institutions has been around 59% over the past 15 years [1, 2], while less than half of college graduates finish within four years [2]. These statistics pose challenges in terms of workforce de-velopment, economic activity and national productivity. This has resulted in a critical need for analyzing the available data about past students in order to provide actionable insights to improve college student graduation and retention rates.
Learning analytics (LA) is an emerging research field that spans the areas of data mining, machine learning, statistics, and education in order to analyze educational-related data and help understand the dynamics of such data. The goal of LA is to improve teaching and learning by generating patterns to characterize learner’s habits, predicting his/her responses and providing timely feedback, which is done by developing statistical and machine learning methods that learn from the historical raw data [3].
This thesis focuses on LA in higher education institutions to help undergraduate stu-dents and their advisors during the process of course selection and sequencing. Towards these goals, this thesis addresses the problems of grade prediction and course recommen-dation. First, we develop linear regression models that can predict the grades for future courses. Second, we develop context-aware non-linear and neural attentive models that improve upon the linear regression grade prediction models that we developed in the past. Third, we analyze the degree plans taken by students and study how their course timing and ordering relate to their GPAs and time to degree. Fourth, we propose a grade-aware course recommendation framework that recommends to students courses
2 that will help them towards finishing their degree requirements in a timely fashion and maintaining or improving their overall GPAs.
1.1
Key Contributions
There are two main problems associated with course selection and sequencing in under-graduate education. The first is the grade prediction problem, which aims to predict the student’s grade in a course that he/she is interested in taking. The second is the course recommendation problem, which aims to recommend to each student a set of courses that align with his/her degree requirements. In recent years, grade prediction and course recommendation problems have gained a lot of interest due to the increas-ing demand to analyze the available data about past students and help improve the students’ graduation and retention rates. Therefore, development of accurate grade prediction and course recommendation methods is highly desired. In addition, analy-sis of degree planning helps us in deriving deep insights about how course timing and ordering relate to the students’ GPAs and time to degree.
1.1.1 Cumulative Knowledge-based Regression Models (CKRM)
Many academic programs offer flexible degree plans, that include a small number of required core courses and a large number of elective courses. These electives allow students to customize their degree plans to better match their career goals. Existing methods suffer from their ability to perform well in such flexible degree programs.
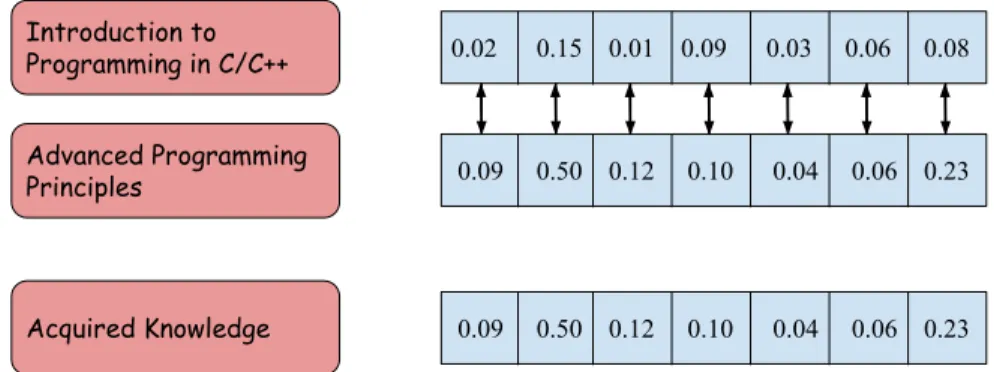
In this thesis (Chapter 5), we present a new set of Cumulative Knowledge-based Regression Models (CKRM), that mainly builds on the following idea. Each degree program requires a set of courses that need to be taken in some suggested sequence such that the knowledge provided by the earlier courses are essential for students to be able to perform well in more advanced courses. Towards this end, CKRM assumes that there is a space of knowledge components describing the overall curriculum. Within that space, each course is modeled via a knowledge component vector that contains the knowledge components that it provides. A knowledge component can be provided by a single or multiple courses. A student by taking a course acquires its knowledge components in a way that depends on the grade that he/she obtains in that course.
3 CKRM models the knowledge that a student has acquired after taking a set of courses via a knowledge state vector that is computed as the sum of the knowledge component vectors of these courses weighted by the grades that he/she has obtained in them. In order to predict the grade that a student will obtain on a specific course, CKRM estimates a per-course linear model that captures the knowledge components that are required in order to perform well in that course. Given the student’s knowledge state vector prior to taking a course and that course’s estimated linear model, the predicted grade is obtained as the dot-product of these two vectors.
There are two main contributions from the CKRM-based methods. First, it mod-els the way an academic degree program is designed in a natural way such that the knowledge offered from previously-taken courses collectively contribute to the student’s predicted grade in future courses. Second, it is able to identify the knowledge required from students to perform well in different courses, which can help in course sequenc-ing as well as assist students by providsequenc-ing them with information about the required knowledge for performing well in courses.
1.1.2 Context-aware Non-linear and Neural Attentive Knowledge-based Models
Though the CKRM method that we developed in Chapter 5 was shown to provide state-of-the-art grade prediction accuracy, it is limited in that it learns shallow linear models that may not be able to accurately capture the complex interactions among prior courses. In addition, it does not consider the effect of the concurrently-taken courses on a student’s performance in a target course.
In this thesis (Chapter 6), we propose context-aware non-linear and neural attentive knowledge-based models, which improve upon the CKRM models that we previously developed (Chapter 5) from two perspectives: (i) using non-linear and neural attentive models to better estimate the student’s knowledge state; and (ii) modeling the inter-actions between a target course and the other courses taken concurrently with it. For estimating the student’s knowledge state, we explore two different approaches. First, we develop a non-linear model, MAximum Knowledge-based model (MAK), where we hypothesize that each course provides knowledge at a certain knowledge level. MAK estimates a student’s knowledge state by employing a maximum-based pooling layer
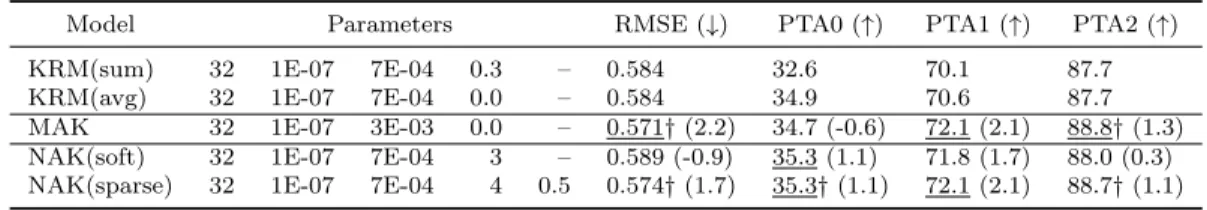
4 along each component of the prior courses’ embeddings. Second, we develop a Neu-ral Attentive Knowledge-based model, NAK, where we hypothesize that prior courses should have different contribution towards a target course. The attention weights are computed using two different activation functions. The first, called the softmax ac-tivation function, is the most commonly-used function, which converts a given input vector of real weights to a probability distribution. The second, called the sparsemax activation function, was recently proposed to truncate the smaller weighted values to zero, hence producing sparse attention weights. This is useful when the input contains some relevant and some irrelevant objects to the object of interest. For modeling the interactions between a target and concurrent courses, we hypothesize that the knowl-edge provided by concurrent courses modify the knowlknowl-edge required by a target course. We aggregate the concurrent course embeddings using non-linear and neural attentive models and then estimate a context-aware embedding for the target course.
A comprehensive set of results show that: (i) the proposed context-aware non-linear and neural attentive models outperform other baseline methods, including the previously-developed CKRM method, with statistically significant improvements; (ii) the context-aware non-linear model outperforms the context-aware neural attentive model and all baselines in making less severe under-predictions; (iii) estimating a stu-dent’s knowledge state via a non-linear or neural attentive model significantly outper-forms estimating it via a linear model; (iv) learning sparse attention weights for the neural attentive model outperforms learning soft weights; (v) modeling the interactions between a target course and concurrent courses significantly improve the performance of the non-linear model and gives similar performance for the neural attentive model; and (vi) the neural attentive model was able to uncover the listed and hidden pre-requisite courses for target courses.
1.1.3 Analysis of How Course Timing and Sequencing Relate to Stu-dents’ GPAs and Time to Degree
Student success in undergraduate education is mainly measured by his/her graduation GPA and time to degree. Several course recommendation methods have been developed to help students in selecting courses that align with their degree requirements. These methods use all the past students’ data to train their models, regardless of the students’
5 GPA or time to degree. Other studies have investigated the effect of many variables on the time to degree. These variables include: family background, prior academic achievement, working status (on- or off-campus), ... etc. None of these studies have studied the effect of degree planning, i.e., when a student takes his/her courses and how he/she sequences them, on the time to degree.
In this thesis (Chapter 7), we study the relationship between degree planning, in term of course timing and ordering, and each of the student’s GPA and time to degree. We define several metrics to measure course timing and similarity in course sequencing between pairs of students. We then measure these metrics for different GPA- and time-to-degree-based groups of students, and compare their values among these different groups.
Our analysis on a large-scale real-world dataset show that: (i) low time to degree students tend to take more courses ahead of time, and follow more similar sequencing for the common courses (especially in their later years), than high TTD students; and (ii) low GPA students tend to take more courses ahead of time, and follow more diverse sequencing for the common courses, than high GPA students.
In addition, we propose new course timing and ordering features to use in time to degree prediction. We train several binary classification models using the proposed course timing and ordering features and show that degree planning is a good indicator for TTD prediction.
1.1.4 Grade-aware Course Recommendation Approaches
Both course recommendation and grade prediction methods aim to help students during the process of course registration in each semester. By learning from historical registra-tion data, course recommendaregistra-tion focuses on recommending courses to students that will help them in completing their degrees. Grade prediction focuses on estimating the students’ expected grades in future courses. Based on what courses they previously took and how well they performed in them, the predicted grades give an estimation of how well students are prepared for future courses. Nearly all of the previous studies have focused on solving each problem separately, though both problems are inter-related in the sense that they both aim to help students graduate in a timely and successful manner.
6 In this thesis (Chapter 8), we propose a new grade-aware course recommendation framework that focuses on recommending a set of courses that will help students: (i) complete their degrees in a timely fashion, and (ii) maintain or improve their GPA. To this end, we propose two different approaches for recommendation. The first approach ranks the courses by using an objective function that differentiates between courses that are expected to increase or decrease a student’s GPA. The second approach uses the grades that students are expected to obtain in future courses to improve the ranking of the courses produced by course recommendation methods. The proposed framework combines the benefits of both course recommendation and grade prediction approaches to better help students graduate in a timely and successful manner.
To obtain course rankings in the first approach, we adapt two widely-known rep-resentation learning techniques, which have proven successful in many fields, to solve the grade-aware course recommendation problem. The first is based on Singular Value Decomposition (SVD), which is a linear model that learns a low-rank approximation of a given matrix. The second, which we refer to as Course2vec, uses a log-linear model to formulate the problem as a maximum likelihood estimation problem. In both ap-proaches, the courses taken by each student are treated as temporally-ordered sets of courses, and each approach is trained to learn these orderings.
A comprehensive set of results show that: (i) the proposed grade-aware course rec-ommendation approaches outperform grade-unaware course recrec-ommendation methods in recommending more courses that increase the students’ GPA and fewer courses that decrease it; and (ii) the proposed representation learning approaches outperform com-peting approaches for grade-aware course recommendation in terms of recommending courses which students are expected to perform well in, as well as differentiating be-tween courses which students are expected to perform well in and those which they are expected not to perform well in.
1.2
Outline
This thesis is organized as follows:
7 • Chapter 3 presents the background and existing methods related to the grade
prediction and course recommendation problems.
• Chapter 4 discusses the metrics used for evaluating the grade prediction methods, which are proposed in Chapter 5 and Chapter 6.
• Chapter 5 presents a new set of Cumulative Knowledge-based Regression Models (CKRM) for solving the grade prediction problem.
• Chapter 6 presents the proposed context-aware non-linear and neural attentive knowledge-based models for grade prediction.
• Chapter 7 presents a large-scale analysis on degree planning and how course timing and sequencing relate the students’ GPA and time to degree.
• Chapter 8 presents the proposed grade-aware course recommendation approaches to recommend to students courses that align with their degree requirements and that help them maintain or improve their GPAs.
• Chapter 9 summarizes the main contributions of this thesis and outlines some future research directions.
1.3
Related Publications
The work presented in this thesis and the related work has been published in leading conferences and journals in the fields of data mining and information retrieval. The related publications are listed as follows:
• Sara Morsy and George Karypis. Accounting for Language Changes over Time in Document Similarity Search. In ACM Transactions on Information Systems
(ACM TOIS), pages 1–26, 2016.
• Sara Morsy and George Karypis. Cumulative Knowledge-based Regression Models for Next-term Grade Prediction. In Proceedings of SIAM International Conference on Data Mining (SDM), 2017.
8 • Sara Morsy and George Karypis. A Study on Curriculum Planning and Its Relationship with Graduation GPA and Time To Degree. In Proceedings of the 9th International Conference on Learning Analytics and Knowledge (LAK), 2019.
• Sara Morsy and George Karypis. Will This Course Increase or Decrease Your GPA? Towards Grade-aware Course Recommendation. InJournal of Educational Data Mining (JEDM), 2019 (accepted for publication).
• Sara Morsy and George Karypis. Neural Attentive Knowledge-based Models for Grade Prediction. In Proceedings of the 12th International Conference on Educational Data Mining(EDM), 2019 (accepted for publication).
• Sara Morsy and George Karypis. Context-aware Non-linear and Neural Atten-tive Knowledge-based Models for Grade Prediction. under submission.
Chapter 2
Notations and Definitions
Boldface uppercase letters will be used to represent matrices (e.g., G,R) and boldface lowercase letters to represent row vectors, (e.g., r). The ith row of matrix R is repre-sented as ri. The entry in theith row and jth column of matrix G is denoted as gi,j.
A predicted value is denoted by having a hat over it (e.g., ˆg).
S and C are used to denote the sets of students and courses, respectively, whose respective cardinalities aremandn(i.e.,|S|=mand|C|=n). MatrixGwill represent the m×n student-course grades matrix, where gs,c denotes the grade that student
s obtained in course c. A student s enrolls in sets of courses in consecutive terms, numbered relative to s from 1 to the number of terms in he/she has enrolled in the dataset. A setTs,w will denote the set of courses taken by studentsin termw.
Chapter 3
Background and Related Work
With the alarming reported statistics on undergraduate graduation and retention rates, where around 59% of first-time, full-time undergraduate students at four-year institu-tions graduate within six years, and 19.5% drop out from these instituinstitu-tions [1], there has been a critical need to improve these graduation and retention rates. LA in higher education aims to analyze the historical raw data that is available about past students to understand the underlying factors for their success/failure in order to assist current and future students graduate in a timely and successful fashion.
Researchers have been applying different techniques to solve several related problems in LA. These problems include (but are not limited to): predicting the student’s perfor-mance and detecting his/her behavior [4, 5], identifying at-risk students [6, 7], analyzing the contents of discussion forums [8, 9], predicting the grades for course activities [10], knowledge tracing and student modeling [11–13], clustering similar students based on their learning preferences and interactions patterns [14, 15], and others.
In the following sections, we discuss some of the state-of-the-art grade prediction and course recommendation methods. In addition, we review other research areas that are relevant to our work in this thesis.
3.1
Grade Prediction
Regression Methods Polyzou et al. [4] proposed two regression-based methods: Course-Specific and Student-Specific Regression models (namely; CSR (or CSR) and
11 SSR, respectively). CSR is based on the fact that the student’s performance in a future course is based on his performance in the past courses. Consider a student s that has takenj courseshc1, . . . , cjiin that sequence, and a coursecthatshas not yet taken for
which we will like to predict his/her grade. In CSR, the grade for student s in course
c is predicted as a sparse linear combination of his previous grades, which is computed as ˆ gs,c=bc+rc Xj i=1 gs,cizci T ,
where bc is a course bias term, r and z are vectors of dimension equal to the total
number of courses n, rc is a linear model associated with course c, gs,ci is the grade that student s obtained on course ci, and zci is an indicator vector with one in the dimension corresponding to course ci. Since CSR treats each course as having a unique
dimension that does not share anything with any other course, it assumes that each course provides a set of knowledge components that are totally different from any other course, which does not hold for many courses. The capability of CSR to accurately model the accumulation of knowledge decreases as the flexibility of the degree program increases, i.e., as students can take more diverse courses that provide the same or similar knowledge components prior to taking the target course.
SSR [4] tries to overcome this limitation by estimating course-specific linear regres-sion models that are also specific to each student. These student-specific models are learned by only using similar students who have taken a sufficient number of common courses for the target student. However, as their results showed, the performance of SSR is highly dependent on the percentage of common courses between previous and target students (overlap ratio) and is thus limited to target students with a high overlap ratio.
Sweeneyet al. [5] used different regression-based methods, namely; Random Forest (RF), Stochastic Gradient Descent Regression, k-Nearest Neighbor (kNN) and Person-alized Multi-Linear Regression (PMLR), on a set of extracted features about students, courses and instructors. They found that both RF and PMLR perform well compared tokNN.
12
Matrix Factorization (MF) Methods Low rank Matrix Factorization meth-ods have been successful in predicting ratings in the context of recommender systems. Similar to the user-item rating matrix, grade prediction can be modeled via MF by con-structing a student-course grade matrix and learning low rank representations for both students and courses. This low rank representation can be thought of as representing the knowledge space for both students and courses. Thus, the grade that studentscan obtain on course c can be estimated as
ˆ
gs,c=µ+sbs+cbc+u vT, (3.1)
where µ,sbs and cbc are the global, student and course bias terms, respectively, andu
and v are the student and course latent vectors, respectively. The parameters of the MF model () are estimated by using the squared loss function with L2 regularization:
minimize µ,sb,cb,U,V 1 2 X s,c∈G (gs,c−gˆs,c)2+ α 2 ksbk22+kcbk22+kUk2F +kVk2F,
where: sb and cb are the student and course bias vectors, respectively, andU and V
are the student and course latent factor matrices, respectively.
Since the accurate recovery of the low rank model assumes that the observed entries are drawn randomly from the matrix, and since this assumption does not hold for the student-course grade data (since there is a clear structure for students and courses where students can select only a few subset of courses based on their majors and academic levels), Polyzou et al. [4] also proposed a course-specific matrix factorization (CSMF) method. CSMF estimates an MF model for each course by utilizing a course-specific subset of the whole student-course grade matrix. Specifically, for a target course cand a set of studentsSc for which we need to estimate their grade forc, it uses the students who took cand their grades prior to takingcas well as Sc(their grades prior to taking
c) to build the student-course grade matrix for MF. However, both MF and CSMF performed poorly when compared to CSR [4]. We believe this is due to the inaccurate estimation of the student latent representation, since students took a few number of courses, especially those who are still in their freshman or sophomore years.
13 on different granularity levels and incorporated them in MF methods. Examples of this grouping are: academic level and major for students, and course level and subject for courses. These groups were used to estimate different bias terms for different MF models for the corresponding student and course groups, where in each model, the student and course group bias terms were estimated by replacing the individual student and course bias terms by them in Eq. 3.1. The different MF models were then combined to estimate the final predicted grade.
3.2
Course Recommendation
Different machine learning methods have been recently developed for course recommen-dation. For example, [17] used association rule mining to discover significant rules that associate academic courses from previous students’ data. [18] ranked the courses for each student based on the course’s importance within his/her major, its satisified prerequisites, and the extent by which the course adds to the student’s knowledge state. Another set of recommendation methods proposed in [19–22] focused on satisfying the degree plan’s requirements that include various complex constraints. The problem was shown to be NP-hard and different heuristic approaches were proposed in order to solve the problem.
Elbadrawy et al. [16] proposed using both student- and course-based academic features, in order to improve the performance of three popular recommendation methods in the education domain, namely: popularity-based ranking, user-based collaborative filtering and matrix factorization. These features are used to define finer groups of students and courses and were shown to improve the recommendation performance of the three aforementioned methods than using coarser groups of students.
The group popularity ranking method proposed in [16] and referred to asgrp-pop, ranks the courses based on how frequently they were taken by students of the same major and academic level as the target student. Though this is a simple ranking method, it was shown to be among the best performing methods proposed by the authors. This is due to the domain restrictions, where each degree program offers a specific set of required and elective courses for the students to choose a subset from, and a pre-requisite structure exists among most of these courses.
14 Pardoset al. [23] proposed a course2vec model that used a skip-gram neural network architecture. Their model takes as input one course, and outputs multiple probability distributions over the courses.
Backenkohler et al. [24] proposed to combine grade prediction with course recom-mendation. They used a course dependency graph constructed using the Mann-Whitney U-test as the course recommendation method. This graph consists of nodes that repre-sent courses and directed edges between them. A directed edge going from course A to course B means that the chance of getting a better grade in B is higher when A is taken before B than when A is not taken before B. One limitation of this approach is that, for pairs (A, B) of courses that do not have sufficient data about A not being taken before B, no directed edge will exist from A to B, despite the fact that there may be sufficient data about A followed by B, which may imply that A is a pre-requisite for B.
3.3
Representation Learning
Representation learning has been an invaluable approach in machine learning and ar-tificial intelligence for learning from different types of data such as text and graphs. Objects can be represented in a vector space via local or distributed representations. Under local (or one-hot) representations, each object is represented by a binary vector, of size equal to the total number of objects, where only one of the values in the vector is one and all the others are set to zero. Under distributed representations, each object is represented by a dense or sparse vector, which can come from hand-engineered features that is usually sparse and high-dimensional, or a learned representation, called “embed-dings” in a latent space that preserves the relationships between the objects, which is usually low-dimensional and more practical than the former.
A widely used approach for learning object embeddings is Singular Value Decompo-sition (SVD) [25]. SVD is a traditional low-rank approximation method that has been used in many fields. In recommendation systems, a user-item rating matrix is typically decomposed into the user and item latent factors that uncover the observed ratings in the matrix, e.g., [26–29].
Recently, neural networks have gained a lot of interest for learning object embeddings in different fields, for their ability to handle more complex relationships than SVD. Some
15 of the early well-known architectures include Word2vec [30] and Glove [31], which were proposed for learning distributed representations for words [30]. For instance, neural language models for words, phrases and documents in Natural Language Processing, e.g., [30–34] are now widely used for different tasks, such as machine translation and sentiment analysis. Similarly, learning embeddings for graphs, such as: DeepWalk [35], LINE [36] and node2vec [37] were shown to have performed well on different applications, such as: multi-label classification and link prediction. Moreover, learning embeddings for products in e-commerce and music playlists in cloud-based music services have been recently proposed for next basket recommendation [38–40].
3.3.1 Neural Attentive Models
Neural networks have been used extensively in many fields, including, but not limited to: Natural Language Processing [41, 42] and recommender systems [43–46]. The attention mechanism has been recently introduced to neural network modeling and was shown to improve the performance of different models. Instead of aggregating the input object embeddings via a summation or mean pooling function, which assumes equal contri-bution of all objects, the idea is to allow the selected objects to contribute differently when compressing them to a single representation. Neural attentive networks have been successfully applied in many recommendation system techniques, such as factorization machines [43, 44], item-based collaborative filtering [46], and user-based collaborative filtering [47].
Part of our work in Chapter 6 relies on the attention mechanism, and leverages several advances in this area. The most commonly-used activation function for the attention mechanism is the softmax function, which is easily differentiable and gives soft posterior probabilities that normalize to 1. A major disadvantage of the softmax function is that it assumes that each object contributes to the compressed representa-tion, which may not always hold in some domains. To solve this, we need to output sparse posterior probabilities and assign zero to the irrelevant objects. Martins et al.
[48] proposed the sparsemax activation function, which has the benefit of assigning zero probabilities to some output variables that may not be relevant for making a decision. This is done by defining a threshold, below which small probability values are trun-cated to zero. We also leverage the controllable sparsemax activation function recently
16 proposed by Laha et al. [49] that controls the desired degree of sparsity in the output probabilities. This is done by adding an L2 regularization term that is to be maximized in the loss function. This will potentially encourage larger probability values for some objects, moving the rest to zero.
Chapter 4
Evaluation Metrics for Grade
Prediction
The grading system used by the University of Minnesota uses a 12 letter grade system (i.e., A, A-, B+, . . . F). We will refer to the difference between two successive letter grades (e.g., B+ vs B) as a tick. We converted the predicted grades into their closest letter grades. We assessed the performance of the different approaches based on the Root Mean Squared Error (RMSE) as well as how many ticks away the predicted grade is from the actual grade, which is referred to as “Percentage of Tick Accuracy”, or PTA. We computed the percentage of grades predicted with no error (zero tick), within one tick, and within two ticks, which will be referred to as PTA0, PTA1, and PTA2, respectively.
In general, the grades that are predicted with at most one or two ticks error are sufficiently accurate for the task of course selection whereas the grades that are predicted with an error of three or more ticks can incorrectly influence course selection.
Chapter 5
CKRM: Cumulative
Knowledge-based Regression
Models for Grade Prediction
5.1
Introduction and Motivation
A natural way to model the problem of grade prediction is to model the way the academic degree programs are structured. Each degree program requires a set of courses that need to be taken in some suggested sequence such that the knowledge provided by the earlier courses are essential for students to be able to perform well in more advanced courses. As we explained in Sec. 3.1, Polyzou et al. [4] proposed a Course-Specific Regression Model (CSR) which builds on this idea. However, CSR’s underlying model cannot correctly capture the students’ state of knowledge when the same knowledge can be acquired by taking different subsets of courses. As a result, its prediction performance deteriorates for programs with flexible degree plans.
In this chapter, we develop Cumulative Knowledge-based Regression Models (CKRM) that also builds on the idea of accumulating knowledge but addresses the aforementioned limitation of CSR. CKRM assumes that there is a space of knowledge components de-scribing the overall curriculum. Within that space, each course is modeled via a knowl-edge component vector that contains the knowledge components that it provides. A
19 knowledge component can be provided by a single or multiple courses. A student by taking a course acquires its knowledge components in a way that depends on the grade that he/she obtains in that course. CKRM models the knowledge that a student has acquired after taking a set of courses via a knowledge state vector that is computed as the sum of the knowledge component vectors of these courses weighted by the grades that he/she has obtained in them. In order to predict the grade that a student will obtain on a specific course, CKRM estimates a per-course linear model that captures the knowledge components that are required in order to perform well in that course. Given the student’s knowledge state vector prior to taking a course and that course’s estimated linear model, the predicted grade is obtained as the dot-product of these two vectors.
We investigated three different ways of constructing the knowledge component space. Two of them construct the knowledge space in terms of an automatically identified latent space and the third uses the free text descriptions of the courses to extract keywords that form the space’s dimensions. The difference between the two latent spaces is that one imposes the constraint that courses from different departments do not share any knowledge components, whereas the other one does not.
In the following sections, we present the summary of our results in Sec. 5.2. Then, we explain our methods in Sec. 5.3, describe the experimental setup and evaluation methodology in Section Sec. 5.4, discuss the results in Sec. 5.5 and summarize the Chapter in Sec. 5.6.
5.2
Main Contributions
Our contributions in this chapter are three-fold.
1. We propose a cumulative knowledge-based method for the problem of next-term grade prediction that better models the structure of degree programs and is better suited for flexible degree programs.
2. We performed an extensive experimental evaluation on a real world dataset con-taining 14 years worth of student grades from 12 academic departments from the College of Science and Engineering at University of Minnesota. This evaluation
20 showed that the proposed methods perform statistically significantly better than competing approaches.
3. We showed that the models that were estimated based on the extracted keywords can identify the knowledge that is required in order to perform well in a course, which is not captured by the course pre-requisites. This can be used to inform changes in course sequencing and degree programs.
5.3
Proposed Models
Consider a studentsthat has takenj courseshc1, . . . , cjiin that sequence, and a course
c that s has not yet taken for which we will like to predict his/her grade. A course c
is assumed to provide a set of knowledge components that the student acquires after taking c. These knowledge components can be the set of topics or concepts taught by the course. We assume that all courses can be represented in a knowledge space of these different components. We will refer to the knowledge component vector of a course c as its provided knowledge component vector and we will denote it as pc. We define the knowledge state for student safter takingj courses as the knowledge he/she has acquired so far in the different knowledge components provided by the j courses. A student’s sknowledge state after taking j courses will be denoted by theknowledge state vector ks,j and will be computed as
ks,j = j X i=1 ξ(s, cj, ci) gs,ci pci , (5.1)
where gs,ci is the grade that student s obtained on courseci, andξ(s, cj, ci) is a time-based exponential decaying function designed to de-emphasize courses that were taken a long time ago. Equation 5.1 models a student’s knowledge state as the sum of the provided knowledge component vectors of the courses he/she has taken so far, weighted by his/her grades in them. The grade-based weighting is designed to capture the fact that a student better acquires the knowledge components of a course on which he/she obtained a good grade than a course on which he/she did not.
21 The decaying function that we used is:
ξ(s, cj, ci) =e−λ(ts,cj−ts,ci), (5.2)
whereλis a user-specified non-negative parameter that controls the shape of the expo-nential decaying function, and ts,ci is the term number when student s took course ci. This term number is encoded as follows. For each student, we encode his/her first term as the term numbered as 1, and each following term number is incremented by 1. This technique applies a time-based decaying weight on the prior courses, and is designed to model the fact that students tend to forget the knowledge components that they have acquired in courses that were taken a long time ago.
CKRM computes the grade that students will obtain on a course c by applying a course-specific linear model rc on the student’s knowledge state vector prior to taking
c. That is, the predicted grade is given by
ˆ
gs,c =bc+rc kTs,j, (5.3)
where bc is a course bias term and ks,j is the student’s knowledge state vector. These
course-specific linear models are estimated from the historical grade data and can be considered as capturing and weighting the knowledge components that a student needs to have accumulated in order to perform well in a course. For this reason, we will refer to these linear models as the required knowledge component vectors.
5.3.1 The Course Knowledge Component Space
In order to capture the knowledge components provided by courses, we investigated three different ways of defining the structure of the knowledge component space. Two of them are based on a latent space, and the third one is based on the textual descriptions of these courses.
Latent Knowledge Component Space
The most straightforward way to define the latent knowledge component space is to use the standard latent structure in which all dimensions, i.e., knowledge components,
22 are shared across all courses. We will refer to the CKRM-based method that uses the standard latent structure as CKRMall. For academic courses that belong to different departments, however, they should not share their provided knowledge components among each other. For instance, a course that belongs to Mechanical Engineering in general should not share any of its provided knowledge components with a course from Computer Science & Engineering.
In order to model this, we experiment with a “prescribed” latent structure, which is based on the assumption that courses belonging to the same department provide the same set of knowledge components and that courses belonging to different departments do not share any of their provided knowledge components with each other. In this case, we allocate a distinct set of l latent dimensions for each department. For example, if
l= 5, and we are working with 10 departments, then the number of dimensions for that approach will be 5×10 = 50 dimensions. We will refer to the CKRM-based method that uses this prescribed latent structure asCKRMdep.
Within that prescribed structure, for each provided knowledge component vector (pc) we need to estimate only lvalues, whereas for each required knowledge component vector (rc), we can potentially be estimating all dimensions.
Textual-based Knowledge Component Space
A source that offers information about the knowledge components provided by courses is their textual descriptions in the University course catalog. These are usually short descriptions of what different knowledge components are provided by the courses in a form of free-text sentences and/or keywords. We hypothesize that it may be possible to derive a knowledge component space using these descriptions.
In order to test this hypothesis, we use the set of 2-ngrams that appear in the textual descriptions of the courses as the knowledge component space and represent each course as a bag-of-ngrams vector. With this representation, we can use the vectors in the knowledge component space as indicator vectors and just estimate the required knowledge component space, or we can estimate the non-zero entries of the provided knowledge component space along with estimating the required knowledge component space. In the latter case, the weights on the provided knowledge component vectors can be viewed as indicating some type of relative importance of the different dimensions
23 (i.e., ngrams) in that course. We will refer to the CKRM-based method that uses the textual descriptions of courses as CKRMtext.
5.3.2 Parameter Estimation
The parameters of the CKRM-based methods are the required knowledge component vectors associated with each course, i.e., the variousrcvectors, and the provided
knowl-edge component vectors of each course, i.e., the pc vectors (the latter vectors are esti-mated for all the approaches except when using them as indicator vectors in CKRMtext). We use the squared error loss function to estimate these parameters. For the ap-proaches that estimate the provided knowledge component vectors, the optimization problem is minimize b,R,P 1 2 P s,c∈G(gs,c−ˆgs,c) 2 +α2 kRk2F +kPk2F +kbk22 subject to b≥0,R≥0, P≥0, (5.4)
wheregs,cis the actual grade, ˆgs,cis the predicted grade (computed as in Eq. 5.3),b∈Rn
is the vector of course biases, R ∈ Rn×d is the matrix whose rows are the required
knowledge component vectors, P ∈ Rn×d is the matrix whose rows are the provided
knowledge component vectors, andα is a regularization parameter to avoid overfitting. The non-negativity constraints onRandPare enforced since they represent knowledge acquisition, which should be non-negative. Note that for CKRMdep and CKRMtext,
Phas a predefined sparse structure, so only the weights of its encoded non-zero entries are estimated. For CKRMtext that uses the provided knowledge component vectors as indicator vectors, the optimization problem is
minimize b,R 1 2 P s,c∈G(gs,c−gˆs,c)2+α2 kRk2F +kbk22 subject to b≥0,R≥0. (5.5)
The optimization problems of Eqs. 5.4 and 5.5 are solved using a Stochastic Gradient Descent (SGD) algorithm, which is an iterative algorithm. Algorithm 1 provides the detailed procedure and gradient update rules. Matrices R and P are initialized with small random values as the initial estimate (line 6). In each iteration of SGD (lines 7– 27), if the course has at least l courses taken prior to it, then its required knowledge
24 component vector rcis updated as well as the preceding j courses’ provided knowledge
component vectors pci. This process is repeated until the RMSE on the validation set does not decrease further or the number of iterations has reached a predefined threshold. Note that, for solving Eq. 5.5, lines 20–23 are ignored and the non-zero entries of Pare just used as indicator vectors.
Algorithm 1 CKRM:Learn
1: procedure CKRM Learn
2: l←minimum # prior courses
3: η← learning rate
4: α← regularization weight
5: iter←0
6: Initb and the non-zero entries ofRandPwith random values in [-0.001, 0.001]
7: whileiter < maxIter or RMSE on validation set decreasesdo 8: for all gs,c ∈G do
9: j← # courses taken bysprior toc
10: if j≥lthen
11: cj ←last course taken by sprior toc
12: ks,j ←0
13: for all ci∈gs s.t. ci was taken by sprior toc do
14: ks,j←ks,j+ξ(s, cj, ci)gs,ci·pci 15: end for 16: gˆs,c←rc kTs,j 17: es,c←gs,c−ˆgs,c 18: bc←bc+η (es,c−α bc) 19: rc←rc+η·(es,c·ks,j−α·rc) 20:
21: for all ci∈gs s.t. ci was taken by sprior toc do
22: pci ←pci+η·(es,c ξ(s, cj, ci) gs,ci·rc−α·pci) 23: end for 24: end if 25: end for 26: iter←iter+ 1 27: end while 28: return b,R andP 29: end procedure
25
5.4
Experimental Evaluation
5.4.1 Dataset Preprocessing
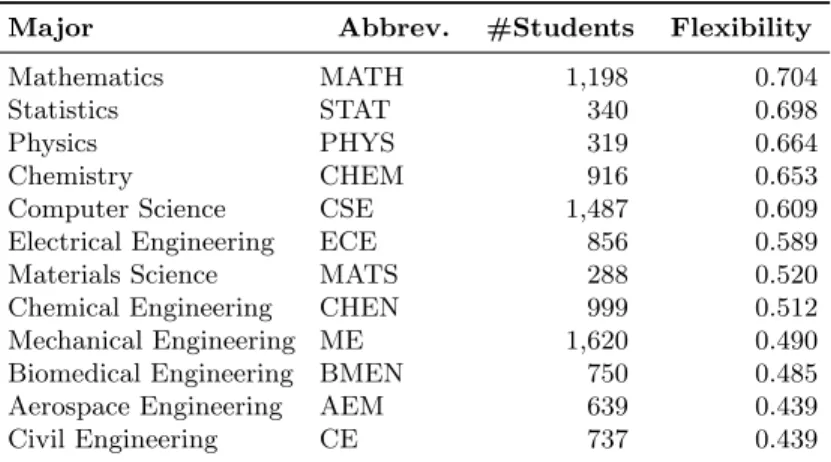
The data used in our experiments was obtained from the College of Science and Engi-neering at University of Minnesota and includes 12 degree programs. The data that we used span a period of about 14 years (Fall 2002 to Spring 2015). From that dataset, we extracted the students who were registered at the University for at least three terms1. For each of these students, we extracted the set of courses that belong to these 12 ma-jors. We removed any courses that were taken as pass/fail. The initial grades were in the A–F scale, which were converted to the 4–0 scale using the standard letter grade to GPA conversion. The statistics of the extracted majors are shown in Table 5.1.
Table 5.1: Information about the Different Majors
Major Abbrev. #Students Flexibility
Mathematics MATH 1,198 0.704
Statistics STAT 340 0.698
Physics PHYS 319 0.664
Chemistry CHEM 916 0.653
Computer Science CSE 1,487 0.609
Electrical Engineering ECE 856 0.589
Materials Science MATS 288 0.520
Chemical Engineering CHEN 999 0.512
Mechanical Engineering ME 1,620 0.490 Biomedical Engineering BMEN 750 0.485
Aerospace Engineering AEM 639 0.439
Civil Engineering CE 737 0.439
The majors are sorted with respect to their flexibility in a decreasing order (see Section Sec. 5.4.1 for the definition of the major’s flexibility).
Table 5.1 also shows each major’sflexibility, which is a measure that we computed in order to differentiate between degree programs that that have a large number of electives and the students’ degree programs tend to include different sets of courses (flexible) over those that offer a few electives and the degree programs of all students are quite similar (restricted). As our results will show, the major’s flexibility impacts the performance of certain models. We computed the major’s flexibility as the average
1
26 course offering flexibility over all course offerings that belong to that major, weighted by the number of pairs of students in that offering. We computed the flexibility of a course offering c as one minus the average Jaccard coefficient of the courses that were taken by the students that took c prior to taking this class. The flexibility will be low if the students that tookc have taken very similar courses beforec and high otherwise.
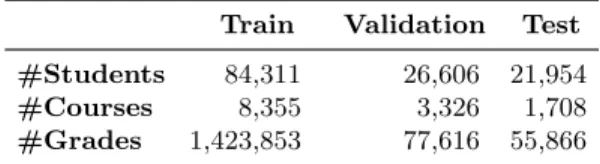
Table 5.2: Datasets Statistics
Train Validation Test #Students 84,311 26,606 21,954
#Courses 8,355 3,326 1,708
#Grades 1,423,853 77,616 55,866
These statistics are accumulated over the eight datasets created for the eight test terms (see Sec. 5.4.2).
A course that belongs to some department is usually taken by two sets of students: those who major in that department and those who major in another department. These two sets of students have different background since they belong to different majors. We thus created two instances for each course that is taken by these two sets of students, so as to treat each instance as a unique course.
For CKRMtext, we extracted the keywords from each course description after re-moving the stopwords and extracted the 2-ngrams that exist within a window of size 3. We then created a binary course-by-ngrams matrix, where each course was represented as a vector of its ngrams, that was used as the provided knowledge component matrix
P.
5.4.2 Generating Train, Validation, and Test Sets
The entire dataset was used to extract eight different subsets in order to assess the performance of the different methods. Specifically, we selected the eight most recent Fall and Spring terms in our dataset to predict their grades (which we will refer to as the set of test terms T), where for each of these test termst∈ T, only the terms prior to t are used for training and validation. The training, validation and test sets were extracted as follows. For each test term t, the term prior to it that is either a Fall or
27 a Spring term (not a Summer term) is used for validation and model selection, and all the terms prior to the validation term are used for learning the model. For a student to be considered in the training set, he/she must have taken at least three courses in the training set. This is to ensure that the students have taken a sufficient number of courses so that CKRM can capture knowledge accumulation. Also, we did not consider a course for predicting its grades in the validation or test set if its required knowledge component vector (rc) was estimated, during learning the model, less than 50 times, as
we considered such courses not to have reliable estimated required knowledge component vectors. Therefore, for a course to be considered for prediction during validation or testing, it must have been taken by at least 50 students after at least 3 courses. The statistics about the accumulated training, validation and test sets over the eight subsets of data are shown in Table 5.2.
Following the row-centering technique used by Polyzouet al. [4] that was shown to greatly improve the prediction performance of CSR, we centered each student’s grade that exists in the training set around his GPA that is computed using his/her grades in that set. This row centering takes a notion of student bias into account. Specifically, for each student, we computed his/her GPA using his/her grades that exist in the training set and then subtracted each of these grades from his/her GPA. Since these row-centered grades are not restrictively non-negative, we removed the constraint of non-negativity on R while estimating the parameters of the CKRM-based methods.
5.4.3 Baseline/Competing Methods
In our experiments, we compared the performance of the CKRM-based methods against the following competing methods:
1. CSR: This is the course specific regression model that was described in Sec. 3.1.
2. Matrix Factorization (MF):This approach predicts the grade for studentsin a course c following Eq. 3.1.
3. BiasOnly: This method is a special case of MF, in which the number of latent dimensions is 0. That is, it predicts the grade for student sin a specific coursec
28 The optimization problems for both MF and BiasOnly methods were solved using an SGD algorithm, which is terminated after 1000 iterations or when the RMSE value on the validation set converges.
5.4.4 Evaluation Methodology and Performance Metrics
We evaluated the performance of the different approaches by using them to predict the grades for each of the eight test terms in our dataset using the data from the terms prior to each test term for training and validation (see Table 5.2).
We evaluated the statistical significance of the results obtained by the different meth-ods using a paired-sample one-tailed t-test. Specifically, we used the ticks percentages of the courses belonging to each major in each of the eight datasets as the data points for each method.
5.4.5 Model Selection
We did an extensive search in the parameter space for model selection. We experimented with the regularization parameterαin the range [1e-5, 0.1] and with the learning rateη
in the range [5e-5,1]. For CKRMall and CKRMdep, we used the number of dimensions in the range [10, 50] with a step of 10, whereas for MF we used it in the range [10, 60] with a step of 5. For the CKRM-based methods, we experimented with the parameter
λin the range [0, 1] with a step of 0.1.
The training set was used for estimating the models, whereas the validation set was used to select the best performing parameters in terms of the overall RMSE of the validation set.
5.5
Results
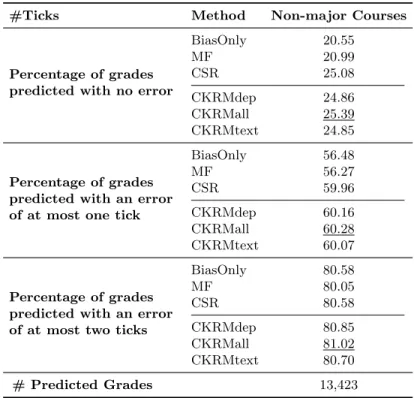
For each of the 12 departments, we divided the results into the set of courses that belong to the student’s major (major courses) and the set of courses that do not belong to his/her major (non-major courses), since these two groups of courses represent different populations.
We organized the experimental results into four parts. The first and second show a quantitative comparison of the CKRM-based methods against each other as well as
29 against the competing methods on major and non-major courses, respectively. The third one discusses the actual versus predicted letter grade distributions. Finally, the third shows a qualitative analysis on CKRMtext.
5.5.1 Quantitative Performance on Major Courses
Table 5.3 shows the performance achieved by the CKRM-based and competing methods on major in terms of the percentage of grades predicted with no error, with an error of at most one tick, and with an error of at most two ticks.
Comparing the performance achieved by the three CKRM-based methods, we can see that their performance is quite similar. If we consider the best performing entries across the different departments and error levels we see that one of them outperforms the other two. However, even when a method does better than another one, the differences are fairly small. The close performance of the three methods was also confirmed by the statistical significance tests that we ran, which showed that the performance difference of the three schemes were not statistically significant for most departments.
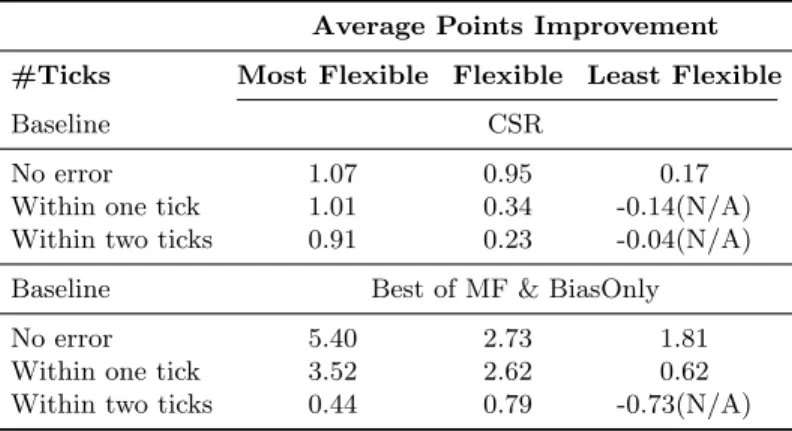
Comparing the performance achieved by the CKRM-based methods against that achieved by CSR, we see that the former leads to more accurate predictions and its performance advantage is greater for the flexible majors than the restricted ones. This is further illustrated in Table 5.4, which shows the average points improvements of the CKRM-based methods based on the majors’ flexibility. The CKRM-based methods achieve an average improvement of 1.07, 1.01, and 0.91 points over CSR in the four most flexible majors, as opposed to 0.17, -0.14, and -0.04 points in the four least flexible ones for the no error, within one tick, and within two ticks errors, respectively. These improvements also indicate that the CKRM-based methods do considerably better than CSR in terms of the no error predictions. These results confirm our hypothesis that CSRM’s performance degrades as the major’s flexibility increases, since this method depends on the prior set of courses to predict the grades, which can fail in such flexible majors as each student can take a different combination of courses that offer the same knowledge components required for performing well in that course.
Comparing the performance achieved by the CKRM-based methods against that achieved by MF and BiasOnly, we see that they also outperform both MF and BiasOnly in most cases and that their performance is statistically significant over both baselines
30
Table 5.3: Prediction Performance of the Different Methods on Major Courses
#Ticks Method MATH STAT PHYS CHEM CSE ECE
Percentage of grades predicted with no error
BiasOnly 16.24 22.66 24.14 20.57 23.08 23.53 MF 16.55 21.14 24.71 20.34 23.36 22.66 CSR 20.24 27.81 31.90 21.85 25.51 23.76 CKRMdep 19.05 28.95 34.19 23.43 25.84 24.77 CKRMall 18.65 28.19 30.75 22.90 25.70 24.73 CKRMtext 19.52 28.19 32.18 22.15 25.31 23.90 Percentage of grades predicted with an error of at most one tick
BiasOnly 48.