Informatics - Telecommunication - Electronics
Website Jurnal : http://ejournal.st3telkom.ac.id/index.php/infotelISSN : 2085-3688; e-ISSN : 2460-0997
Enhancement of K-Parameter Using Hybrid Stratified
Sampling and Genetic Algorithm
Rima Dias Ramadhani
1*, Agus Priyanto
2, Muhammad Fajar Sidiq
31,2,3Program Studi Teknik Informatika, Institut Teknologi Telkom Purwokerto 1,2,3Jl. DI. Panjaitan 128, Purwokerto, Indonesia
Corresponding email : [email protected]
Received 19 December 2017, Revised 30 December 2017, Accepted 26 January 2018
Abstract — Clustering is a technique used to classify data into clusters based on their similarities. K-means is a clustering algorithm method that classifies the objects based on their closest distance to the cluster center to the groups that have most similarities among the members. In addition, K-means is also the most widely used clustering algorithm due to its ease of implementation. However, the process of selecting the centroid on K-means still randomly. This results K-K-means is often trapped in local minimum conditions. Genetic algorithm is used in this research as a metaheuristic method where the algorithm can support K-means in reaching global optimum function. Besides, the stratified sampling is also used in this research, where the sampling functions by dividing the population into homogeneous areas using stratification variables. The validation value of the proposed method with iris dataset is 0.417, while the K-means is only 0.662.
Keywords – K-means, Stratified Sampling, Genetic Algorithm, DBI, cluster
All rights reserved.
I. INTRODUCTION
Clustering techniques are used to group the data into several subgroups that are relatively homogeneous. Moreover, the similarity of data in subgroups is maximized and the similarity between clusters is minimized [1]. Clustering process also finds some problems, such as measuring similarities between clusters and defining groups based on data. Clustering techniques introduced since 1955 according to Anil K. Jain's research [2]. There are several techniques for clustering i.e. K-means, Fuzzy c-Means (FCM), and Self-Organizing Maps (SOM) [3].
Fuzzy c-Means (FCM) algorithm is used to organized each data point into several groups based on the values in fuzzy condition [4]. According to Wang et. al [5] Self-Organizing Maps (SOM) is a neural network algorithm where the weight of its input nodes and output neurons connect with each other and better for distinguishing abnormal data from host or network. Moreover, K-means is an algorithm that can classify multiple data sets into clusters based on the distance between the data and the cluster center [6]. However, according to the research conducted by Wu et.al [7] it is stated that K-means is listed and decided as the most influential among the 10 mining data algorithms
In addition, in Anil K. Jain's research [2] it is mentioned that K-means has ease, simplicity, and time efficiency on its implementation. However, K-means has also weakness in initializing the centroid at the beginning of the process. It is also supported in the study of Celebi et. al [8] where a random initialization of the centroid process will cause K-means to be trapped in a minimum local point conditions. The local minimum is a situation where the right centroid is found only when the initial partition approaches the final solution. Thus, it will cause the cluster results to be inappropriate [9]. Thus, it can be concluded K-means has a weakness on its sensitivity of centroid placement done randomly so that it often becomes convergent into the local minimum conditions. [6] [8] [10].
In studies on K-means, it has been found some combination methods to determine the centroid on K-means that can generate the clusters with higher level of validation. One of them is by using genetic algorithm method, which is a random search algorithm and optimization technique that has the principle of evolution [11]-[13]. In their research genetic algorithms can be used in complex and multidimensional spaces which can provide the right
solution for fitness function. The research conducted by Breaban and Luchian [14] introduced a new criterion in clustering technique to determine the most optimal number of clusters and provide a ranking of partitions on the features that are different from the genetic algorithm which uses MNC-GA method. The results obtained on the digit dataset are 0.9347 by generating 3 clusters and the letters of 0.7704 by generating 2 clusters using Rand Index.
Besides, the sampling method is also used in this research, i.e. the stratified sample which is a stratification variable that can divide a population into homogeneous area [15]. The sampling stratified performed smaller error than other sampling methods for the size.
Our study approaches optimization method and stratified sampling for enhancement the validation for K-means. In this regard, a new method is introduced in Section 2. Section 3 presents a result for performing unsupervised clustering and summarizes the experimental results. Section 4 discusses the hybrid and it compares of the clustering method with optimization method using genetic algorithm and stratified sampling. Section 5 draws conclusions and points to the future work.
II. RESEARCH METHOD
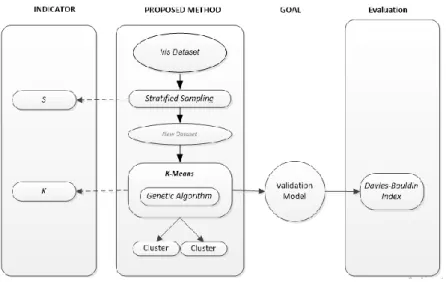
This section will be explained about the step of the method where the general overview the process can be seen in Fig.1. Before we explore the process, the first step that we need is to prepare the data to be processed.
This study uses a public dataset of Iris that can be
accessed at
https://archive.ics.uci.edu/ml/datasets.html. The Iris dataset is the best known database found in pattern recognition literature made based on a research of R. A Fisher, and the Iris dataset is still frequently referred until today.
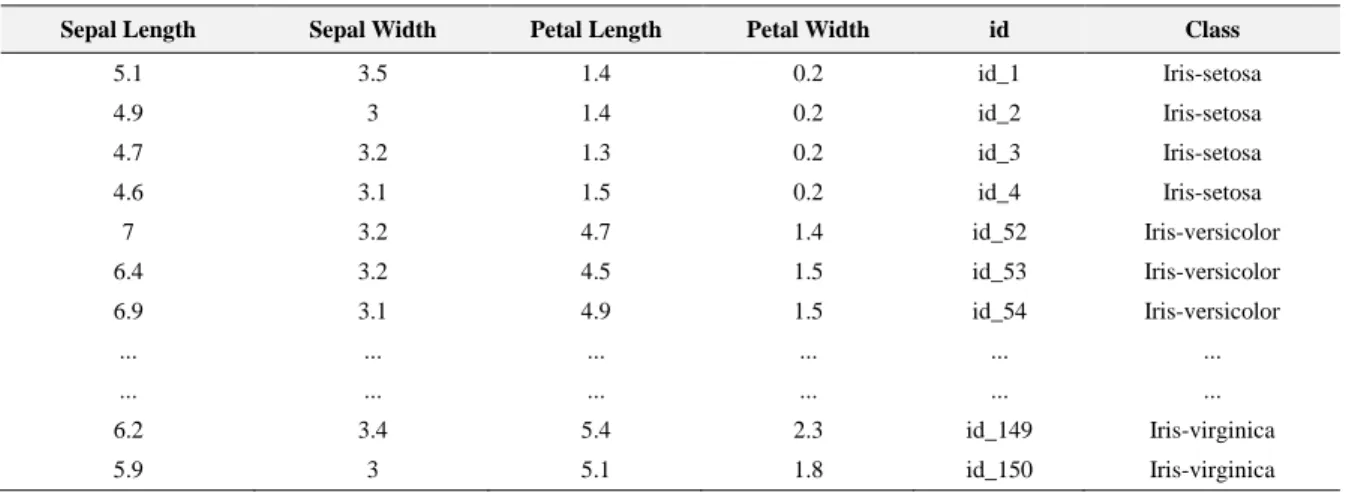
Table 1 shows the Iris dataset of 150 records, having 4 numerical attributes of sepal length, sepal width, petal length, and petal width and containing 3 classes of Iris Sentosa, Iris Versicolour and Iris Virginica.
The Iris dataset will be re-processed using Sample Stratified for divide a population into homogeneous area and integrated Genetic Algorithm (GA) as an optimization method for help K-means that often becomes convergent into the local minimum conditions using fitness function and get a better validation rate.
A. Proposed Method
In this section will explain the process after getting a new dataset from Iris. The first step before K-means is processed by Genetic Algorithm, the Iris dataset is selected to hold the sampling process using Stratified Sampling
The N-population is divided into sub-populations which each of them comprises 𝑁1, 𝑁2, 𝑁3, ..., 𝑁𝐿
elements. Among the two sub-populations, there should be no overlap, so that 𝑁1 + 𝑁2 + 𝑁3 + ⋯ +
𝑁𝐿 = 𝑁. Then, each remaining object is grouped with the most similar representative object. Then, replace one medoid with another that has better quality and done iteratively.
Next step we execute the K-means process that classifies objects based on distance to the cluster center to groups that share their similarity [2]. K-means is to determine the number of partitions / clusters of the dataset to be established. At Iris dataset, the object in the dataset will cluster for three (3) classes. Based on the three classes that have been formed, we have selected the objects from each randomly to place the initial cluster center / centroid using GA for five populations.
In this paper, one population consists of 5 chromosomes and each gene amounted to 24 `taken from several centroids in each class randomly. Table 2 shows 1 population containing 3 centroid of each attribute.
Table 2. Population of Each Chromosome
Furthermore, each chromosome was evaluated by using Davies-Bouldin Index (DBI) on K-means and by using euclidean distance.DBI [16] is based on the similarity of cluster size based on cluster dispersion and cluster size inequalities as shown in (1).
(1)
where is the centroid of cluster i and centroid of cluster j. The distance calculation of
can use euclidean. Next step is to define for cluster.
The approach above is used to maximize inter-cluster distance and minimize intra-inter-cluster distance. The distance measurement used in this study for specifies the object based on the closest distance to the centroid used Euclidean distance shown in equation 2.
(2)
where and
is an attribute from 2 records.
The next process computes the fitness function of each chromosome validation result based on the DBI equation as can be seen in equation 3. If the fitness function finds the closest criterion 1 then the clustering process will stop, but if fitness function or accuracy does not reach the criteria, so genetic algorithm will continue for the next process. It means, the optimization of K-parameter will stop when the fitness function is close to 1 as shown in equation 1.
(3)
At selection, a good parent candidate gets. A good parent will get a good offspring. The higher fitness value of a chromosome can be selected. The selection method used is the roulette wheel. Steps selection using roulette wheel are follows,
a) Calculate probability value. Calculates probability value of the fitness value by dividing total fitness value by fitness value b) Calculate the cumulative
c) Specify value randomly. Determine randomly a range [1-20] and select the parent that will be the candidate toolbar and then select “1 Column” from the selection palette.
d) Compare between random values and cumulative values
Chromosome K Att 1 Att2 Att 3 Att 4
1 1 5.1 3.4 1.5 0.2 2 6 2.2 4 1 3 7.2 3.6 6.1 2.5 2 1 5.2 3.5 1.5 0.2 2 6.5 2.8 4.6 1.5 3 7.1 3 5.9 2.1 1 5 3.4 1.5 0.2 3 2 6 2.2 4 1 3 7.2 3.6 6.1 2.5 1 5 3.4 1.5 0.2 4 2 6 2.2 4 1 3 7.2 3.6 6.1 2.5 1 5 3.4 1.5 0.2 5 2 6.2 2.9 4.3 1.3 3 5.9 3 6.1 2.5
Table 1. Dataset Iris
Sepal Length Sepal Width Petal Length Petal Width id Class
5.1 3.5 1.4 0.2 id_1 Iris-setosa 4.9 3 1.4 0.2 id_2 Iris-setosa 4.7 3.2 1.3 0.2 id_3 Iris-setosa 4.6 3.1 1.5 0.2 id_4 Iris-setosa 7 3.2 4.7 1.4 id_52 Iris-versicolor 6.4 3.2 4.5 1.5 id_53 Iris-versicolor 6.9 3.1 4.9 1.5 id_54 Iris-versicolor ... ... ... ... ... ... ... ... ... ... ... ... 6.2 3.4 5.4 2.3 id_149 Iris-virginica 5.9 3 5.1 1.8 id_150 Iris-virginica
The selection process is finished to get a new chromosome value and next for crossover process. Crossover process is following below,
a) Determine the probability of crossover . This process is performed to exchange genes based on crossover probabilities with crossover probabilities = 0.5.
b) Select a value based on crossover probability c) Gene exchange This is performed to increase
the population diversity of each chromosome. This is one of the crossover processes on chromosome 1 and chromosome 4 shown in Fig.2. Chromosome 1
><
Chromosome 4 Chromosome 1 5.1 3.4 1.5 0.2 6 2.2 4 1 7.2 3.6 6.1 2.5><
Chromosome 4 6 2.2 4 1 7.2 3.6 6.1 2.5 5 3.4 1.5 0.2 Fig.2. Chromosome crossoverd) The purpose of the crossover process is a product the child (offspring) and adds to the diversity of individuals within a population. It shown in Fig.3.
Chromosome 1>< Chromosome 1
5.1 3.4 4 1 6 2.2 6.1 2.5 7.2 3.6 1.5 0.2
Fig.3. Chromosome Offspring
After the mutation process has been completed, the new population established from the crossover. After that, mutation was worked to increase the diversity of each chromosome. To determine the position of a mutated gene is mature by using a number for determining the number of genes to be mutated with a random value. The gene value in this position is replaced by the addition of 0-1.
After the genetic algorithm process is complete, and then the next step is recalculate the value of chromosome evaluation based on DBI to get the best fitness value. If the fitness value is not close to 1, it is looped again from computing chromosome evaluation to fulfill the criterion function that is fitness value close to 1.
Now, the centroid that has been selected will be calculated process using K-means based on determine
the cluster, ie as much as three (3). Then, in looking for average distance in clusters and between clusters, and to calculate Euclidean distance, recalculating the centroid of each cluster formed to update the new centroid. Repeat the previous step until no data moves from one cluster to another cluster.
After all, recalculating the Davies Bouldin index validation based on K-means with Stratified Sampling and genetic algorithm integration of method has shown. The next chapter will discuss the results of that method.
III. RESULT
In this section explains the results of Stratified Sampling (SS) integration with Genetic Algorithm (GA) using Iris dataset for optimized the K parameter. The experiment in this research used Rapidminer 7.6.1.
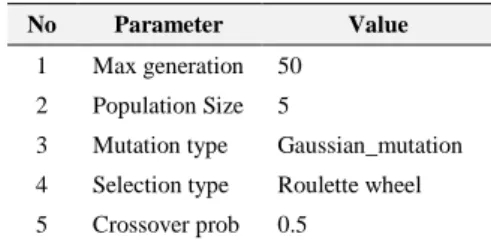
The absolute number value 100 added in this study. The result then processed using K-means by considering the value of the optimized K parameter. There are three classes specified in this study. The optimal K value in this study uses the optimization function of GA with the parameter settings seen in Table 3.
Table 3. GA Parameter Setting
No Parameter Value
1 Max generation 50 2 Population Size 5
3 Mutation type Gaussian_mutation 4 Selection type Roulette wheel 5 Crossover prob 0.5
Based on the processing result using Iris dataset that has 3 classes of Iris Sentosa, Iris Versicolour and Iris Virginica. The optimal result of SS and GA integration method is shown in Fig.4, where the validation value is 0.417. The result is different from the result of K-means and SS integration which validation value of 0.536, while the value of K-means validation is 0.662. Thus it can be concluded that the integration of such methods can enhance the validation of K-means.
IV. DISCUSSION
The integration method using GA can perform better validation value compared to K-means. The experiment results has been proven that the validation value of the proposed method with iris dataset is 0.417, while the K-means is only 0.662. The SS method, in this case, works in grouping the data into the closest distance, so that the resulting data is similar with each other. It is due SS has a divisible property which is able to divide the population into the homogenous area of the stratification variables and they can performed for smaller error. This method can provide a solution of the clustering algorithm instability to determine the optimal number of classes. Then, the new dataset that has been performed then will be calculated using Davis Bouldien Index (DBI).
The result of validation value is close to 0, its means the best cluster is closest. This is in accordance with the theory of DBI [16] where DBI runs by maximizing inter-cluster distance and minimizing intra-cluster distance. The validation value is then processed using fitness function in GA, where the value close to 1 is the maximum one.
Meanwhile, the validation value in this study is fit with previous studies which stated GA as metaheuristic algorithm which has the function to reach the global optimal condition can help K-means not to trapped in local minimum conditions to achieve optimum value [13], [14].
In this study using roullete wheel for mutation type because the individuals are mapped in a line segment regularly so that each individual segment has the same size as its fitness size. A random number will be generated and individuals who have segments within the random number area will be selected. This process is repeated until a certain number of individuals are expected.
Crossovers that used in this study using a single point by crossing the chromosome with 0.5 crossover probability. Crossover process performed on each individual with a crossover probability (Pc) with the aim of producing offspring and increasing the diversity of individuals in a population.
Gaussian mutation was used in this study, where mutations were randomly assigned to probability values and substituted with the selected random values. The selection of the best parameters above can be able to provide the optimal partition space guidance for K-Means using the optimization method. Three important aspects for the use of genetic algorithms are defining fitness functions, genetic representation, and implementation of genetic operators. Given the strengthening of the two proposed methods, it can help K-means to avoid being in the local minimum and can improve the quality of validation.
V. CONCLUSION
The experiment results it has been proven that the validation value of the proposed method is better than K-means. The use of Stratified Sampling with Genetic Algorithm has been proven to generate better validation value on K-means. It means the quality of the clusters formed is also getting better. Therefore, future studies should be able to reset the value of SS by using the ratio value.
It proves that the application of GA and SS can improve the performance of K-Means in choosing the centroid appropriately. That’s based on those sampling functions by dividing the population into homogeneous areas using stratification variables. Then GA is for reach global optimum function for K-Means. If the selection of centroid is right then it will form a good class.
Meanwhile, in genetic algorithm method the next research should be able to set each value on the parameter so that the validation value will sustainably improve. In addition, for further research can also use other datasets for larger clustering so it is supposed to compare the evaluation results between small and large datasets
REFERENCES
[1] D. T. Larose, Discovering knowledge in data. 2005. [2] A. K. Jain, “Data clustering: 50 years beyond
K-means,” Pattern Recognit. Lett., vol. 31, no. 8, pp. 651–666, Jun. 2010.
[3] J. Wu, Advances in K-means Clustering. A Data Mining Thinking. 2012.
[4] T. Le and T. Altman, “A new initialization method for
the Fuzzy C-Means Algorithm using Fuzzy
Subtractive Clustering,” in Proc. International
Conference on Information and Knowledge
Engineering, 2011, vol. Vol. 1, pp. 144–150.
[5] W. Huai-bin, Y. Hong-liang, X. Zhi-jian, and Y. Zheng, “A clustering algorithm use SOM and k-means in intrusion detection,” 2010 Int. Conf. E-bus. E-Government, no. 2007, pp. 1281–1284, May 2010. [6] M. E. Celebi, H. A. Kingravi, and P. A. Vela, “A
comparative study of efficient initialization methods for the k-means clustering algorithm,” Expert Syst. Appl., vol. 40, no. 1, pp. 200–210, 2013.
[7] X. Wu et al., “Top 10 algorithms in data mining,” Knowl. Inf. Syst., vol. 14, no. 1, pp. 1–37, 2008. [8] M. E. Celebi and H. A. Kingravi, “Order-Invariant
Initialization Methods for the K-Means Clustering Algorithm.”
[9] J. Han and M. Kamber, “Data mining: concepts and techniques,” vol. 49, no. 6, pp. 49-3305-49–3305, Feb. 2012.
[10] P. Camus, F. J. Mendez, R. Medina, and A. S. Cofiño, “Analysis of clustering and selection algorithms for the study of multivariate wave climate,” Coast. Eng., vol. 58, no. 6, pp. 453–462, 2011.
[11] J. H. Holland, “Genetic algorithm,” Sci. Am., no. July, 1992.
[12] M. Melanie, “An introduction to genetic algorithms,” Cambridge, Massachusetts London, England, Fifth Print. 3, 1999.
[13] M. A. Rahman and M. Z. Islam, “A hybrid clustering technique combining a novel genetic algorithm with K-Means,” Knowledge-Based Syst., vol. 71, pp. 345– 365, Nov. 2014.
[14] M. Breaban and H. Luchian, “A unifying criterion for unsupervised clustering and feature selection,”
Pattern Recognit., vol. 44, no. 4, pp. 854–865, 2011. [15] P. Yang, R. Science, and M. N. M. R. Divisiont,
“Partition Testing , Cluster Stratified Analysis * Sampling , and,” 1993.
[16] D. L. Davies and D. W. Bouldin, “A cluster separation measure.,” IEEE Trans. Pattern Anal. Mach. Intell., vol. 1, no. 2, pp. 224–227, 1979.