Statistics Preprints Statistics
1-29-2018
Sampling techniques for big data analysis in finite
population inference
Jae Kwang Kim
Iowa State University, [email protected]
Zhonglei Wang
Iowa State University, [email protected]
Follow this and additional works at:https://lib.dr.iastate.edu/stat_las_preprints
Part of theDesign of Experiments and Sample Surveys Commons,Probability Commons, and theStatistical Methodology Commons
This Article is brought to you for free and open access by the Statistics at Iowa State University Digital Repository. It has been accepted for inclusion in Statistics Preprints by an authorized administrator of Iowa State University Digital Repository. For more information, please contact
Recommended Citation
Kim, Jae Kwang and Wang, Zhonglei, "Sampling techniques for big data analysis in finite population inference" (2018).Statistics Preprints. 136.
Sampling techniques for big data analysis in finite population inference
Abstract
In analyzing big data for finite population inference, it is critical to adjust for the selection bias in the big data. In this paper, we propose two methods of reducing the selection bias associated with the big data sample. The first method uses a version of inverse sampling by incorporating auxiliary infor- mation from external sources, and the second one borrows the idea of data integration by combining the big data sample with an
independent proba- bility sample. Two simulation studies show that the proposed methods are unbiased and have better coverage rates than their alternatives. In addition, the proposed methods are easy to implement in practice.
Keywords
Data integration, inverse sampling, non-probability sample, selection bias
Disciplines
Design of Experiments and Sample Surveys | Probability | Statistical Methodology
Comments
This is a manuscript that has been accepted for publication inInternational Statistical Review:
arXiv:1801.09728v1 [stat.ME] 29 Jan 2018
Sampling techniques for big data analysis in finite
population inference
Jae Kwang Kim and Zhonglei Wang
Department of Statistics, Iowa State University, Ames, Iowa 50011, U.S.A.
E-mails: [email protected] and [email protected]
Summary
In analyzing big data for finite population inference, it is critical to adjust for the selection bias in the big data. In this paper, we propose two methods of reducing the selection bias associated with the big data sample. The first method uses a version of inverse sampling by incorporating auxiliary infor-mation from external sources, and the second one borrows the idea of data integration by combining the big data sample with an independent proba-bility sample. Two simulation studies show that the proposed methods are unbiased and have better coverage rates than their alternatives. In addition, the proposed methods are easy to implement in practice.
Key words: Data integration; inverse sampling; non-probability sample; selection bias.
1
Introduction
Probability sampling is a scientific tool for obtaining a representative sample from a tar-get finite population. Formally, a probability sample has the property that every element in the finite population has a known and nonzero probability of being selected. Proba-bility sampling can be used to construct valid statistical inferences for finite population parameters. Survey sampling is an area of statistics that deals with constructing effi-cient probability sampling designs and corresponding estimators. Classical approaches in survey sampling are discussed in Cochran (1977), S¨arndalet al.(1992) and Fuller (2009).
Despite the merits of probability samples, Baker et al. (2013) argue that it becomes common to get non-probability samples, which may not represent the target population properly. Besides, collecting a strict probability sample is almost impossible in certain areas due to unavoidable issues such as frame undercoverage and nonresponse. The in-creasing prevalence of non-probability samples, such as web panels, makes methods for non-probability samples even more important. Keiding and Louis (2016) address the chal-lenges in using non-probability samples for making inferences. Elliott and Valliant (2017) review the weighting methods for reducing the selection bias in non-probability samples. Rivers (2007) proposes nearest neighbor imputation matching for combining information from survey data and big data. Bethlehem (2016) discusses sample matching methods for handling non-probability samples.
Big data is one example of such non-probability sample. The Four Vs (volume, ve-locity, variety and veracity) of big data and its implication to statistical inference are nicely discussed in Franke et al. (2016). While use of big data for predictive analysis is a hot area of research (Efron and Hastie, 2016), its use for finite population inference is not well investigated in the literature. Tam (2015) discusses a statistical framework for analyzing big data for official statistics, particularly in agricultural statistics. Rao and Molina (2015) discuss using the area-level summary of big data as one of the covariates in the linking model for small area estimation. Tam and Kim (2018) cover some ethical challenges of big data for official statisticians and discuss some preliminary methods of correcting for selection bias in big data.
One of the benefits of using big data is, as pointed out by Tam and Clarke (2015), in the cost effectiveness in the production of official statistics. However, there are still great challenges when using big data for finite population inference. The most critical issue is how to handle selection bias in the big data sample (Meng, 2018). Adjusting for the selection bias in big data is an important practical problem in survey sampling.
In this paper, we discuss how some of the sampling techniques can be applied in harnessing big data for finite population inference. By treating the selection bias in the big data sample as a missing data problem, we propose two approach of handling big data
in survey sampling. The first approach is based on inverse sampling, which is a special case of two-phase sampling, and a novel inverse sampling method is proposed to obtain a representative sample from the big data. The second approach is based on the weighting method using the auxiliary information obtained from another independent probability sample. Combining information from two data sources, often called data integration, is also a hot area of research in survey sampling. In the proposed method, an independent probability sample is used to estimate the parameters of the propensity score model for the big data sample.
The paper is organized as follows. In Section 2, the basic setup is introduced and the selection bias of big data is discussed. In Section 3, an inverse sampling method is proposed. In Section 4, a propensity score weighting approach using data integration is discussed. Results from two limited simulation studies are presented in Section 5. Some concluding remarks are made in Section 6.
2
Basic Setup
Consider a finite population {yi : i ∈ U}, where yi is the i-th observation of the study variable Y, and U = {1, . . . , N} is the corresponding index set with known size N. A big data sample {yi : i ∈ B} is available with B ⊂ U. Specifically, δi = 1 if i ∈ B and δi = 0 otherwise, and assume that yi is observed only when δi = 1. We are interested in estimating the population mean ¯YN =N−1PNi=1yi.
From the big data sample B, we can estimate ¯YN by ¯YB = NB−1PN
i=1δiyi, where NB =PNi=1δi is the known size of B. Given {δi :i∈U}, the error of ¯YB can be written as ¯ YB−YN¯ = 1 fBCov(δ, Y) wherefB =NB/N and Cov(δ, Y) = 1 N N X i=1 (δi −δN¯ )(yi−YN¯ )
with ¯δN =N−1PN
i=1δi. Thus, we have
Eδ{( ¯YB−YN¯ )2}= 1 f2 B
Eδ
Cov(δ, Y)2 , (1)
whereEδ(·) denotes the expectation with respect to the random mechanism for δi. If the random mechanism for δi is based on Bernoulli sampling, where the inclusion indicators follow a Bernoulli distribution with success probability fB independently, we can obtain
Eδ
Cov(δ, Y)2 = [Eδ{Cov(δ, Y)}]2+ Varδ{Cov(δ, Y)}
= 0 + 1 N2 N X i=1 (yi−YN¯ )2fB(1−fB) = 1 NfB(1−fB)σ 2 with σ2 =N−1PN
i=1(yi−Y¯N)2. Thus, under Bernoulli sampling, (1) reduces to Eδ{( ¯YB−YN¯ )2}= 1
NB
(1−fB)σ2,
which is consistent with the classical theory for Bernoulli sampling with sample size n=NB. For general cases, (1) can be expressed as
Eδ{( ¯YB−YN¯ )2} = 1 f2 B Eδ Corr(δ, Y)2Var(δ)Var(Y) = Eδ Corr(δ, Y)2 × 1 fB −1 ×σ2, (2)
where the second equality follows from
Var(δ) = 1 N N X i=1 (δi−δN¯ )2 =fB(1−fB).
Equality (2) is also presented in Meng (2018). Although there are three terms in (2) determining the selection bias of ¯YB, the first term,Eδ{Corr(δ, Y)2}, is the most critical one. Meng (2018) calls the termData Defect Index (DDI), which determines the level of departure from simple random sampling. Under equal probability sampling designs such thatEδ(δi) =fB, we haveEδ{Corr(δ, Y)}= 0 and DDI is of orderO(1/N), which implies Eδ{( ¯YB−YN¯ )2} = O(N−1
B ). For other sampling designs with Eδ{Corr(δ, Y)} 6= 0, the DDI becomes significant with orderO(1), which impliesEδ{( ¯YB−YN¯ )2}=O(N−1
Therefore, a non-probability sampling design withEδ{Corr(δ, Y)} 6= 0 makes the analysis results subject to selection bias.
In this paper, we show how to use some of the existing sampling techniques to reduce the selection bias of the big data sample and make the resulting analysis valid. We consider two techniques, one is inverse sampling and the other is survey data integration.
3
Inverse sampling
When the distribution of the study variable for the big data sample differs systematically from that for the target population, the big data sample does not necessarily represent the target population. An important question in this respect is whether we can use auxiliary variables, external to the big data sample, to correct for the selection bias. In this section, we cosider a novel inverse sampling approach to address this problem. The proposed inverse sampling can be viewed as a special case of two-phase sampling (e.g., Breidt and Fuller, 1993; Rao and Sitter, 1995; Hidiroglou, 2001; Kim, et al. 2006; Stukel and Kott, 1996). The first-phase sample is the big data sample, which is subject to selection bias. The second-phase sample is a subsample of the first-phase sample to correct the selection bias of the big data sample. Inverse sampling is originally proposed as a way of obtaining a simple random sample from a sample obtained from a complex sampling design. For some classical designs, such as stratified sampling, the inverse sampling algorithm is presented by Hinkins et al. (1997) and Rao et al. (2003). Till´e (2016) applies the inverse sampling concept to a quota sample. We address the application of inverse sampling to big data subject to selection bias.
Unlike the classical two-phase sampling, the first-phase sample in our setup is the big data itself, and we have no control over it. Thus, we first use some external source to determine the level of selection bias in the big data. This step can be called weighting step, as the importance weights are computed for each element in the big data sample. The second step is to select the second phase sample from the big data with the selection probability proportional to the importance weights.
To correct for selection bias using the proposed inverse sampling approach, we need external information about the target population, either from a census or from a proba-bility sample, for some auxiliary variablex. To formally present the idea, let (xi, yi) be available in the big data sample (B) andf(x) be the density for the marginal distribution of x that is obtained from an external source. We assume that the auxiliary variable x
has a finite second moment. We are interested in estimating θ=E(Y) from the big data sampleB. The first-order inclusion probability for the big data sampleB is unknown.
Using the idea of importance sampling (Goffinet and Wallach, 1996; Henmi et al. 2007), it can be shown that
ˆ θB1 = P i∈B f(xi) f(xi|δi=1) f(yi|xi) f(yi|xi,δi=1)yi P i∈B f(xi) f(xi|δi=1) f(yi|xi) f(yi|xi,δi=1) , (3)
is asymptotically unbiased for θ = E(Y) by assuming that f(δi = 1 | xi) >0 for i ∈ U almost surely. If the sampling mechanism for B is ignorable after controlling on x, i.e. P(δi = 1|xi, yi) =P(δi = 1|xi),then (3) reduces to
ˆ θB1 = P i∈B f(xi) f(xi|δi=1)yi P i∈B f(xi) f(xi|δi=1) :=X i∈B wi1yi. (4)
The weight wi1 can be called importance weight, following the idea of importance sam-pling. If xi is a vector of stratum indicator variables, thenf(xi)/f(xi |δi = 1) equals to (Nh/N)/(nh/n) for i in stratum h, which leads to unbiased estimation under stratified sampling.
If only ¯XN = N−1PNi=1xi is available, we can approximate f(x) by f0(x), which minimizes the Kullback-Leibler distance
minf0∈P0 Z f0(x) ln f0(x) f(x|δ= 1) dx, (5) whereP0 ={f(x); R xf(x)dx= ¯XN}. The solution to (5) is f0(x) = f(x|δ= 1) exp (xT λ) E{exp (XT λ)|δ= 1}, (6) whereλ satisfies R
xf0(x) dx= ¯XN, and DT is the transpose of D. Thus, the selection probability for the second-phase selection is proportional to exp (xT
to the exponential tilting calibration discussed in Kim (2010). Using (6), the weighted estimator in (4) reduces to ˆ θB1 = P i∈Bexp(x T iλˆ)yi P i∈Bexp(x T iλˆ) , (7) where ˆλ satisfies P i∈Bexp(x T iλˆ)xi P i∈Bexp(x T iλˆ) = ¯XN. (8)
Here, equation (8) can be called calibration equation (Wu and Sitter, 2001). Unlike the usual calibration estimation, we may ignore the sampling variability in estimatingλsince NB is large. When the sample size ofB is large, the computation for calibration equation (8) may be challenging. In this case, one-step approximation (Kim, 2010) can be used.
Based on (7), we discuss how to select the second phase sample (B2) of size n from the big data sample B such that ˆθB2 = n−1Pi∈B2yi is approximately design unbiased
for ˆθB1 in (4). The basic idea is to choose the conditional first-order inclusion probability πi2|1 =P(i∈B2 |i∈B) such that
πi2|1 =nwi1, i∈B , (9)
wherewi1 is the importance weight in (4). To guarantee
πi2|1 ∈(0,1], i∈B , (10)
we should choose n ≤ 1/maxi∈B{wi1}. Once {πi2|1 : i ∈ B} satisfying (9) and (10) are found, we can apply any unequal probability sampling techniques to obtain the second-phase sample; see Till´e (2006) for details on algorithms for unequal probability sampling designs.
Once the second-phase sample B2 is obtained, we can use the sample mean of yi in B2 to estimate θ. The variance estimator of ˆθB2 can be decomposed as
Var(ˆθB2) = Var(ˆθB1) + Var(ˆθB2−θBˆ 1),
where the first term is of order O(NB−1), and the second term is of order O(n−1). If n/NB = o(1), the first term can be safely ignored, and we only need to estimate the
second term. Since we can express ˆ θB2 = X i∈B2 1 πi2|1 (wi1yi),
we can apply the standard variance estimation formula for the Horvitz–Thompson esti-mator (Horvitz and Thompson, 1952) by treating the big data as the finite population. That is, we can use
ˆ V = X i∈B2 X j∈B2 πij2|1−πi2|1πj2|1 πij2|1 wi1yi πi2|1 wj1yj πj2|1
as a variance estimator for ˆθB2, where πij2|1 is the joint inclusion probability for the second-phase sampling.
4
Data integration
Survey data integration is an emerging area of research, which aims to combine informa-tion from two independent surveys from the same target populainforma-tion. Kim et al. (2016) propose a new method of survey data integration using fractional imputation of Kim (2011) under the instrumental variable assumption, and Park et al. (2017) use a mea-surement error model to combine information from two independent surveys.
Survey data integration idea can be used to combine big data with survey data. Here,
we assume that we have two data sources, one is a survey data (denoted by A) and
the other is a big data (denoted by B) which is subject to selection bias. We assume that item x is available from survey data while (x, y) is available from the big data, and n/NB =o(1), where n is the sample size of A. We are interested in estimating the population mean ¯YN by combing two data sources. Because of the selection bias, the sample mean ¯YB from the big data is biased. Table 1 presents the data structure for this setup.
If both samples were probability samples, then synthetic data imputation can be used to create imputed values ofyi in the sample A. Such synthetic data imputation, or mass imputation, is also considered by Legg and Fuller (2009) and Kim and Rao (2011). When
B is a non-probability sample, Rivers (2007) proposes a mass imputation approach using nearest neighbor imputation for survey integration. That is, we can use x to find the nearest neighbor in the big data sample B to create an imputed value of yi for each element in the sample A. Once the imputed values of yi are created for all the elements in the sampleA, we can compute an imputed estimator ofθ =E(Y) from the sample A. Such a method can be justified if
fB(y|x) = f(y|x), (11)
where fB(y | x) is the conditional density of y given x for the big data sample B, and f(y | x) is that for the target population. This assumption, which is called trans-portability, can be achieved if the selection mechanism for big data is non-informative (Pfeffermann, 1993). Because the sampleA is a probability sample, the imputation esti-mator ˆθA,I = N−1P
i∈Adiyi∗ is approximately unbiased under certain conditions, where y∗
i is the imputed value of uniti, and di is the associated sampling weight.
Instead of using mass imputation of Rivers (2007), we propose to use propensity score weighting for the big data based on auxiliary information in the sample A. To formally describe the idea, we first assume that we can observe δi, the big data sample inclusion indicator, from the sampleA. That is, among the elements in the sample A, it is possible to obtain the membership information from the big data sample B. For example, if the big data sample B consists of people using a certain credit card, then we can obtain δi fromA by asking whether person i uses the credit card.
We assume that the selection mechanism of the big data sample is ignorable P(δi = 1 |xi, yi) = P(δi = 1|xi), i∈U ,
and it follows a parametric model
P(δi = 1|xi) =pi(λ)∈(0,1], i∈U , (12)
where pi(λ) =p(x
T
iλ) for some known function p(·) with second continuous derivatives with respect to an unknown parameterλ, andpi(λ)−1 =O(N). Since we observe (δi,xi)
from the sampleA, we can estimate λ by maximizing the pseudo log-likelihood function of λgiven by
l(λ) = X i∈A
di[δilog{pi(λ)}+ (1−δi) log{1−pi(λ)}].
Once the pseudo maximum likelihood estimator ˆλis obtained, then we can use a propen-sity score weighting estimator, that is,
ˆ θB,P S = P i∈Bpi(ˆλ)−1yi P i∈Bpi(ˆλ)−1 (13) as a weighted estimator ofθ from the big data sampleB.
To discuss variance estimation of ˆθB,P S, note that (ˆλ,θB,P S)ˆ ′ is a solution to the joint estimating equation, that is,
U(θ,λ)≡P
i∈Bpi(λ)−1(yi−θ) = 0, (14)
S(λ)≡P
i∈Adi{δi−pi(λ)}gi(λ) = 0, (15)
wheregi(λ) =∂logit{pi(λ)}/∂λ. Thus, by using the sandwich formula, we can obtain a consistent variance estimator of ˆθB,P S; see Appendix A for details.
Remark 1 If we can build a working outcome regression model for E(Y |x), say E(Y |
x) =xT
β, we can construct a doubly robust estimator (Kim and Haziza, 2014) given by
ˆ θB,DR = 1 N ( X i∈B 1 pi(ˆλ) yi−xT iβˆ +X i∈A dixT iβˆ ) , (16)
where βˆ is the estimated regression coefficient based on the big data sample. We assume
that an intercept term is included in x. Under the model assumption (11), βˆ can be
obtained by ordinary least squares. To show double robustness, letθA,HTˆ =N−1P
i∈Adiyi
be the Horvitz–Thompson estimator of θ from the sample A. Note that
ˆ θB,DR−θA,HTˆ = 1 N ( X i∈B 1 pi(ˆλ) ˆ ei−X i∈A dieiˆ ) , where eiˆ =yi−xT
iβˆ. Thus, if the model (12) is correctly specified, we have
Eδ(ˆθB,DR−θA,HTˆ ) ≈ 1 N X i∈U ei−X i∈A diei ! , (17)
where ei = yi − xT
iβ∗ and β∗ is the probability limit of βˆ. The right side of (17) is
design-unbiased to zero, so θB,DRˆ is asymptotically unbiased under model (12). On the
other hand, if E(Y |x) =xT
β is correctly specified, then, 1 NE ( X i∈B 1 pi(ˆλ) ˆ ei |B ) ≈ 1 N X i∈B 1 pi(λ∗)E(ˆei |B), 1 NE X i∈A dieiˆ | B ! = 1 N X i∈U E(ˆei |B) , where eiˆ =yi−xT
iβˆ and λ∗ is the probability limit of λˆ. Note that E(ˆei |B) = 0 under E(Y |x) =xT
β and MAR. Thus, we have
E(ˆθB,DR−θA,HTˆ )≈0, (18)
if the outcome regression model is correctly specified. Therefore, we have established double robustness of θB,DRˆ . Variance estimation of θB,DRˆ is discussed in Appendix B.
5
Simulation Study
5.1
Inverse sampling
In this simulation study, we consider the proposed inverse sampling under a simple setup. A finite population is generated by
yi = 5 + 3xi+ei, i= 1, . . . , N , wherexi ∼Exp(1),ei ∼N(0, x2
i),N = 1,000,000,N(µ, σ2) is a normal distribution with mean µ and variance σ2, and Exp(λ) is an exponential distribution with mean λ. The inclusion indicator of the big data sample is generated by δi ∼Ber(pi) independently for i= 1, . . . , N, where logit(pi) =φ(xi−2), Ber(p) is a Bernoulli distribution with success probability p, and logit(x) = log(x)−log(1−x) for x ∈ (0,1). In addition, we assume that the population mean ¯XN is known. We consider two cases, φ=−0.2 and φ =−0.5, and we are interested in making inference for the population mean ¯YN and a proportion
PN = N−1PN
i=1I(yi < 6), where I(x < a) = 1 if x < a for a given number a, and 0 otherwise.
We compute the following three estimators withn= 500 andn = 1,000, respectively, and recall that n is the sample size for the second-phase sampling.
I. Naive estimator: We use simple random sampling to get a sample of size n from the big data sample B.
II. Calibration estimator: From the sample obtained by the naive method, we use the exponential tilting method described in Section 3 to obtain a calibration estimator using ¯XN information.
III. Proposed inverse sampling estimator: First, we obtain the important weights in (7) satisfying the calibration condition (8), and then a sample of size n is selected by probability-proportional-to-size sampling.
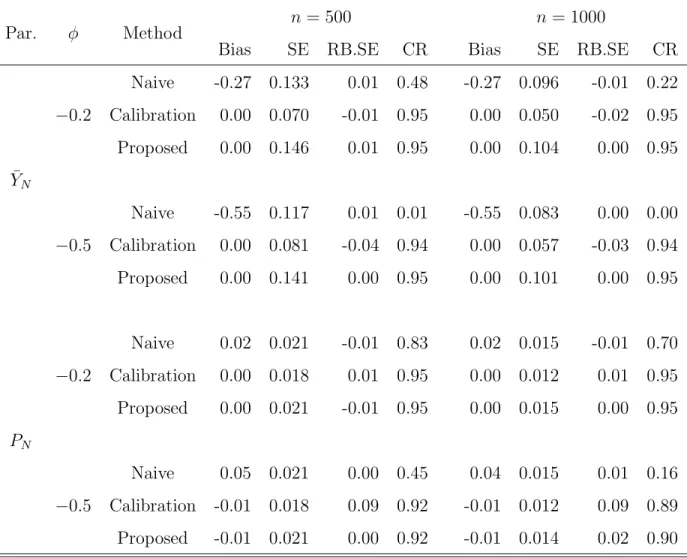
We conduct 10,000 Monte Carlo simulations and compare the three estimators with respect to the bias and standard error of the point estimator, the relative bias of the estimated standard error and the coverage rate of a 95% confidence interval obtained from the Wald-type method. Table 2 summarizes the simulation results. The naive estimator works poorly since it does not account for the selection bias of the big data sample. Specifically, its coverage rate decreases as the sample size gets larger, conforming the big data paradox of Meng (2018). Although the calibration estimator works better than the naive one by incorporating external information, its performance is still questionable since its variance estimator is biased when φ =−0.5, that is, when the mean of the big data sample, NB−1P
i∈Bxi, differs significantly from ¯XN. For estimating ¯YN, which is a linear function of ¯XN in our simulation, the biases of the calibration estimator and the proposed inverse sampling estimator are negligible compared with the standard errors, and the coverage rates of these two methods are close to 0.95 in spite of the small bias of the estimated variance of the calibration estimator. For estimating PN, which is not a linear function of ¯XN, the biases of the calibration estimator and the proposed inverse sampling estimator are approximately the same, but they are not negligible compared
with the standard error when φ = −0.5. Thus, the coverage rates of the calibration estimator and the proposed inverse sampling estimator are below 0.95. Besides, variance estimator of the proposed inverse sampling estimator is unbiased for all cases, but that of the calibration estimator becomes worse when φ=−0.5.
5.2
Data integration
We use a simulation setup similar to Kim and Haziza (2014) to compare the two proposed estimators shown in (13) and (16) with a naive estimator and Rivers’ method. We consider the following two outcome regression models for generating the finite population.
I. Linear model. That is,
yi = 1 +x1,i+x2,i+ǫi, i= 1, . . . , N , (19)
wherex1,i ∼N(1,1),x2,i ∼Exp(1), ǫi ∼N(0,1),N = 1,000,000, and (x1,i, x2,i, ǫi) is pair-wise independent.
II. Nonlinear model. That is,
yi= 0.5(x1,i−1.5)2+x2,i+ǫi, i= 1, . . . , N , (20)
where (x1,i, x2,i, ǫi) is the same with those in the linear model.
The sampling indicator of the big data sample is generated byδi ∼Ber(pi) independently fori= 1, . . . , N, and we consider the following two big data propensity models.
I. Linear logistic model. That is,
logit(pi) =x2,i, i= 1, . . . , N . (21)
II. Nonlinear logistic model. That is,
The average sampling rates for the big data are about 60% under both models.
We consider the following three scenarios to generate the finite population and the big data sample.
I. Both the outcome regression model and the big data propensity model are linear. That is, the finite population is generated by (19), and the sampling indicator of the big data sample is generated by (21).
II. The outcome regression model is linear, and a nonlinear logistic model is used for the big data propensity model. That is, we use (19) to generate the finite population, and use (22) to generate the sampling indicator of the big data sample.
III. The outcome regression model is nonlinear, and the big data propensity model is linear. That is, we use (20) and (21) to generate the finite population and big data sample.
The parameter of interest is the population mean ¯YN. We use simple random sampling to get an independent sample A of size n, and we consider n = 500 and n = 1,000. We compare the following methods for estimating ¯YN and the corresponding 95% confidence interval.
I. Naive estimator. We use sample mean and sample variance of the big data sample to make inference.
II. Rivers’ method. The nearest neighbor is obtained by the Euclidean norm based on (x1,i, x2,i).
III. The proposed propensity score (PS) weighting estimator (13) using a logistic model forp(·), that is, logit{pi(λ)}=λ0+λ1x2,i.
IV. The proposed doubly robust (DR) estimator in (16). The working outcome regres-sion model is E(yi | x1,i, x2,i) = β0 +β1x1,i +β2x2,i, and the working big data propensity model is the same as that in Method III.
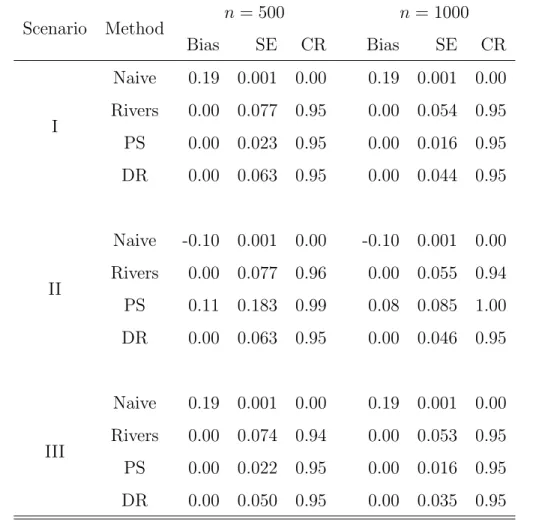
For each scenario, we conduct 2,000 Monte Carlo simulations to compare the data integration estimators regarding the bias and standard error of the point estimator and the coverage rate of the 95% confidence interval obtained by the Wald-type method. Table 3 summarizes the simulation results. The naive estimator is biased since it does not account for the random mechanism for the big data sample, and its coverage rate is zero for all scenarios. Rivers’ method works well in terms of the bias and coverage rate in all three scenarios. For Scenario I and Scenario III, the proposed PS estimator has the smallest standard error compared with others, and its bias and coverage rate is as good as those by Rivers’ method and the proposed DR estimator. However, the proposed PS estimator is sensitive to the mis-specification of the big data propensity model, and its estimates are biased in Scenario II, where a nonlinear logistic model is used for the big data propensity model. For all three scenarios, the proposed DR estimator works better than the Rivers’ method in terms of the standard errors, and both methods have approximately the same bias and coverage rate.
Remark 2 The asymptotic variance of the Rivers’ method is σ2
y/n (Rivers, 2007), and it is consistent with the simulation results shown in Table 3 for all scenarios, where σ2
y is the variance of y with respect to the outcome regression model,σ2
y = 3 for Scenario I and II and σ2
y = 2.75 for Scenario III. For the proposed DR estimator, if one of the working outcome regression model and the working big data propensity model is correctly specified,
the variance of θB,DRˆ can be estimated by the sampling variance of the imputed values
{xT
iβ∗ :i ∈ A}, which is VB,DR =β∗x
T
Σxxβ∗x/n, where β∗x is the coefficient of (x1,i, x2,i)
in β∗ shown in Remark 1, and Σxx is the variance of (x1,i, x2,i); see Appendix B for
details. For Scenario I and Scenario II, VB,DR = 2/n and VB,DR ≈ 1.25/n for Scenario
III, and the results are consistent with those shown in Table 3. Thus, the proposed DR estimator is more efficient than the Rivers’ method in all three scenarios.
6
Conclusion
Adjusting for the selection bias in big data is an important practical problem. By prop-erly incorporating the auxiliary information from an external source, we can reduce the selection bias either by inverse sampling or by propensity score weighting. Doubly robust estimation shows good performance in the simulation study, and extension to multiple robust estimation (Chen and Haziza, 2017) seems to be a promising research area. The proposed methods implicitly assume that the selection mechanism for big data is missing at random (MAR) in the sense of Rubin (1976). If MAR assumption does not hold, then we can build a Not-Missing-At-Random model for the selection mechanism and estimate the model parameters (Chang and Kott, 2008; Riddles et al., 2016).
If there is error in the matching mechanism, then misclassification errors for δ can arise, and capture-recapture experiments (Chen and Kim, 2014) can be useful in this situation. Such extensions will be topics for future research.
Acknowledgment
The authors wish to thank Professors J. N. K. Rao and Shu Yang for their constructive comments. The research was partially supported by a grant from U.S. National Science Foundation.
Appendix
A. Variance estimation of
θ
ˆ
B,P Sin (13)
We rewrite (14) and (15) as U(θ,λ) =PN i=1δipi(λ)−1(yi−θ), S(λ) =PNwhere Ii is the sampling indicator for sample A, Ii = 1 if i ∈ A and 0 otherwise and gi(λ) =∂logit{pi(λ)}/∂λ. Then, we have
Var{U(θ,λ)} = N
X
i=1
{1−pi(λ)}pi(λ)−1(yi−θ)2, (A.1)
Var{S(λ)} = E[Var{S(λ)| A}] + Var [E{S(λ)|A}]
= E[Var{S(λ)|A}], (A.2)
Cov{U(θ,λ), S(λ)} = E[Cov{U(θ,λ), S(λ)|A}] + Cov [E{U(θ,λ)|A}, E{S(λ)|A}]
= E[Cov{U(θ,λ), S(λ)|A}] , (A.3)
where (A.1) holds since {δi : i ∈ U} are pair-wise independent, the second equalities of (A.2) and (A.3) hold since δi is independent with Ii, and Cov{U(θ,λ), S(λ) | A} =
PN
i=1(yi−θ)Iidi{1−pi(λ)}gi(λ)
T
.
Therefore, we can estimate (A.1) to (A.3) by ˆ V{U(θ,λ)} = X i∈B {1−pi(λ)}pi(λ)−2(yi−θ)2, (A.4) ˆ V{S(λ)} = ˆV{S(λ)|A} = X i∈A
d2ipi(λ){1−pi(λ)}gi(λ)T
gi(λ), (A.5)
ˆ
C{U(θ,λ), S(λ)} = Cˆ{U(θ,λ), S(λ)|A}
= X
i∈A∩B
dipi(λ)−1(yi−θ){1−pi(λ)}gi(λ)T
. (A.6) Denote H(θ,λ) = ∂U(θ,λ) ∂θT ∂U(θ,λ) ∂λT 0 ∂S(λ) ∂λT
to be the Hessian matrix of [U(θ,λ)T
, S(λ)T ]T , and ˆ VU,S(ˆθ,λˆ) = ˆ V{U(θ,λ)} Cˆ{U(θ,λ), S(λ)} ˆ C{U(θ,λ), S(λ)}T ˆ V{S(λ)}
to be the variance estimator of{U(θ,λ), S(λ)}based on (A.4) to (A.6).
Thus, by the sandwich formula, the variance of (ˆθB,P S,λˆ) can be estimated by H(ˆθ,λˆ)−1VˆU,S(ˆθ,λˆ){H(ˆθ,λˆ)−1}
T
, (A.7)
B. Variance estimation of the double robust estimator
Denote ˜ θB,DR(ˆλ) = 1 N ( X i∈B 1 pi(ˆλ) (yi−xT iβ∗) + X i∈A dixT iβ∗ ) ,whereβ∗is the probability limit of ˆβ. Since Var( ˆβ) =O(N−1
B ), ˜θB,DR(ˆλ) is asymptotically equivalent to ˆθB,DR(ˆλ) if n/NB=o(1).
Letλ∗ be the probability limit of ˆλ, and we have ˜ θB,DR(ˆλ) =N−1X i∈B 1 pi(λ∗)(yi−x T iβ∗) +ηB(λ∗) T (ˆλ−λ∗) + ˆθA,reg +op(n−1/2) (B.1)
by Taylor expansion, where ηB(λ∗) =N−1P
i∈Bpi(λ ∗)−1{pi(λ∗)−1}(yi−xT iβ∗)xi and ˆ θA,reg =N−1P i∈Adix T iβ ∗ .
Note that ˆβ is a consistent estimator of β∗. Under the model assumption (11), β∗ is also the probability limit of βN, where βN solves PN
i=1(yi−x T iβ)xi = 0. Thus, we have ˆ β = β∗+Op(NB−1/2), (B.2) βN = β∗+Op(NB−1/2), (B.3)
where the second result holds since βN =β∗ +Op(N−1/2) and NB/N =O(1). Next, we wish to show
ηB(λ∗) =Op(NB−1/2), (B.4)
if one of the outcome regression model and the big data propensity model is correctly specified. Suppose that the outcome regression model is correctly specified. Then, ei = yi −xT
iβ ∗
is independent with xi, so (B.4) holds under mild conditions on the working big data propensity model.
If the big data propensity model is correctly specified, consider ηB(λ∗) =N−1X i∈B (yi−xT iβ∗)−N−1 X i∈B pi(λ∗)−1(yi−xT iβ∗) =ηB,1(λ∗)−ηB,2(λ∗).
First, note that P i∈B(yi−x T iβˆ) = 0, and we have ηB,1(λ∗) = N−1 X i∈B (yi−xT iβ ∗ ) = N−1X i∈B (yi−xT iβˆ) +N−1 X i∈B xT i( ˆβ−β ∗ ) ≤ Op(NB−1/2)N−1 N X i=1 kxik2 = Op(NB−1/2), (B.5)
where the inequality holds by (B.2), and the second equality holds ifxihas a finite second moment. Now, to discussηB,2(λ∗), note that βN satisfies
PN i=1(yi−x T iβN) = 0. Thus, ηB,2(λ∗) = N−1 X i∈B pi(λ∗)−1(yi−x T iβ∗) = N−1 N X i=1 (yi−x T iβ∗) +Op(NB−1/2) = N−1 N X i=1 (yi−xT iβN) +N−1 N X i=1 xT i(βN −β∗) +Op(N −1/2 B ) = Op(NB−1/2), (B.6)
where the last equality holds by (B.3). Thus, if the big data propensity model is correctly specified, we have shown (B.4) by (B.5) and (B.6).
Similarly, we can show that the first term of (B.1) has order Op(NB−1/2) if one of the outcome regression model and the big data propensity model is correctly specified. Thus, the variance of ˜θB,DR(ˆλ) can be estimated by the sampling variance of ˆθA,reg under the
assumption n/NB =o(1).
References
Baker, R., Brick, J.M., Bates, N.A., Battaglia, M., Couper, M.P., Dever, J.A., Gile, K.J. & Tourangeau, R. (2013). Summary report of the AAPOR task force on non-probability sampling, J. Surv. Stat. Methodol., 1, 90–143.
Bethlehem, J. (2016). Solving the nonresponse problem with sample matching?,Soc. Sci. Comput. Rev., 34, 59–77.
Breidt, F.J. & Fuller, W.A. (1993). Regression weighting for multipurpose sampling, Sankhya B, 55, 297–309.
Chang, T. & Kott, P.S. (2008). Using calibration weighting to adjust for nonresponse under a plausible model, Biometrika,95, 555–571.
Chen, S. & Haziza, D. (2017). Multiply robust imputation procedures for the treatment of item nonresponse in surveys, Biometrika,104, 439–453.
Chen, S. & Kim, J.K. (2014). Two-phase sampling experiment for propensity score esti-mation in self-selected samples, Ann. Appl. Stat., 8, 1492–1515.
Cochran, W.G. (1977). Sampling Techniques, 3rd edn, John Wiley & Sons, New York. Efron, B. & Hastie, T. (2016).Computer Age Statistical Inference, Cambridge, New York. Elliott, M. & Valliant, R. (2017). Inference for non-probability samples, Stat. Sci., 32,
249–264.
Franke, B., Plante, J.-F., Roscher, R., Lee, E.-S.A., Smyth, C., Hatefi, A., Chen, F., Gil, E., Schwing, A., Selvitella, A., Hoffman, M.M., Grosse, R., Hendricks, D. & Reid, N. (2016). Statistical inference, learning and models in big data, Int. Stat. Rev., 84, 371–389.
Fuller, W.A. (2009).Sampling Statistics, John Wiley & Sons, Hoboken.
Goffinet, B. & Wallach, D. (1996). Optimized importance sampling quantile estimation, Biometrika ,83, 791–800.
Henmi, M., Yoshida, R. & Eguchi, S. (2007). Importance sampling via the estimated sampler, Biometrika, 94, 985–991.
Hidiroglou, M. (2001). Double sampling,Surv. Methodol., 27, 143–154.
Hinkins, S., Oh, H.L. & Scheuren, F. (1997). Inverse sampling design algorithms, Surv. Methodol.,23, 11–21.
Horvitz, D.G. & Thompson, D.J. (1952). A generalization of sampling without replace-ment from a finite universe, J. Amer. Statist. Assoc., 47(260): 663–685.
Keiding, N. & Louis, T.A. (2016). Perils and potentials of self-selected entry to epidemi-ological studies and surveys (with discussions), J. Roy. Statist. Soc. Ser. A, 179, 1–28.
Kim, J.K. (2010). Calibration estimation using exponential tilting in sample surveys, Surv. Methodol., 36, 145–155.
Kim, J.K. (2011). Parametric fractional imputation for missing data analysis,Biometrika, 98, 119–132.
Kim, J.K., Berg, E. & Park, T. (2016). Statistical matching using fractional imputation, Surv. Methodol., 42, 19–40.
Kim, J.K. & Haziza, D. (2014). Doubly robust inference with missing data in survey sampling, Statist. Sinica,24, 375–94.
Kim, J.K., Navarro, A. & Fuller, W.A. (2006). Replicate variance estimation after multi-phase stratified sampling, J. Amer. Statist. Assoc., 101, 312–320.
Kim, J.K. & Rao, J.N.K. (2011). Combining data from two independent surveys: a model-assisted approach, Biometrika, 99, 85–100.
Legg, J.C. & Fuller, W.A. (2009). Two-phase sampling, in D. Pfeffermann & C.R. Rao (eds),Handbook of Statistics 29A, Sample Surveys: Design, Methods and Applications, North Holland, pp. 55–70.
Meng, X.L. (2018). Statistical paradises and paradoxes in big data (i): Law of large populations, big data paradox, and 2016 US presidential election. Submitted.
Park, S., Kim, J.K. & Stukel, D. (2017). A measurement error model for survey data integration: combining information from two surveys, Metron, 75, 345–357.
Pfeffermann, D. (1993). The role of sampling weights when modeling survey data, Int. Stat. Rev., 61, 317–337.
Rao, J.N.K. & Molina, I. (2015). Small Area Estimation, 2nd edn, John Wiley & Sons, Hoboken.
Rao, J.N.K., Scott, A.J. & Benhin, E. (2003). Undoing complex survey data structures: some theory and applications of inverse sampling, Surv. Methodol., 29, 107–128. Rao, J.N.K. & Sitter, R.R. (1995). Variance estimation under two-phase sampling with
application to imputation for missing data, Biometrika, 82, 453–460.
Riddles, M.K., Kim, J.K. & Im, J. (2016). A propensity-score-adjustment method for nonignorable nonresponse, J. Surv. Stat. Methodol.,4, 215–245.
Rivers, D. (2007). Sampling for web surveys,Proceedings of the Survey Research Methods Section, American Statistical Association.
Rubin, D.B. (1976). Inference and missing data,Biometrika, 63(3): 581–592.
S¨arndal, C.E., Cassel, C.M. & Wretman, J.H. (1992). Model Assisted Survey Sampling, Springer-Verlag, New York.
Stukel, D. & Kott, P. (1996). Jackknife variance estimation under two-phase sampling: An empirical investigation.,Proceedings of the Survey Research Methods Section, American Statistical Association.
Tam, S.-M. (2015). A statistical framework for analysing big data, Surv. Statist., 72, 36–51.
Tam, S.-M. & Clarke, F. (2015). Big data, official statistics and some initiatives by the australian bureau of statistics, Int. Stat. Rev., 83, 436–448.
Tam, S.-M. & Kim, J.K. (2018). Big data, selection bias and ethics – an official statisti-cian’s perspective, Stat. J. IAOS. Accepted for publication.
Till´e, Y. (2006). Sampling Algorithms, Springer-Verlag, New York.
Till´e, Y. (2016). Unequal probability inverse sampling, Surv. Methodol., 42, 283–295. Wu, C. & Sitter, R.R. (2001). A model-calibration approach to using complete auxiliary
Table 1: Data Structure
Data Representativeness X Y
A Yes X
B No X X
Table 2: Monte Carlo bias (Bias), standard error (SE), relative bias of the estimated standard error (RB.SE) and coverage rate (CR) for different estimators based on 2,000 simulation studies. “Naive” stands for the naive estimator, “Calibration” for the calibra-tion estimator, and “ Proposed” for the proposed inverse sampling estimator. “Par.” is short for the parameter that we are interested in.
Par. φ Method n = 500 n= 1000
Bias SE RB.SE CR Bias SE RB.SE CR
¯ YN −0.2 Naive -0.27 0.133 0.01 0.48 -0.27 0.096 -0.01 0.22 Calibration 0.00 0.070 -0.01 0.95 0.00 0.050 -0.02 0.95 Proposed 0.00 0.146 0.01 0.95 0.00 0.104 0.00 0.95 −0.5 Naive -0.55 0.117 0.01 0.01 -0.55 0.083 0.00 0.00 Calibration 0.00 0.081 -0.04 0.94 0.00 0.057 -0.03 0.94 Proposed 0.00 0.141 0.00 0.95 0.00 0.101 0.00 0.95 PN −0.2 Naive 0.02 0.021 -0.01 0.83 0.02 0.015 -0.01 0.70 Calibration 0.00 0.018 0.01 0.95 0.00 0.012 0.01 0.95 Proposed 0.00 0.021 -0.01 0.95 0.00 0.015 0.00 0.95 −0.5 Naive 0.05 0.021 0.00 0.45 0.04 0.015 0.01 0.16 Calibration -0.01 0.018 0.09 0.92 -0.01 0.012 0.09 0.89 Proposed -0.01 0.021 0.00 0.92 -0.01 0.014 0.02 0.90
Table 3: Monte Carlo bias (Bias), standard error (SE) and coverage rate (CR) of different data integration methods based on 2,000 simulation studies for each scenario. “Naive” stands for the naive estimator, “Rivers” for the Rivers’ method, “PS’ for the proposed propensity score weighting estimator and “DR” for the proposed doubly robust estimator.
Scenario Method n= 500 n = 1000 Bias SE CR Bias SE CR I Naive 0.19 0.001 0.00 0.19 0.001 0.00 Rivers 0.00 0.077 0.95 0.00 0.054 0.95 PS 0.00 0.023 0.95 0.00 0.016 0.95 DR 0.00 0.063 0.95 0.00 0.044 0.95 II Naive -0.10 0.001 0.00 -0.10 0.001 0.00 Rivers 0.00 0.077 0.96 0.00 0.055 0.94 PS 0.11 0.183 0.99 0.08 0.085 1.00 DR 0.00 0.063 0.95 0.00 0.046 0.95 III Naive 0.19 0.001 0.00 0.19 0.001 0.00 Rivers 0.00 0.074 0.94 0.00 0.053 0.95 PS 0.00 0.022 0.95 0.00 0.016 0.95 DR 0.00 0.050 0.95 0.00 0.035 0.95