White Rose Research Online URL for this paper:
http://eprints.whiterose.ac.uk/140802/
Version: Published Version
Article:
Xu, H., Li, S., You, Y. et al. (2 more authors) (2018) Unwrapped phase estimation via
normalized probability density function for multibaseline InSAR. IEEE Access, 7. pp.
4979-4988. ISSN 2169-3536
https://doi.org/10.1109/ACCESS.2018.2886702
© 2018 IEEE. Personal use of this material is permitted. Permission from IEEE must be
obtained for all other users, including reprinting/ republishing this material for advertising or
promotional purposes, creating new collective works for resale or redistribution to servers
or lists, or reuse of any copyrighted components of this work in other works. Reproduced
in accordance with the publisher's self-archiving policy.
[email protected] https://eprints.whiterose.ac.uk/
Reuse
Items deposited in White Rose Research Online are protected by copyright, with all rights reserved unless indicated otherwise. They may be downloaded and/or printed for private study, or other acts as permitted by national copyright laws. The publisher or other rights holders may allow further reproduction and re-use of the full text version. This is indicated by the licence information on the White Rose Research Online record for the item.
Takedown
If you consider content in White Rose Research Online to be in breach of UK law, please notify us by
Received December 2, 2018, accepted December 5, 2018, date of publication December 14, 2018, date of current version January 11, 2019.
Digital Object Identifier 10.1109/ACCESS.2018.2886702
Unwrapped Phase Estimation via Normalized
Probability Density Function for
Multibaseline InSAR
HUAPING XU 1, (Member, IEEE), SHUO LI 1, YANAN YOU2, AIFANG LIU3, AND WEI LIU 4, (Senior Member, IEEE) 1School of Electronic and Information Engineering, Beihang University, Beijing 100083, China
2School of Information and Communication Engineering, Beijing University of Posts and Telecommunications, Beijing 100876, China 3Nanjing Research Institute of Electronics Technology, Nanjing 211113, China
4Department of Electronic and Electrical Engineering, The University of Sheffield, Sheffield S1 3JD, U.K.
Corresponding author: Yanan You ([email protected])
This work was supported by the National Natural Science Foundation of China under Grant 61471020.
ABSTRACT Interferometric synthetic aperture radar (InSAR) is a powerful technique for obtaining terrain
information based on the interferometric phase. Multibaseline (MB) InSAR is an extension of the conven-tional InSAR and is used to improve the estimation accuracy and reliability of the unwrapped phase. Based on a newly defined normalized phase probability density function (pdf), a novel wrapped-to-unwrapped phase (W2UP) estimation method is proposed for MB-InSAR. First, the concept of the normalized pdf is introduced to overcome the limitation of the fixed 2π period for different baseline cases. Then, a new maximum likelihood estimation is established using the MB normalized pdfs, which has a much steeper peak around the true phase value than the single baseline case and leads to higher estimation accuracy. The proposed W2UP method estimates the unwrapped phase from multiple filtered interferograms, so it is less influenced by the phase noise. Both the theoretical analysis and results using the simulated and real MB data are provided to verify the effectiveness of the proposed method.
INDEX TERMS Maximum likelihood estimation, synthetic aperture radar, radar interferometry, phase
estimation.
I. INTRODUCTION
Interferometric synthetic aperture radar (InSAR) recon-structs terrain information from the absolute phase differ-ence between two SAR images with a slight look angle difference [1]. Generally, the interferometric phase in an InSAR interferogram is wrapped to the principal interval (−π, π] since it is obtained through conjugate multiplication of two complex SAR images. Unwrapped phase, containing slant range difference information, is linked to the height and deformation profile. A wide range of applications, such as global digital elevation models (DEMs) reconstruction [2], terrain change detection [3], atmosphere estimation [4], glacier monitoring [5], and vegetation information estimation [6], all rely on the unwrapped phase. Therefore, high pre-cision unwrapped phase estimation is very important to the successful application of InSAR.
Multibaseline (MB) InSAR, based on diverse interfero-metric measurements, can extend the phase ambiguity period
to simplify the phase unwrapping and improve the phase estimation accuracy [7]. Many methods have been proposed for MB-InSAR data fusion, which may be divided into the following categories. The first category is based upon the combined optimization idea, e.g., the coarse-to-fine (C2F) method [8], [9], the Chinese remainder theorem (CRT) based method [10], [11], and the linear combination method [12], [13]. These methods correct the ambiguity vectors and improve the success rate of phase unwrapping. However, they cannot improve the phase precision because their phase principal value is only determined by the longest baseline. Another category is based on the minimum norm idea, e.g., the least-square (LS) [14], the subspace projection-based [15], [16], and the wavelet variation method [17]. These methods improve phase estimation accuracy with MB-InSAR data. They do not take phase statistics into account, and therefore are not robust enough against phase noise. The third category uses the statistical properties of interference
VOLUME 7, 2019
2169-35362018 IEEE. Translations and content mining are permitted for academic research only. Personal use is also permitted, but republication/redistribution requires IEEE permission. See http://www.ieee.org/publications_standards/publications/rights/index.html for more information.
phases, e.g., the maximum likelihood estimation (MLE), the Kalman filtering [18], [19], and the maximum a posteriori (MAP) method [20]. These methods use both the phase and amplitude information of the SAR images so that their phase estimation accuracy is higher. Several other methods, such as the data-classification, the ant-colony-based, and the cluster-analysis-based method [21], [22], need large amounts of data for model training, which limits their practical applications. Among MB-InSAR data fusion methods mentioned above, MLE is asymptotically the closest estimator to the Cramer-Rao lower bound (CRLB) [23]. Under the assumption of Gaussian phase noise, it provides the optimum solution to the phase estimation of MB-InSAR [24].
The MLE method [25], estimating the phase values of each pixel separately, can adapt to the view angle and the topo-graphic slope, even at the lack of priori information about the observed scene. Extensive research on the MLE technique has been done in recent years. The Image-to-Height (I2H) MLE method [20] utilizes the probability density function (pdf) of SAR complex images to reconstruct urban surface models. The image-to-phase (I2P) MLE method [26] estimates the unwrapped result from the complex multiple SAR images directly. Both I2H and I2P estimators are based on a joint pdf of SAR complex images and extend the period of the wrapped phase. However, the noise in image worsens the estimation performance, and even leads to a biased estimate since their input is a complex SAR image set. The phase-to-height (P2H) MLE method [28] estimates the terrain height from multiple interferometric phases. The period (i.e. ambiguity height) diversity of height pdf is utilized to improve the estimation of the terrain elevation. Unfortunately, the P2H method is not suitable for those applications that require phase data, such as deformation monitoring via differential interferometric phase. Although the height data can be converted into phase data after the P2H method, new errors will be introduced in the result during the conversion process. In order to obtain a more accurate unwrapped phase, a straightforward filtered wrapped-to-unwrapped phase estimator is needed to reduce the effects of phase noise as well as the error propagation.
In this work, a direct MB wrapped-to-unwrapped phase (W2UP) MLE method is proposed to deal with MB unwrapped phase estimation. Firstly, the original phase pdf is normalized by the baseline ratio, which makes the fixed 2π
period to be compressed or extended. Then a new likelihood function within a wider phase range is presented by combin-ing MB normalized pdfs. And a W2UP MLE is proposed for the two-dimensional (2-D) unwrapped phase of the reference baseline. MB filtered interferometric phase set, as the input of new MLE, improves the estimator’s accuracy. The W2UP method can suppress error propagation of phase discontinuity because there is no need to consider residues and phase gradi-ent. The effectiveness of the proposed algorithm is supported not only by theoretical analysis, but also by experimental results using both simulated and real data.
The rest of the paper is organized as follows. In Sec. II, MB-InSAR is briefly reviewed, the normalized phase pdf
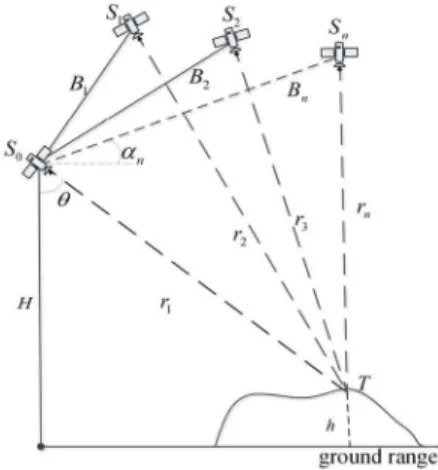
FIGURE 1. InSAR spatial geometry with multibaseline, baseline obliquity anglea, view angleθ, master satellite heightH, and target heighth.
is proposed, and the W2UP method based on the normal-ized phase pdf is detailed. The steps of the 2-D unwrapped phase estimation via W2UP is given in Sec. III, where its performance is further discussed. In Sec. IV, results based on both simulated and real MB-InSAR data are provided and conclusions are drawn in Sec. V.
II. WRAPPED-TO-UNWRAPPED PHASE ESTIMATOR FOR MB-INSAR
A. MB-INSAR OBSERVATION MODEL
The observation geometry of an MB-InSAR system is shown in Fig. 1.Si (i = 0,1,2, . . . ,N) represents the position of
thenth antenna phase center andBn(n=1,2, . . . ,N) is the
spatial baseline defined as the distance between positionS0
andSn.
The interferometric phase, obtained by conjugate multi-plication of the common master image and each slave one, is related to the profilehby [29]
φn=mod 2mπBn⊥ λrsinθ h,2π (1) whereλis the wavelength,Bn⊥ = Bncos(θ−αn)denotes
the component perpendicular to the view direction. The mod
(·)operator retains the principal value and the actual phase is wrapped within the period (−π, π]; moreover, m is the transmit-receive factor, wherem =1 represents the bistatic mode, andm=2 is the monostatic mode.
B. INTERFEROMETRIC PHASE PROBABILITY DENSITY FUNCTION
In theory, different interferograms are mutually independent. For the single-baseline case, the pdf of the interferometric phase is given by [30] pdf (φ|φ0)= 1 2π 1− |γ|2 1− |γ|2cos2(φ−φ 0) · "
1+|γ|cos(φp−φ0)arccos(−|γ|cos(φ−φ0))
1− |γ|2cos2(φ−φ 0)
#
(2)
H. Xuet al.: Unwrapped Phase Estimation via Normalized pdf for MB InSAR
FIGURE 2. Phase pdfs and their product for the dual-baseline case. Phase values areφ0,1=9.6109 andφ0,2=22.8832 rad.
where|γ|represents the amplitude of the complex coherence coefficientγ,φis the measured phase, andφ0the real phase.
The variance of phase distribution decreases gradually when the coherence coefficient value increases. Once the phase
φ has been observed, the pdf can be seen as a likelihood function for the unknown parameterφ0estimation [30]
fSB(φ0)=pdf (φ|φ0) (3)
fSB(φ0)is periodic with peaks atφ0+2π,k∈integer. The
steeper the slope around the peak of the likelihood function is, the higher the estimation accuracy of the unwrapped phase. In addition, a larger likelihood function period is beneficial to phase unwrapping.
The conventional phase pdf always has a 2π period in terms of the cosine function in (2). Because of different peak positions and the same 2π period of different single baseline pdfs, it is impossible to give a likelihood function for MB-InSAR with the multiplication of these pdfs directly. As an example, consider a dual-baseline InSAR: the baseline set is {210m, 500m}, the coherence coefficient set is {0.7, 0.55}, and the target height is 50m. Both likelihood functions
fSB(φ0,1) = pdf(φ1|φ0,1) andfSB(φ0.2) = pdf(φ2|φ0,2) are
presented in Fig. 2. Curve c shows the product function, i.e. pdf(φ1|φ0,1)·pdf(φ2|φ0,2), still has a 2π period and a
smoother curve. It is shown that the product function neither extends the phase wrapping period nor improves the accuracy.
C. W2UP ESTIMATOR VIA NORMALIZED PHASE PROBABILITY DENSITY FUNCTION
In any case, the period of the interferometric phase pdf is 2π, which prevents employing a direct product function for unwrapped phase estimation. Thus, the key to removing the ambiguity positions is to overcome this 2π limitation. Con-sidering the periodicity of the cosine function, a processing trick similar to the single-frequency signal modulation [27] can provide a viable solution.
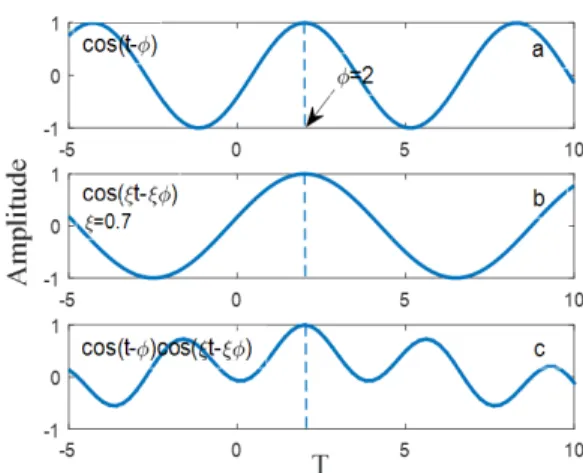
As shown in Fig. 3, the cosine signal cos(t−φ), as the original signal (curve a), has a 2π period. Multiplying the
FIGURE 3. Effect of single-frequency cosine signal modulation.
angular frequency and the initial phase byξ, the period of cos(ξt−ξ φ)changes to 2π/ξ( curve b). Here the signal still reaches the maximum at the initial phaseφ. Next, the original signal is modulated by cos(ξt−ξ φ)( curve c). In a larger interval, the unique peak will appear at the initial phaseφ.
Therefore, single-frequency signal modulation is applied to the phase pdf in MB-InSAR. As discussed in our earlier work on normalized phase pdf in [31], each phase pdf is normalized by its own baseline ratio. Based on the transfer relation between the height profile and the unwrapped phase, the phase ratioξnis calculated as
ξn= φn φl = 2mπBn⊥ λrsinθ h 2mπBn⊥ λrsinθ h = Bn⊥ Bl⊥ (4) whereBl serves as the reference baseline. The normalized
phase ofBnis expressed asφn,norm = φn/ξn. According to
(2) and (4), the normalized phase pdf ofBnis written as (5),
as shown at the bottom of the next page, whereφ0is the real
phase value of the reference baseline.
The period of the normalized pdf now changes to{2πξn}.
Based on the normalized phase processing, the proposed likelihood function for MB-InSAR with a multiplication of the normalized phase pdfs forN baselines is
fMB(8|φ0)= N
Y
n=1
pdfnorm(φn,norm|φ0) (6)
where the matrix8represents the interferometric phase set. A tractable MB W2UP estimator is then established based on this likelihood function. The estimated unwrapped phaseφ0
of the reference baseline is the phase corresponding to the maximum of the curve of the likelihood function
ˆ
φMBl =arg max
φ0
fMB(8|φ0) (7)
Then, the period of the interferometric phase is extended to
CpdfMB =LCM N
n=1(2π/ξn) (8)
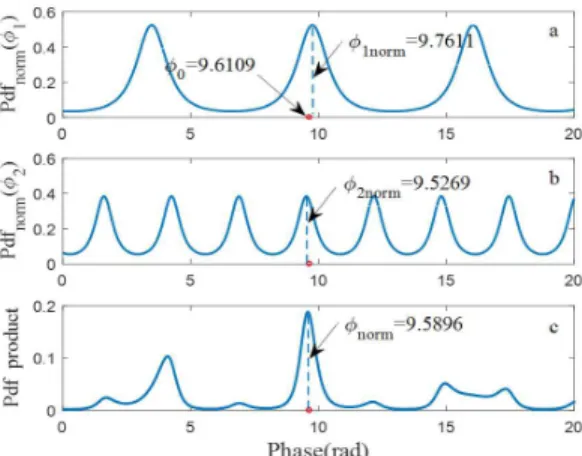
FIGURE 4. Normalized phase pdfs and their product for the dual-baseline case with the reference baselineB1=210m. The real phase ofB1is obtained from system parameters. The corresponding normalized phase values areφ1,norm=9.7611 andφ2,norm=9.5269 rad, and the estimated phase isφnorm=9.5896.
whereLCMnN=1(·)is the function calculating the least com-mon multiple of the N elements. The reference baseline is arbitrarily chosen to increase the selectivity of unwrapped results. By increasing the number of baselines, the MLE becomes more robust.
Two baseline measured phases for a single pixel are uti-lized to verify the effectiveness of the W2UP method. Sim-ulation parameters are the same as those in Fig. 2, and the result is shown in Fig. 4. B1 = 210m is chosen as the
reference baseline. The two normalized phase pdfs are shown in Fig. 4(a) and (b), respectively. The likelihood function, composed of two normalized pdfs, has a unique peak shown in Fig. 4 (c), and its period is significantly larger than 2π. By comparison with the phase pdf of the reference baseline, the slope of the likelihood function is sharper around the real phaseφ0 = 9.6109, which means a smaller estimated
variance. Moreover, the much-reduced ambiguity peaks also help to determine the true unwrapped result.
III. ESTIMATION OF TWO-DIMENSIONAL UNWRAPPED PHASE AND PERFORMANCE ASSESSMENT
A. TWO-DIMENSIONAL UNWRAPPED PHASE ESTIMATION VIA W2UP
The W2UP method is extended to the 2-D case. Taking one of the baselines as a reference, all the MB phases are scaled
by the baseline ratio set {ξn}Nn=1, and then the coherence
coefficient set{γn}Nn=1is introduced. The search interval is
determined with the priori DEM or the shortest baseline’s unwrapped result. Clearly, pixel by pixel, the 2-D unwrapped phase of the reference baseline will be obtained.
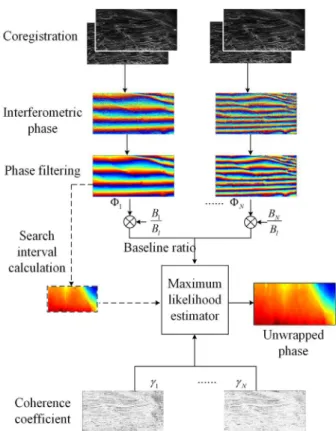
The estimation procedure for the 2-D W2UP method is illustrated in Fig. 5 and the major processing blocks consist of:
1) MB-InSAR image co-registration based on the correla-tion funccorrela-tion between the master and slave images, and geometry co-registration among the baselines [15]. 2) Interferometric phase filtering utilizing the improved
local fringe frequency estimation proposed in [32]. MB wrapped phase set is filtered at this step.
3) Search interval estimation without a priori DEM. Firstly, we downsample the filtered phase of the short-est baseline to get a small interferogram. Subsequently, the small interferogram is unwrapped and then inter-polated to the original size. Finally, the coarse phase that contains terrain information is normalized to the reference baseline to achieve the search interval. 4) Unwrapped phase estimation, including the following
steps: baseline ratios are first calculated from (4); then normalized phase pdfs are obtained by (5); the like-lihood function is obtained from (6); calculating the maximum of the likelihood function pixel by pixel based on (7), the unwrapped phase of the reference baseline is obtained.
B. PERFORMANCE ASSESSMENT OF W2UP METHOD
To compare the performance of the proposed W2UP method and the I2P method in [26], the variance of the estimation is calculated. For the single-look single-baseline case, both W2UP and I2P have the same variance expression as [1]
σ2ˆ φ0(SB) = π Z −π (φ−φ0)2pdf φ|φ0dφ = π 2 3 −πarcsinγ+arcsin 2γ −Li2(|γ| 2) 2 (9) where Li2(·) is a hypergeometric function, defined as
Li2(|γ|2) = ∞
P
k=1 |γ|2k
k2 . For the MB case, a triple-antenna
system shown in Fig. 6 is established with the same baseline
pdfnorm(φn,norm|φ0)= 1 2π 1− |γn|2 1− |γn|2cos2(ξnφn,norm−ξnφ0) · 1+
|γn|cos(ξnφn,norm−ξnφ0) arccos(− |γn|cos(ξnφn,norm−ξnφ0))
q 1− |γn|2cos2(ξnφn,norm−ξnφ0) = 1 2π 1− |γn|2 1− |γn|2cos2(φn−ξnφ0) · 1+
|γn|cos(φn−ξnφ0) arccos(− |γn|cos(φn−ξnφ0))
q
1− |γn|2cos2(φn−ξnφ0)
(5)
H. Xuet al.: Unwrapped Phase Estimation via Normalized pdf for MB InSAR
FIGURE 5. MB-InSAR unwrapped phase estimation via W2UP.
FIGURE 6. InSAR spatial geometry with a triple-antenna system.
obliquity. The available baseline set includes one overall baselineB1 = B2+B3as the reference; the baseline ratio
isξn=Bn/B1,n=1,2,3.
For the I2P method, the interferometric phase φˆ0(I2P) is
derived from the model in [33] as
ˆ φ0(I2P)= 3 P n=1 ξnαnφn 3 P n=1 ξ2 nαn (10)
whereφnis the measured phase of thenth baseline andα1= |γ1| − |γ2||γ3|,α2 = |γ2| − |γ1||γ3|,α3 = |γ3| − |γ1||γ2|.
Therefore, the estimation variance of I2P method is rewritten in the following expression
σ2ˆ φ0(I2P)= 3 X n=1 ξnαn 3 P m=1 ξ2 mαm 2 σ2ˆ φ0(SBn) (11) whereσ2 ˆ
φ0(SBn) is the estimation variance of then th single
baseline which is calculated by (9).
From (7), the phase of the reference baseline is estimated with
∂fMB(φ0)
∂φ0 |φ0= ˆφ
l
MB =0 (12)
Substituting (6) into (12), we have
3 X n=1 ∂pdfnorm(φn,norm|φ0) ∂φ0 = 3 X n=1 ξn(φn−ξnφ0)βn=0 (13) whereβn= |γn| · 3|γn|√1−|γn|2+1+2|γn|2arccos(−|γn|) (1−|γn|2) h√ 1−|γn|2+|γn|arccos(−|γn|) i.
Solving equation (13), then the phase estimationφˆ0(W2UP)
of the W2UP method is given by
ˆ φ0(W2UP)= 3 P n=1 ξnβnφn 3 P n=1 ξnβn (14)
The phase estimation variance is deduced as
σ2ˆ φ0(W2UP)= 3 X n=1 ξnβn 2 P m=1 ξmβm 2 σ2ˆ φ0(SBn) (15)
Set the overall baseline B1=500m, the critical baseline
Bc=2000m, and then the coherence coefficient varies with
the baseline length as
|γn| = |γ0||γBn| = |γ0| 1−Bn Bc = |γ0| 1−ξnB1 Bc (16) where|γBn| refers to the baseline decorrelation factor and
|γ0|represents the decorrelation from volume scatter, thermal
noise and misregistration decorrelation, etc. With |γ0| =
0.9, the standard deviation varying with the baseline ratio is evaluated for these two methods and the results are shown in Fig. 7. For the same baseline conditions, the W2UP method is always better with a lower standard deviation than that of I2P.
High precision estimation needs a strong correlation [34]. Although the interferometric phase filter increases the corre-lation dramatically, it is not employed in the I2P method since it estimates the phase from complex SAR images directly. Instead, the W2UP estimator uses the filtered phase and can exploit the increased correlation in the processing, leading to a more accurate estimation result.
IV. RESULTS AND ANALYSIS
A. SIMULATED DATA
In this section, simulation results are provided to demonstrate the performance of the proposed method. The MB interfero-grams are generated using the DEM data in Lanzhou, China.
FIGURE 7. Standard deviation of phase estimation of the W2UP and I2P methods.
TABLE 1. Simulation parameters.
The observation area is 2048m×2048m. The height profile, shown in Fig. 8(a), is from 0 to 175m. The range of terrain slope varies within (−42, 45) degrees. Some other simulation parameters are listed in Table 1.
According to the parameters in Table 1, three SAR complex images are simulated [35]. Setting the reference baseline as 1000 m, the baseline ratios areξ1 =1,ξ2 = 0.6, andξ3 =
0.4. Fig. 8(b) is the SLC master image. The ideal phase of reference baseline is obtained according to the relationship of space geometry. The filtered wrapped phases are illustrated in Fig. 8 (d) – (f).
For a comparison between the W2UP and the single-baseline unwrapped results, the Quality-Map-Guided (QMG) phase unwrapping method [36] is used in the contrast exper-iment. The unwrapped phase and the estimation error of QMG method are presented in Fig. 9(a). Furthermore, the I2P method [26], as another comparison, combines these three SLC images to retrieve the unwrapped phase directly. Since the complex SAR images with noise are input into the I2P estimator, the estimation result is heavily affected by noise. To overcome the problem, the estimated phase is further filtered by the Lee filter [7], and the final result is presented in Fig. 9(b). Fig. 9(c) displays the result of the W2UP method. There are obvious distinctions between the results of different methods.
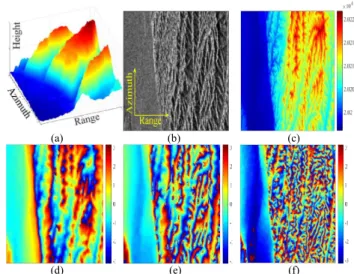
FIGURE 8. Simulated MB SAR image of the test area and corresponding interferograms. (a) DEM of the test area. (b) Single look complex master image. (c) The ideal phase of reference baseline. (d) – (f) Filtered phase of three baselines and baseline lengths are {400, 600, 1000} m separately.
FIGURE 9. Unwrapped phase and phase error. (a) QMG for the single reference baseline. (b) I2P method with Lee filter. (c) W2UP method.
The estimation results are evaluated with two indexes. One is the phase-gradient-jump number [32], and the other is the standard deviation (SD) of unwrapped phase error.
Phase-gradient-jump occurs when the phase gradient of adjacent pixels changes beyond(−π, π]. It is a reflection of
H. Xuet al.: Unwrapped Phase Estimation via Normalized pdf for MB InSAR
TABLE 2. Evaluation results of simulated data.
the number of phase unwrapping errors. One target of phase unwrapping is to minimize the phase-gradient-jump number, which is calculated by J= M−1 X i=1 N X j=1 φ(i,j)−φ(i+1,j) 2π + M X i=1 N−1 X j=1 φ(i,j)−φ(i,j+1) 2π (17) where the size of the unwrapped phase isM ×N,φ (i,j)
represents the value of the unwrapped phase,| · |denotes the absolute value and [·] stands for the rounding operation.
The SD of unwrapped phase error is calculated as [32]
εφ= v u u t 1 C−1 C X c=1 1φ (ic,jc)−1φ¯ 2 (18) where1φ (i,j) = φ(i,j)−φideal(i,j) andφideal is the real
unwrapped phase, which is straightforwardly calculated by the InSAR observation geometry and SAR system parame-ters.φis the estimated phase,Cis the number of pixels and
1φ¯ is the mean value of phase error1φ (i,j). Table 2 gives the evaluation results of the three methods.
First, we compare the results of the conventional single-baseline InSAR and the MB-InSAR. For the QMG result, the total phase-gradient-jump number is 1349 in a 660×
660 pixels region, which is much more than the W2UP result (161) and the I2P result (757). Calculating the SD of the unwrapped phase error based on (18) for different methods, the QMG result has the largest SDvalue. It indicates that the fusing MB phase samples can correct the phase unwrapping error.
In the W2UP process, the wrapped phase set is filtered with an adaptive window by the improved local fringe frequency estimation first [32]. It has the smallest phase jumps and SD, which means that W2UP is the most robust and accurate method for unwrapped phase estimation among the three methods.
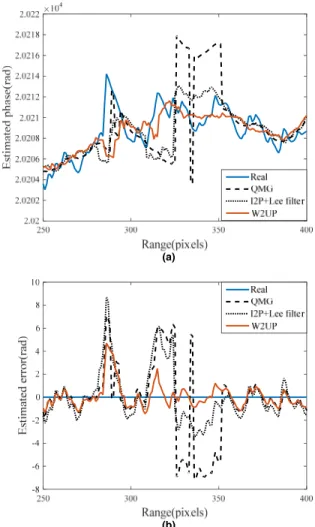
For further comparison, Fig. 10 displays a cross-section through estimated phases and phase error maps in region A. As clearly shown, the curve of QMG result changes beyond 2π at low coherent area, indicating that phase unwrapping with the single baseline is prone to error propagation. Making use of MB interferograms improves the consistency of the unwrapped phase effectively. The major difficulty for the I2P method is phase noise. Considerable fluctuations appear in the curve, which affects the phase unwrapping perfor-mance. Compared to the other methods, the curve of the
FIGURE 10. Profile comparison of unwrapping results and phase error for simulated data.
W2UP method is most consistent with the ideal phase since it suppresses the influence of phase noise by phase filtering before phase estimation. Meanwhile, numerous ambiguity errors of phase estimation can be corrected by the W2UP method because of the extended phase ambiguity period. Thus, correct and effective unwrapped results can be obtained via the proposed W2UP method.
B. REAL DATA
In this experiment, we use the SLC data of a reservoir area in Shanxi, China, recorded by the N-SAR (SAR of Nanjing Research Institute of Electronic Technology) system. N-SAR is a single-pass airborne platform with two modes: to transmit with one antenna and receive with both, or to transmit and receive separately. The main system parameters are shown in Table 3.
The master image with the size of 16380 pixel
×10000 pixel is shown in Fig. 11(a). According to the antennas structure, the baseline ratios areξ1 = 1 andξ2 =
ξ3=0.5, respectively. Fig. 11(b)-(f) are the wrapped phases
with different baselines and the estimation result with W2UP method.
TABLE 3. System parameters of N-SAR.
FIGURE 11. Unwrapped phase acquisition of real data via the W2UP method for a reservoir area in Shanxi, China. (a) SAR SLC image. (b), (c) Interferogram withξ=0.5 andξ=1. (d), (e) Filtered phase of (b) and (c), respectively. (f) Estimated phase using W2UP.
The phase, existing in the reservoir area, appears in the form of noise. So we remove the phase data of the water area according to the coherence coefficient. In Fig. 11, an area of 1000 pixel×1000 pixel in the red rectangle is chosen to evaluate the performance of different methods. The results of the chosen area are presented in Fig. 12, where Fig. 12(a) is the unwrapped phase with QMG from Fig. 11(e), Fig. 12(b) is the filtered result of I2P from three complex SAR images, and Fig. 12(c) is the estimation result with W2UP from Fig. 11(f).
FIGURE 12. Unwrapped phase estimation results of different methods for the evaluated area. (a) QMG. (b) I2P+Lee filter. (c) W2UP. (d) Profile comparison of unwrapping results for real data.
TABLE 4.Evaluation results of real data.
Due to a lack of ideal phase value information, the quality is evaluated with the phase-gradient-jump number only and the result is shown in Table 4.
As can be seen, the estimated phase by W2UP has a lower phase-gradient-jump number than both QMG and I2P. Although the result of I2P after Lee filtering has a smaller jump number, the estimated phase is more disturbed by noise as presented in Fig. 12(b).
The profile of these unwrapped results is shown in Fig. 12(d). Similar observations can be made as in sim-ulated data. The discontinuity (an integer multiple difference of 2π) occurs in the QMG unwrapping result (blue line) because a single baseline is sensitive to noise. The correct ambiguity number is available after combining MB interfer-ograms. However, fluctuations in the curve of the I2P (red line) show that the algorithm cannot eliminate the effect of noise effectively. The curve of W2UP (yellow line) is more stable, which means the continuity of phase estimation result is better. The assessments reconfirm the effectiveness of the proposed W2UP method and its superior performance over the other two methods.
V. CONCLUSION
A novel unwrapped phase estimation method called W2UP for MB-InSAR is proposed. Based on single-frequency signal
H. Xuet al.: Unwrapped Phase Estimation via Normalized pdf for MB InSAR
modulation, a normalized phase pdf is defined to overcome the limitation of a fixed 2π period of the phase pdf. The likelihood function constructed with MB normalized phase pdfs is able to remove the phase ambiguity since the likeli-hood function’s period is expanded by multiplying the nor-malized phase pdfs. The resulting likelihood function also has a sharper peak at the true phase point, which means a more accurate estimation result.
The W2UP method based on the novel normalized pdf is established to estimate the 2-D unwrapped phase. Both simulated and real MB data are utilized to demonstrate the effectiveness of the proposed method and its superior perfor-mance over the other two methods, I2P and QMG.
Similar to the general phase unwrapping methods, such as QMG, W2UP depends on the performance of filtered wrapped phase and is influenced by the filtering algorithm. Further research is needed for MB configuration to improve the performance of the W2UP method, which is important to both existing InSAR and future MB-InSAR systems.
REFERENCES
[1] R. Bamler and P. Hartl, ‘‘Synthetic aperture radar interferometry,’’Inverse Problems, vol. 14, no. 4, pp. R1–R54, Aug. 1998.
[2] D. Danudirdjo and A. Hirose, ‘‘InSAR image regularization and DEM error correction with fractal surface scattering model,’’IEEE Trans. Geosci. Remote Sens., vol. 53, no. 3, pp. 1427–1439, Mar. 2015.
[3] F. Baselice, G. Ferraioli, and V. Pascazio, ‘‘Markovian change detection of urban areas using very high resolution complex SAR images,’’IEEE Geosci. Remote Sens. Lett., vol. 11, no. 5, pp. 995–999, May 2014. [4] D. Yang and S. M. Buckley, ‘‘Estimating high-resolution atmospheric
phase screens from radar interferometry data,’’ IEEE Trans. Geosci. Remote Sens., vol. 49, no. 8, pp. 3117–3128, Aug. 2011.
[5] T. Strozzi, A. Luckman, T. Murray, U. Wegmüller, and C. L. Werner, ‘‘Glacier motion estimation using SAR offset-tracking procedures,’’IEEE Trans. Geosci. Remote Sens., vol. 40, no. 11, pp. 2384–2391, Nov. 2002. [6] A. Arnaubec, A. Roueff, P. C. Dubois-Fernandez, and P. Réfrégier,
‘‘Veg-etation height estimation precision with compact PolInSAR and homoge-neous random volume over ground model,’’IEEE Trans. Geosci. Remote Sens., vol. 52, no. 3, pp. 1879–1891, Mar. 2014.
[7] F. Gini and F. Lombardini, ‘‘Multibaseline cross-track SAR interferometry: A signal processing perspective,’’IEEE Aerosp. Electron. Syst. Mag., vol. 20, no. 8, pp. 71–93, Aug. 2005.
[8] H. Essen, T. Brehm, S. Boehmsdorff, and U. Stilla, ‘‘Multibaseline inter-ferometric SAR at millimeterwaves test of an algorithm on real data and a synthetic scene,’’Proc. SPIE, vol. 6746, p. 67460B, Sep. 2007. [9] C. Magnard, M. Frioud, D. Small, T. Brehm, H. Essen, and E. Meier,
‘‘Processing of MEMPHIS Ka-band multibaseline interferometric SAR data: From raw data to digital surface models,’’IEEE J. Sel. Topics Appl. Earth Observ. Remote Sens., vol. 7, no. 7, pp. 2927–2941, Jul. 2014. [10] Z. Yuan, Y. Deng, F. Li, R. Wang, G. Liu, and X. Han, ‘‘Multichannel
InSAR DEM reconstruction through improved closed-form robust chinese remainder theorem,’’IEEE Geosci. Remote Sens. Lett., vol. 10, no. 6, pp. 1314–1318, Nov. 2013.
[11] X. Li and X. G. Xia, ‘‘A fast robust Chinese remainder theorem based phase unwrapping algorithm,’’IEEE Signal Process. Lett., vol. 15, pp. 665–668, Nov. 2008.
[12] B. Xia, H. Xie, Q. Liu, and N. Xie, ‘‘Linear combination method for UWB vehicular radar pulse design,’’ inProc. 6th Int. Conf. Wireless Commun. Netw. Mobile Comput. (WiCOM), Chengdu, China, Sep. 2010, pp. 1–3.
[13] H. Liu, M. Xing, and Z. Bao, ‘‘A novel mixed-norm multibaseline phase-unwrapping algorithm based on linear programming,’’ IEEE Geosci. Remote Sens. Lett., vol. 12, no. 5, pp. 1086–1090, May 2015.
[14] F. Lombardini and H. D. Griffiths, ‘‘Optimum and suboptimum estima-tor performance for multibaseline InSAR,’’Frequenz, vol. 55, nos. 3–4, pp. 114–118, Apr. 2001.
[15] Z. Li, Z. Bao, and Z. Suo, ‘‘A joint image coregistration, phase noise suppression, and phase unwrapping method based on subspace projection for multibaseline InSAR systems,’’IEEE Trans. Geosci. Remote Sens., vol. 45, no. 3, pp. 584–591, Mar. 2007.
[16] A. Bouaraba, A. Belhadj-Aissa, D. Borghys, M. Acheroy, and D. Closson, ‘‘InSAR phase filtering via joint subspace projection method: Application in change detection,’’IEEE Geosci. Remote Sens. Lett., vol. 11, no. 10, pp. 1817–1820, Oct. 2014.
[17] A. Ferretti, C. Prati, and F. Rocca, ‘‘Multibaseline InSAR DEM reconstruc-tion: The wavelet approach,’’IEEE Trans. Geosci. Remote Sens., vol. 37, no. 2, pp. 705–715, Mar. 1999.
[18] M. G. Kim and H. D. Griffiths, ‘‘Phase unwrapping of multibaseline interferometry using Kalman filtering,’’ inProc. The 7th Int. Conf. Image Process. Appl., Manchester, U.K., vol. 2, 1999, pp. 813–817.
[19] X. Xianming and P. Yiming, ‘‘Multi-baseline phase unwrapping algorithm based on the unscented Kalman filter,’’IET Radar, Sonar Navigat., vol. 5, no. 3, pp. 296–304, 2011.
[20] G. Ferraiuolo, V. Pascazio, and G. Schirinzi, ‘‘Maximum a posteriori estimation of height profiles in InSAR imaging,’’IEEE Geosci. Remote Sens. Lett., vol. 1, no. 2, pp. 66–70, Apr. 2004.
[21] H. Liu, M. Xing, and Z. Bao, ‘‘A cluster-analysis-based noise-robust phase-unwrapping algorithm for multibaseline interferograms,’’ IEEE Trans. Geosci. Remote Sens., vol. 53, no. 1, pp. 494–504, Jan. 2015.
[22] Z. Jiang, J. Wang, Q. Song, and Z. Zhou, ‘‘A refined cluster-analysis-based multibaseline phase-unwrapping algorithm,’’IEEE Geosci. Remote Sens. Lett., vol. 14, no. 9, pp. 1565–1569, Sep. 2017.
[23] H. Ansari, F. De Zan, and R. Bamler, ‘‘Efficient phase estimation for interferogram stacks,’’IEEE Trans. Geosci. Remote Sens., vol. 56, no. 7, pp. 4109–4125, Jul. 2018.
[24] C. Magnard, M. Frioud, D. Small, T. Brehm, and E. Meier, ‘‘Analysis of a maximum likelihood phase estimation method for airborne multibaseline SAR interferometry,’’IEEE J. Sel. Topics Appl. Earth Observ. Remote Sens., vol. 9, no. 3, pp. 1072–1085, Mar. 2016.
[25] M. S. Seymour and I. G. Cumming, ‘‘Maximum likelihood estimation for SAR interferometry,’’ inProc. IEEE Geosci. Remote Sens. Symp., Pasadena, CA, USA, vol. 4, Aug. 1994, pp. 2272–2275.
[26] G. Corsini, M. Diani, F. Lombardini, and G. Pinelli, ‘‘Simulated analysis and optimization of a three-antenna airborne InSAR system for topo-graphic mapping,’’IEEE Trans. Geosci. Remote Sens., vol. 37, no. 5, pp. 2518–2529, Sep. 1999.
[27] A. J. Vigil, M. A. Belkerdid, and D. C. Malocha, ‘‘Application of classical cosine series window functions to full response signaling offset quadra-ture binary modulation systems,’’IEEE Trans. Commun., vol. 41, no. 1, pp. 11–15, Jan. 1993.
[28] G. Fornaroet al., ‘‘Maximum likelihood multi-baseline SAR interferom-etry,’’IEE Proc.-Radar Sonar Navigat., vol. 153, no. 3, pp. 279–288, Dec. 2006.
[29] L. C. Graham, ‘‘Synthetic interferometer radar for topographic mapping,’’ Proc. IEEE, vol. 62, no. 6, pp. 763–768, Jun. 1974.
[30] J.-S. Lee, K. W. Hoppel, S. A. Mango, and A. R. Miller, ‘‘Inten-sity and phase statistics of multilook polarimetric and interferomet-ric SAR imagery,’’IEEE Trans. Geosci. Remote Sens., vol. 32, no. 5, pp. 1017–1028, Sep. 1994.
[31] Y. You, H. Xu, and C. Li, ‘‘Unwrapped phase estimation via maximum likelihood principle for multi-baseline SAR interferometry,’’ inProc. IEEE Int. Geosci. Remote Sens. Symp. (IGARSS), Beijing, China, Jul. 2016, pp. 6449–6451.
[32] Q. Feng, H. Xu, Z. Wu, Y. You, W. Liu, and S. Ge, ‘‘Improved goldstein interferogram filter based on local fringe frequency estimation,’’Sensors, vol. 16, no. 11, p. 1976, 2016.
[33] S. M. Kay,Fundamentals of Statistical Signal Processing: Estimation Theory. Englewood Cliffs, NJ, USA: Prentice-Hall, 1993.
[34] R. Touzi and A. Lopes, ‘‘Statistics of the Stokes parameters and of the complex coherence parameters in one-look and multilook speckle fields,’’ IEEE Trans. Geosci. Remote Sens., vol. 34, no. 2, pp. 519–531, Mar. 1996. [35] M. Gelautz, H. Frick, J. Raggam, J. Burgstaller, and F. Lebcrl, ‘‘SAR image simulation and analysis of alpine terrain,’’ISPRS J. Photogramm. Remote Sens., vol. 53, pp. 17–38, Feb. 1998.
[36] G. Jian, ‘‘Reliability-map-guided phase unwrapping method,’’ IEEE Geosci. Remote Sens. Lett., vol. 13, no. 5, pp. 716–720, May 2016. [37] M. Schmitt, J. L. Schönberger, and U. Stilla, ‘‘Benefit of using multiple
baselines and multiple aspects for SAR interferometry of urban areas,’’ IEEE J. Sel. Topics Appl. Earth Observ. Remote Sens., vol. 7, no. 10, pp. 4107–4118, Oct. 2014.
HUAPING XUreceived the B.S. degree in elec-tronic engineering and the Ph.D. degree in com-munication and information system from Beihang University, Beijing, China, in 1998 and 2003, respectively. She is currently with the School of Electronic and Information Engineering, Bei-hang University. Her current research interests include SAR, SAR interferometry, differential SAR interferometry, and SAR image processing using advanced signal processing methods.
SHUO LIreceived the M.S. degree from the China University of Mining and Technology, in 2015. He is currently pursuing the Ph.D. degree with the School of Electronic and Information Engi-neering, Beihang University, China. His research interests include SAR image processing and SAR interferometry processing, especially registration and phase unwrapping.
YANAN YOU received the B.Sc. degree from the China University of Mining and Technology, in 2009, and the Ph.D. degree from the School of Electronic and Information Engineering, Beihang University, China, in 2015. He held a Postdoctoral position with Beihang University, from 2015 to 2017. Since 2017, he has been with the School of Information and Communication Engineering, Beijing University of Posts and Telecommunica-tions, China, as a Lecturer. His current research interests include SAR interferometry, deep learning image process, and big data technology.
AIFANG LIUreceived the M.S. and Ph.D. degrees from the Nanjing University of Science and Tech-nology, Nanjing, China, in 2001 and 2004, respec-tively. He is currently with the Nanjing Research Institute of Electronics Technology, and is mainly involved in the design of space-based radar sys-tem and synthetic aperture radar syssys-tems. His research direction is interferometric SAR image processing.
WEI LIU(S’01–M’04–SM’10) received the B.Sc. and L.L.B. degrees from Peking University, China, in 1996 and 1997, respectively, the M.Phil. degree from The University of Hong Kong, in 2001, and the Ph.D. degree from the School of Electronics and Computer Science, University of Southamp-ton, U.K., in 2003. He held a Postdoctoral position with Imperial College London. Since 2005, he has been with the Department of Electronic and Elec-trical Engineering, The University of Sheffield, U.K., as a Lecturer and then a Senior Lecturer. He has published more than 250 journal and conference papers, three book chapters, and a research monograph about wideband beamforming. His research interests include sensor array signal processing, blind signal processing, multirate signal processing, and their various applications and sensor array signal process-ing, blind signal processprocess-ing, multirate signal processprocess-ing, and their various applications in wireless communications, radar, sonar, satellite navigation, human–computer interface, and renewable energy exploitation.
Dr. Liu is a member of the Digital Signal Processing Technical Commit-tee of the IEEE Circuits and Systems Society and the Sensor Array and Multichannel Signal Processing Technical Committee of the IEEE Signal Processing Society (Vice Chair from 2019). He is currently an Associate Editor of the IEEE TRANSACTIONS ONSIGNALPROCESSINGand the IEEE ACCESS and an Editorial Board Member of theJournal Frontiers of Information Technology and Electronic Engineering.