A Framework in Determining Extended Warranty by Using Two
Dimensional Delay Time Model
Hairudin Abdul Majid
1, Lili Ayu Wulandhari
2, Azzurah A. Samah
3and Ang Jun Chin
4Department of Modeling and Industrial Computing, Faculty of Computer Science and Information System, Universiti Teknologi Malaysia, 81310 UTM Skudai, Johor Bahru, Malaysia
email:[email protected], [email protected], [email protected],
4
Keywords:Extended Warranty; Two Dimensional Warranty; Delay Time Modelling
Abstract. A framework for determining optimal period and cost in extended warranty is proposed in this paper. The optimal period and cost is derived from two-dimensional delay time model. Two-dimensional delay time model is governed by age and mileage. Age and mileage gives effect for the rate of defect arrival λ. The steps for obtaining the model to estimate the optimal period cost of extended warranty is presented. It starts from modeling the defect arrival rate, the impact of preventive maintenance toward the defect arrival rate; determine the delay time distribution, data analyzing and the last optimal cost and period estimation for extended warranty.
Introduction
An extended warranty is a service contract, which covers the maintenance and repair cost of a product to its user at a fixed cost during the life of the contract immediately following the expiration of base warranty [1] .
Some research in extended warranty had been presented by some researcher, Hollis [2] investigated whether the contractual exclusion of third-party extended warranties should be legally permissible, using a model incorporating consumer heterogeneity. The relation between extended warranties and product quality was explained by Lutz and Padmanabhan [3]. They analyzed the effect of extended warranty in a manufacturer’s warranty policy when warranties provide both insurance against product breakdown and give the manufacturer an incentive to produce high quality goods. Lam and Lam [4] described the methodology to give the optional for renewing or not renewing the warranty policy to the consumer. Different choice has different cost implication for both consumer and manufacturer. Jack and Murthy [5] explored the optimal strategies for manufacturer and consumer when the consumer has flexibility in choosing the time to take out an extended warranty and when to end it.
Customers usually purchase extended warranty for financial protection. Therefore, they need to know whether the extended warranty provides a better protection or not. On the manufacture side, poorly designed contracts lead to high service costs, high prices and customer dissatisfaction. And extended warranty providers need to determine the appropriate contract price and duration, which would balance the total cost and repair services. To address and related concern, the new extended warranty model with consider the defect arrival rate in finite time horizon is developed.
Delay Time Approach
The delay time model is measure of opportunity to detect a defect to prevent breakdown. This approach describes the time delay between an identifiable defect arrival and item failure, which is very useful for maintenance and inspection decision modeling of maintained or inspected plant. Suppose inspections are perfect, delay time modeling is based on the concept that there is an initial point u such that if the plant were inspected at u or afteru, then the plant defect could be detected preventing failure due to the defect. This period from u, to the failure time is calledh, the delay time. Refer Figure 1 which illustrates the delay time modeling concept.
All rights reserved. No part of contents of this paper may be reproduced or transmitted in any form or by any means without the written permission of TTP, www.ttp.net. (ID: 161.139.220.152-07/05/12,04:19:56)
The time between the first identification of defect (initial point) and actual failure time (failure point) vary depending on the deterioration rate of the component. In this study, a defect arising within a period [T0,W] has a delay time, h and f(h) is the probability density function of the delay time. A defect will be repaired as a breakdown repair if the fault arises in the period(T0,W). Otherwise, the defect will be repaired as inspection repair.
Summing up all possible values ofh, the probability of a defect arising as a breakdown can be calculated. Figure 1 demonstrates that it is possible to model the way defects arise, that is the rate of arrival of defect λ(u;m) and their associated delay timeh. The delay time concept can then be
captured from the relationship between inspection frequency and the number of plant defects or failures.
Fig.1. Delay time concept.
Framework of the Modeling
In particular, the research concerns on the study of extended warranty modeling by considering the model for a maintained product over a finite warranty time period from new. The framework of this research that outlines the stages of modeling activities to establish the extended warranty is given in Figure 2. The historical data from automobile industry “Malaysian Truck Berhad (MTB)” is used in deriving and analyzing every stage in the framework.
Fig.2. Framework of Research
Modeling the Rate of Defect Arrival λ(u;m)
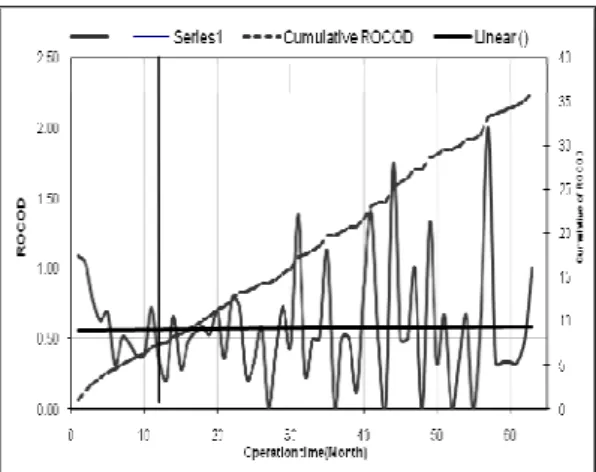
Age and mileage has meaningful impact on the arrival of defect. The defect arrival rate is modelled based on the time trend from complete historical data. These time trend are analyzed by using Laplace test trend that proposed by Crowder et al. [6] . In this paper, the Laplace approach is tested based on the rate of occurrence of defect (ROCOD). Figure 3 shows the graph of the ROCOD
: Initial P : Failure Point Breakdown repair Inspection repair u h W T
Model the rate of defect arrival )
; (um
λ in 2D warranty
Determining if the inspection component of the PM activity is perfect or imperfect
Estimate the Delay time distribution f(h)
Determine the optimal extended warranty (EW) period and cost
EW
W And E[CEW]
Analysis of data to establish the impact of )
;
Fig.3. Rate of Occurrence of Defect (ROCOD) Graph
Figure 3 shows in first twelve months the ROCOD graph represents a bath tub curve. In the first five months, the ROCOD is high and slowly decreases and later comes down about one defect arrival rate. By seeing the trend of ROCOD, the defect arrival rate is modeled by
) 1 ( ) ( u b au u + + =
λ
,where a steady state defect rate that is settling down and b is the starting or initial value.
Determining the inspection component of PM activity
Based on the PM activity the inspection that may be carried out is shown in Figure 4.
Fig.4. Model of PM activities
PM Service or inspection activity can have two main effects upon the rate of defect arrival as breakdown:
(i) PM action for a mechanical system especially in automobile industry can include greasing, cleaning, lubrication, adjustment and etc. It modifies the future and subsequent values ofλ(u,m). This is what we called “The defect Preventive Component” of PM. (ii)Identify defect in the system and thereby correct and prevent subsequent breakdown.
This is called “Inspection component” of the PM.
During a PM, the value of the subsequent ratio of defect arrivalλ(u,m), is expected to change, hopefully becoming less occur. Initial analysis of MTB historical data reveals that for most MTB product, the change in λ is very minor. However, this finding is not applied to the specific case
study as we would like to find more accurate defect arrival rate. The likelihood of an insignificant impact needs to be considered in the light of historical data from the case study i.e. ACM (Automobile Cooperative Malaysia) Bhd.
Two dimensional ) , (um λ λ= PM are inspection only PM’s are inspection + defect reduction Perfect inspection Non perfect inspection Perfect inspection Non perfect inspection
The positive impact of PM to λ(u;m) means that we have a reduction of defect arrival which leads to an extension of failure occurrence. Note that we have to think of what will happen if we increase or decrease the PM interval (what about the frequency of PM strategy)? Normally during the warranty period, all the PM costs are borne by the manufacturer because they provide free service PM. In addition, by using the model of impact defect arrival, we are able to identify the optimal warranty period and cost of preventive maintenance. As a result, the level of maintenance measurement (perfect or imperfect) play the important role at point of the PM or Inspection activities.
Estimating the Delay Time Distribution f(h)
The delay time estimation is thoroughly described in the fourth stage. In order to have better estimate of model parameters and to make useful predictions, the estimation of the delay time distribution can be made using two categories of data:-
(1) Subjective data, the useful information about delay time obtainable from engineers who repair the machine, and
(2) Objective data, which is from the history of breakdown times and the finding of inspections. Due to accessibility and availability of objective data at the case study, we therefore, choose the second option to estimate the delay time distribution. The objective data comprised of a complete historical data received from our case study. Baker and Wang [7] were the first to estimate delay time parameters using objective data. Their interest is restricted to a component tracking delay time model of independent components subject to inspection, where defects and failures are effectively repaired to replacement level.
The objective data were thoroughly processed to provide useful estimates. Precisely, the development likelihood formulation using MLE is applied to the objective data to get specific likelihood function. In particular, the derivation of likelihood function is based on historical data. The selection of the best model can be determined using the Akaike Information Criterion (AIC).
The Delay time distribution, estimated at this stage indicates the beneficial effect of inspections. Faults arising before time T that have not yet caused a failure are detected. As a result, failures are prevented. This indicates how failure rate reduces. Once the probability density functions, are known, it is then possible to carry out several useful calculations such as calculating the reliability of the machine or modelling specific costs as a function of the period between PM.
Analyzing the Data
At this stage, the focus is to analyze the data in order to establish the impact of usage and mileage )
;
(u m and PM upon warranty claim rate. Iskandar and Blischke [8] outlined several numbers of tools that are applicable in analyzing warranty claims and related data, as well as reliability models and warranty cost models.
The authors have also recommended the prediction of future warranty costs and comparison of different impacts of PM activities to establish the impact of usage and mileage (u;m) and PM. Both authors have also pointed out that the first step of the prediction process is the reliability analysis which is based on the claims data.
Note that the approaches suggested by Iskandar and Blischke [8] concerned on automobile warranty claims data which is closely related with our case study. Other similar work which discuss the use of warranty and other data in assessment of reliability, include work by [9], and [10].
Another approach in analysing the warranty claim data is The Kalbfleisch – Lawless Model also introduced by Iskandar and Blischke [8]. Precisely, this model considers analyzing data by investigating claims pattern, searching for trend, predicting future claims and estimating field reliability. The model further, uses 2D aggregate claims data (typically age and usage at time of claim) and is based on estimating age specific claims rates. The next step in applying Lawless model is the estimation of claims rates and standard errors of the estimators. Note that the model requires supplementary information on usage patterns, which is usually obtained from other sources, such as from consumer surveys or vehicle historical record. In general, the Kalbfleisch – LawlessModel provides information, of the pattern of claims.
Determining Optimal Extended Warranty (EW)
The final stage of our research framework concerns on the expected warranty cost. The expected cost to the provider of EW can be calculated using expected total cost model and considered the cost analysis of base warranty (BW). The cost of EW is related to:- (i) Product reliability and (ii)
Usage intensity.
Several parameters that were identified prior to the estimation of the expected total cost )]
( [C nT
E after the base warranty (BW) orT >W , are as listed below:
i) The expected number of failure or breakdownsE[Nf(0,T)],
ii) the expected number of defects identified and repaired at inspection E[Ni(T)], iii) the cost of a failure or breakdown Cf, cost of inspection a repair Ci,
iv) the delay time distribution f(h),
v) rate of defect arrival ( , )λ u m form in two dimensional modeling and
vi) The cost of PM C.
The following sentences provide elaboration of the identification process for each of the above mentioned parameters. The first and second parameters are calculated based on the derived formula. The third parameter is obtained directly from historical data of our case study. A best candidate based on defect arrival rate form and delay time distribution is selected out of six delay time models, for the fifth parameter. This is followed by calculation of defect arrival rate. Finally, the cost of PM is determined by using historical data.
As a result of the many factors involved and their complexity, modeling warranty costs is often difficult, requiring many simplifying assumptions and even so, challenging mathematical and numerical analysis. A detail discussion on various approaches to modeling the assumption, made in deriving the models and many types warranties is provided by [11].
Conclusion
In this paper we provide discussion on the stages involved in modeling failure data, based on two dimensional warranty approaches. Several other approaches highlighted by other researchers which were appropriate and applicable on automobile warranty claim data. In addition, the paper demonstrated the suitability of specific techniques to solve our research problems that deals with estimation and optimization of extended warranty period. The steps to determine an optimal warranty length policy i.e. two or three years is outlined in this paper. These steps are aimed to answer question such as what is the optimum warranty cost and optimal warranty period for the automobile case study.
Acknowledgment
The authors honorably appreciate Ministry of Science, Technology and Innovation (MOSTI) for the e-science grant and Research Management Center (RMC), Universiti Teknologi Malaysia (UTM) for the support in making this projects success
References
[1] Cheng J.S. and Bruce S.J. 1993. A Pricing Model for New Vehicle Extended Warranties. Casualty Actuarial Society Forum, Arlington, Virginia, Special Edition, 1-24
[2] Hollis A. 1999. Extended Warranties, Adverse Selection, and Aftermarkets. The Journal of Risk and Insurance, 66 3, 321-343
[3] Lutz N.A. and Padmanabhan V. 1998. Warranties, Extended Warranties,and Product Quality. International Journal of Industrial Organization, 6, 4, 463-493
[4] Lam y. and Lam P. K.W. 2001. Theory and Methodology An Extended Warranty Policy with Options Open to Consumer. European Journal of Operational Research, 131, 514 - 529
[5] Jack N. and Murthy D.N.P. 2007. A Flexible Extended Warranty and Related Optimal Strategies. Journal of The Operational Research Society, 58, 1612-1620
[6] Crowder M.J., K.A.C., Smit R.L and Sweeting T.J.,, 2000 Statistical Analysis of Reliability Data. Chapman and Hall
[7] Baker, R.D. and W. Wang. 1992. Estimating the Delay Time distribution of faults in repairable machinery from failure data. IMA Journal Of Mathematics Applied in Business & Industry, 3, 259-281
[8] Iskandar B.P. and Blischke W.R., 2003 In: W.R. Blischke and D.N.P. Murthy, Editors, Case studies in reliability and maintenance. New York: Wiley.
[9] Kalbfleisch, J.D. and J.F. Lawless. 1988. Estimation of reliability in field performence studies. Technometrics, 30, 4, 365-378
[10] Robinson, J.A. and G.C. McDonald. 1991. Issues Related to Field Reliability and Warranty Data. Data Quality Control : Theory and Pragmatics, Liepins & Uppiluri, 7, 69-89
[11] Blischke, W.R. and D.N.P. Murthy. 1994. Book : Warranty Cost Analysis. Two dimensional warranty policies, Chapter 8, 301-365
A Framework in Determining Extended Warranty by Using Two Dimensional Delay Time Model