Fuzzy Inference System Mamdani
to Predicting Conformational Epitope Location
Subtitle as needed (
Faizah
Dept. of Computer Science and Electronics, FMIPA UGM
M.R.Widyanto
Faculty of Computer Science,University of Indonesia [email protected]
Asmarinah
Dept. of Biology, Faculty of Medicine, University of Indonesia
Abstract
--
Predicting of conformational epitope is one of the major challenge in the field of vaccine design. Several methods have been developed for predicting conformational epitope but that methods have mostly been based on protein sequence and not very effective. This is the first attempt in this are to predict conformational epitope using fuzzy inference system mamdani. The proposed method based on amino acid properties and spatial information. The prediction results of the proposed system have high accuracy and its performance is comparable to existing tools.Index Term
--
Conformational epitope, fuzzy system, prediction, amino acidI. INTRODUCTION
In the past century, medical research has improved health and increased life expectancy largely because of success in preventing and treating infectious diseases. Vaccines in particular , offer protection against infectious diseases. With growing need of monoclonal antibodies and vaccines, conformational epitope prediction especially for virus has become more and more desirable. A lot of efforts have been put for this purpose, but primarily on linear epitopes. Bioinformatics provides the tools that help designers streamline vaccine laboratory work [1]. In genetic engineering technology in particular DNA (deoxyribonucleic acid) recombinant, researchers explored the amino acid sequence and DNA sequence of the epitope to create an effective vaccine design. Genetic information of this epitope will be assembled in the form of plasmids (with special construction) and then will be transformed into competent cells (eg bacteria, yeast) to then do culture (propagation). The hope is that competent cells will produce recombinant proteins from the epitope or antigen that has been constructed in the plasmid so that the protein can be purified and could be used in vaccination.
However, crystallographic studies have shown that most of epitopes in protein antigens are conformational [2], while only a few methods have been designed for this condition. For instance, the first server conformational epitope predictor (CEP) [3] is one of the fisrt methods created to identify the conformational epitope stretches, which adopt the Voronoi polyhedron of target protein to find its accessible syrface regions and categories them as Antigen Determinant (AD). Another method, Discotope [4], predicts epitopes with log-odds probability matrices of amino acid residues and structural surface information. And the most recent
predictors of conformational epitopes is PEPOP [5], which utilizes 3-D structural information to predict conformational epitopes and identify immunogenic peptodes [6] .
In this paper, we proposed a novel algorithm which employ fuzzy inference system mamdani based on amino acid
statistics, spatial information and contact map analysis to predict conformational epitopes in virus H5N1. It was different from previous approaches that employs expert system to identify location of conformational epitopes [7]. The following sections describe dataset, the architecture of this method, result and at the last section conclusion of this study.
II. DATASET
Fig. 1. Conformational Epitope
Virus H5N1 were extracted from PDB database dated December 2010. Only those with resolution better than 3.0 Å and protein antigen with more than 25 residues were retained. Redundant epitopes were removed by 60% similarity. Eighty two structures were finally retained as the training data which included 84 unique epitopes.
The testing data were collected from the training dataset of Discotope[3], databases of IEDB and SEPPA[1].
III. METHODS
The first step to identify epitope is find 5 amino acid properties, that included log-odds ratio, parker hidrophobility scale, surface accessibility ratio, volume residue and surface area. Table I show log-odds ratio and parker hidrophobility scale. Log-odds ratio will be use as propensity epitope scale. This is indicate that these amino acids have a great opportunity to be the epitope.
Table I
Parker hidrophobility scale and log-odds ratio
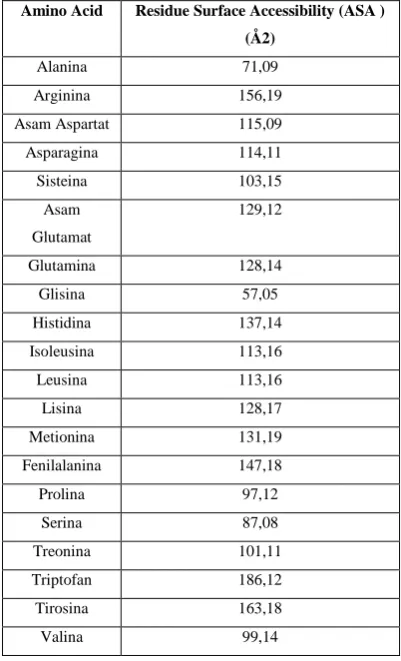
The value of a residue surface accessibility (ASA) calculated using the program Surface Racer ( Tsodikov ,Record, &Sergeev , 2002) . The value of accessibility surface is the surface area of residue that can be accessed from outside. This value will be divided by the maximum surface area of the residue to obtain the ratio of surface accessibility. Maximum surface area of each amino acid can be seen in Table II.
Table II
Residue Surface Accessibility Amino Acid
Amino Acid Residue Surface Accessibility (ASA ) (Å2)
Alanina 71,09
Arginina 156,19
Asam Aspartat 115,09
Asparagina 114,11
Sisteina 103,15
Asam
Glutamat
129,12
Glutamina 128,14
Glisina 57,05
Histidina 137,14
Isoleusina 113,16
Leusina 113,16
Lisina 128,17
Metionina 131,19
Fenilalanina 147,18
Prolina 97,12
Serina 87,08
Treonina 101,11
Triptofan 186,12
Tirosina 163,18
Valina 99,14
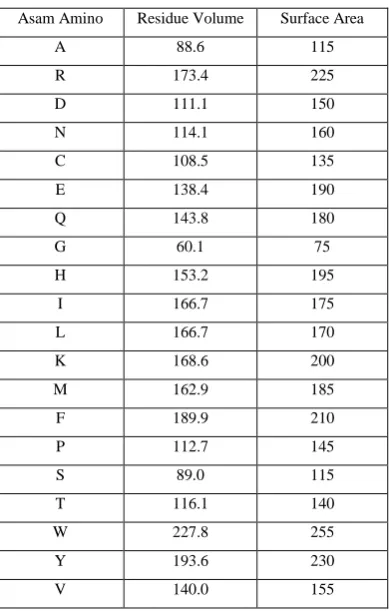
ASA value generally computed using the algorithm "ball rolling" (Shrake & Rupley, 1973) which was developed by Shrake and Rupley in 1973. This algorithm uses a ball that usually measuring 1.4 Å (the size of hydrogen atoms) to trace the surface of the molecule that wish calculated value will melt away. Meanwhile, the value of residue volume, surface area and the side chain of amino acid energy obtained from the amino acid index (Wikipedia) is shown in Table III.
Amino acid
Parker Log-odds ratios
D 2.46 0.691
E 1.86 0.346
N 1.64 1.242
S 1.5 0.145
Q 1.37 1.082
G 1.28 0.189
K 1.26 1.136
T 1.15 0.233
R 0.87 1.18
P 0.3 1.164
H 0.3 1.098
C 0.11 3.519
A 0.03 1.522
Y 0.78 0.03
V 1.27 1.474
M 1.41 0.273
I 2.45 0.713
F 2.78 1.147
L 2.87 1.836
Table III
Residue volume and surface area amino acid
Asam Amino Residue Volume Surface Area
A 88.6 115
R 173.4 225
D 111.1 150
N 114.1 160
C 108.5 135
E 138.4 190
Q 143.8 180
G 60.1 75
H 153.2 195
I 166.7 175
L 166.7 170
K 168.6 200
M 162.9 185
F 189.9 210
P 112.7 145
S 89.0 115
T 116.1 140
W 227.8 255
Y 193.6 230
V 140.0 155
Methods that proposed in this research show in Figure 2.
Fig. 2. Methods of research
FIS MAMDANI
Fuzzy inference system that used is the method of Mamdani . This system has five input parameters and one output parameter. Each input parameter has three membership functions of triangular-shaped function. Output parameter has a 3 pieces of triangle-shaped membership function.
Rules are established to produce the output value totaled 22 rules epitope. The rules are formulated based on observations of the relationship between input parameters to the values of epitope. The rules shown in Figure 3.
Some stages to get output value in FIS Mamsani consist of : fuzzification, decide rules, implication and
defuzzification. Domain for each variable input and variable output show in Table IV.
If PH low and LR low and ASA low and VR low and SA low then value
of epitope low
If PH low and LR medium and ASA low and VR low and SA low then
value of epitope low
If PH low and LR high and ASA low and VR low and SA low then value
of epitope low
If PH low and LR low and ASA medium and VR low and SA low then
value of epitope low
If PH low and LR low and ASA high and VR low and SA low then
value of epitope rendah
If PH low and LR low and ASA low and VR medium and SA low then
value of epitope low
If PH low and LR low and ASA low and VR high and SA low then
value of epitope low
If PH low and LR low and ASA low and VR low and SA medium then
value of epitope low
If PH low and LR low and ASA low and VR low and SA high then
value of epitope low
If PH medium and LR low and ASA low and VR low and SA high then
value of epitope medium
If PH medium and LR medium ASA low and VR low and SA high then
value of epitope medium
If PH medium and LR high and ASA low and VR low and SA high
then value of epitope medium
If PH medium and LR low and ASA medium and VR low and SA high
then value of epitope medium
If PH medium and LR low and ASA high and VR low and SA high then
value of epitope medium
If PH medium and LR low and ASA low and VR medium and SA high
then value of epitope medium
If PH medium and LR low and ASA low and VR high and SA high then
value of epitope medium
If PH medium and LR low and ASA low and VR low and SA medium
then value of epitope medium
If PH medium and LR low and ASA low and VR low and SA high then
value of epitope medium
If PH high and LR low and ASA low and VR low and SA low then
value of epitope medium
If PH high and LR high and ASA low and VR low and SA low then
value of epitope high
If PH high and LR medium and ASA medium and VR medium and SA
medium then value of epitope high
If PH high and LR high and ASA high and VR high and SA high
then value of epitope high
Fig. 3. Rules of FIS Mamdani
Note : PH = Parker Hodrophobility ; LR : Log Ratio ; ASA :
Accessibility Surface Area ; VR=Volume Residu ; SA=Surface
Area
Feature Extraction
Feature Extraction
Epitope Analysis Epitope
Database
Protein Strain
Conformational Epitope Fuzzy
Table IV
Domain and fuzzy representation of Variable input and variable output
Variable Domain Fuzzy Set
Representation
Input Parker_Hidrophobility
(PH)
[0.03,3] Low
[0, 1.325]
Medium
[1,2]
High
[1.8,3]
Log-odd ratio (LR) [0.03,
3.19]
Low
[0.1.6]
Medium
[0.4,3.6]
High
[2.4,4]
Accessibility Surface
Area (ASA)
[57.05,
186.12] Low
[0,80]
Medium
[20,180]
High
[120,200]
Volume Residue (VR) [60.1,
227.8]
Low
[0,100]
Medium
[25.66,225.7]
High
[150,250]
Surface Area (SA) [75,255] Low
[0,120]
Medium
[30,270]
High
[180,300]
Output Epitope Value [0,300] Low [0,120]
Medium
[30,270]
High [180, 300]
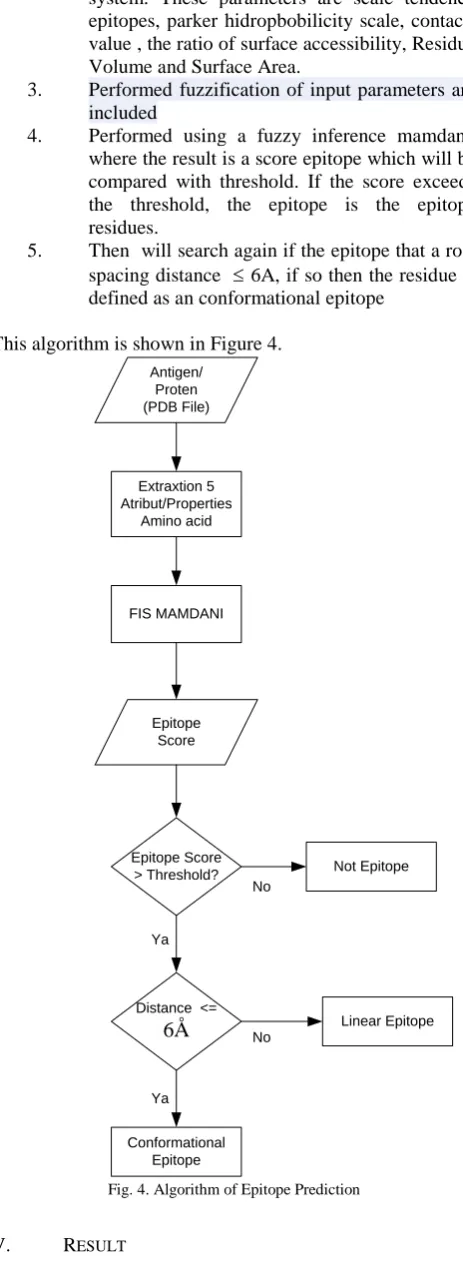
IV. ALGORITHM OF EPITOPE IDENTIFICATION
Epitope identification algorithms can be explained as follows:
1. Enter *.pdb files from the antigen / protein to be identified.
2. From the 3D structure of proteins will get five main attribute values in the 3D protein that used as input parameters in the fuzzy inference
system. These parameters are scale tendency epitopes, parker hidropbobilicity scale, contacts value , the ratio of surface accessibility, Residue Volume and Surface Area.
3. Performed fuzzification of input parameters are included
4. Performed using a fuzzy inference mamdani, where the result is a score epitope which will be compared with threshold. If the score exceeds the threshold, the epitope is the epitope residues.
5. Then will search again if the epitope that a row spacing distance 6A, if so then the residue is defined as an conformational epitope
This algorithm is shown in Figure 4.
Antigen/ Proten (PDB File)
Extraxtion 5 Atribut/Properties
Amino acid
FIS MAMDANI
Epitope Score
Epitope Score > Threshold?
Distance <=
6Å
Not Epitope
Conformational Epitope
Linear Epitope Ya
No
No
Ya
Fig. 4. Algorithm of Epitope Prediction
V. RESULT
a. EXPERIMENT SCENARIO
in the experiment. The scenario will be done in this experiment is shown in Figure 5.
Fig. 5. Experiment Scenario
This experimental scenario can be explained as follows: 1. Scenario 1 (Test CED)
In scenario 1, the results of the experiment by using fuzzy Mamdani will be compared with the data conformational epitopes that have been identified. The data was obtained
from CED antigen that can be accessed at
http://immunet.cn/ced/.
Antigens stored in the CED has been known as conformational epitope location so that it can be used to test the accuracy of the proposed method when used to test the same data.
2. Scenario 2 (Test Data H5N1)
In the 2nd scenario, data is data of H5N1 virus tested. The reason for using this data as test data because the results of this experiment will be very beneficial for the prevention of disease (in the form of vaccines) as well as drug design especially for influenza vaccine. In contrast to data obtained from CED that tended to vary, the data have some similarities with H5N1 virus in several variants, so it can be observed more easily.
For comparison, experimental results using fuzzy Mamdani will be compared with predicted results discotope server.
These predictors can be accessed at
http://www.cbs.dtu.dk/services/DiscoTope/. So far, among the predictors of tools that are available, the prediction accuracy discotope has the highest value. So that can be used as the accuracy assessment of the proposed method.
3. Scenario 3 (Test Data Homogeneous)
In Scenario 3, the tested data is data VDAC3. Different from the data in scenario 1 and 2 are varied, the data consist of 1 VDAC3 only *. PDB files. This data can be used as test data, because the length of sequence data is not very long and did not have many variants.
For comparison, experimental results using fuzzy Mamdani will be compared with results SEPPA discotope server and the server. SEPPA server can be accessed at http://lifecenter.sgst.cn/seppa/.
b. EXPERIMENT RESULT
Scenario 1
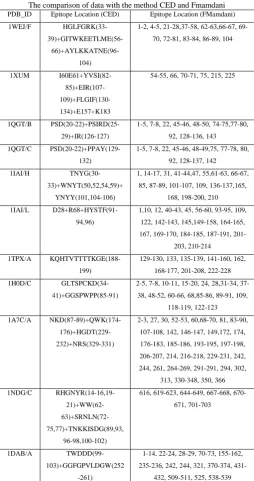
In Scenario 1, used 10 samples taken from the CED data for testing. The evaluation results are shown in Table V.
Table V
The comparison of data with the method CED and Fmamdani PDB_ID Epitope Location (CED) Epitope Location (FMamdani) 1WEJ/F
HGLFGRK(33- 39)+GITWKEETLME(56-
66)+AYLKKATNE(96-104)
1-2, 4-5, 21-28,37-58, 62-63,66-67, 69-70, 72-81, 83-84, 86-89, 104
1XUM I60E61+YVSI(82- 85)+EIR(107- 109)+FLGIF(130-134)+E157+K183
54-55, 66, 70-71, 75, 215, 225
1QGT/B PSD(20-22)+PSIRD(25-29)+IR(126-127)
1-5, 7-8, 22, 45-46, 48-50, 74-75,77-80, 92, 128-136, 143 1QGT/C
PSD(20-22)+PPAY(129-132)
1-5, 7-8, 22, 45-46, 48-49,75, 77-78, 80, 92, 128-137, 142 1IAI/H
TNYG(30-33)+WNYT(50,52,54,59)+ YNYY(101,104-106)
1, 14-17, 31, 41-44,47, 55,61-63, 66-67, 85, 87-89, 101-107, 109, 136-137,165,
168, 198-200, 210 1IAI/L
D28+R68+HYSTF(91-94,96)
1,10, 12, 40-43, 45, 56-60, 93-95, 109, 122, 142-143, 145,149-158, 164-165, 167, 169-170, 184-185, 187-191,
201-203, 210-214 1TPX/A
KQHTVTTTTKGE(188-199)
129-130, 133, 135-139, 141-160, 162, 168-177, 201-208, 222-228 1H0D/C
GLTSPCKD(34-41)+GGSPWPP(85-91)
2-5, 7-8, 10-11, 15-20, 24, 28,31-34, 37-38, 48-52, 60-66, 68,85-86, 89-91, 109,
118-119, 122-123 1A7C/A
NKD(87-89)+QWK(174- 176)+HGDT(229-232)+NRS(329-331)
2-3, 27, 30, 52-53, 60,68-70, 81, 83-90, 107-108, 142, 146-147, 149,172, 174, 176-183, 185-186, 193-195, 197-198, 206-207, 214, 216-218, 229-231, 242, 244, 261, 264-269, 291-291, 294, 302,
313, 330-348, 350, 366 1NDG/C
RHGNYR(14-16,19- 21)+WW(62- 63)+SRNLN(72-75,77)+TNKKISDG(89,93,
96-98,100-102)
616, 619-623, 644-649, 667-668, 670-671, 701-703
1DAB/A TWDDD(99-103)+GGFGPVLDGW(252
-261)
1-14, 22-24, 28-29, 70-73, 155-162, 235-236, 242, 244, 321, 370-374,
431-432, 509-511, 525, 538-539
Prediction Evaluation test results and accuracy for scenario 1 is shown in Table VI.
Scenario 1 Test CED
Scenario 2 Test Data
H5N1
Scenario 3 Test Data Homogen
Data CED
Data H5N1 (IRD)
Data VDAC3)
FMamdani
Discotope
Fmamdani
Discotope
Fmamdani SEPPA
Comparison Result
Comparison Result
Table VI
Prediction Evaluation Results Scenario 1 PDB_ID
/chain
TP F P
T N
F N
Sen(%) Spec(%) Ppv(%) Acc(%)
1WEJ/F 10 43 40 13 43.48% 48.19% 18.87% 47.17%
1XUM 0 8 20 2
16 0.00% 96.19% 0.00% 89.38%
1QGT/B 3 8 56 12 20.00% 87.50% 27.27% 74.68%
1QGT/C 1 22 11 2
49 2.00% 83.58% 4.35% 61.41%
1IAI/H 10 10 65 28 26.32% 86.67% 50.00% 66.37%
1IAI/L 7 44 10 7
27 20.59% 70.86% 13.73% 61.62%
1TPX/A 17 70 28 0
49 25.76% 80.00% 19.54% 71.39%
1H0D/C 5 16 49 25 16.67% 75.38% 23.81% 56.84%
1A7C/A 10 98 17 4
41 19.61% 63.97% 9.26% 56.97%
1NDG/C 7 67 19 7
49 12.50% 74.62% 9.46% 63.75%
1DAB/A 2 33 11 9
14 12.50% 78.29% 5.71% 72.02%
1WEJ/F 7 57 46 22 24.14% 44.66% 10.94% 40.15%
1XUM 3 10 14 0
46 6.12% 93.33% 23.08% 71.86%
1QGT/B 20 16 28 8
47 29.85% 94.74% 55.56% 83.02%
1QGT/C 14 26 14 6
35 28.57% 84.88% 35.00% 72.40%
1IAI/H 14 82 72 32 30.43% 46.75% 14.58% 43.00%
1IAI/L 2 89 10 3
21 8.70% 53.65% 2.20% 48.84%
1TPX/A 15 72 21 2
30 33.33% 74.65% 17.24% 69.00%
average 20.03% 74.33% 18.92% 63.88%
From the experimental results can be seen that the results of conformational epitope prediction on Mamdani fuzzy when compared with predicted results in CED on some data have a fairly high accuracy value, and some have almost reached 90%. Specificity average value was quite high, so it can be interpreted that the residue is not epitope that are recognized as epitope residues more than epitope residue that are recognized as the epitope .
Scenario 2
In the scenario 2 used primary data from H5N1 virus data. For the experiment will be tested some varies sample data. The sample data will be tested with discotope server and Fuzzy Mamdani (proposed method). The evaluation results are shown in Table VII.
Table VII
The prediction results with a fuzzy Mamdani Discotope
PDB_ID Discotope FMam
AAC14419.1 77-78, 108-110, 112-113, 115-116, 136,165-167, 186-188, 211-212, 214-217,237, 275, 294-295, 305-310, 320-321,331-333, 354, 363,380, 395-404, 419, 428-431
76-78, 112-113, 115-116, 136,165-167, 186-188, 211-212, 214-217, 275, 294-295, 320-321,331-333, 354, 363,380, 395-404, 419, 423-431
AAC34264.1 98-99, 129-131, 133-134, 136-137, 140, 157, 185-188, 206-209, 232-233, 235-239, 258, 296,
315-68-98, 129-131, 133-134, 136-137, 140, 157, 185-188, 206-209, 232-233, 235-239, 258, 296, 315-317, 326-331,
416-317, 326-331, 341-342, 352-354, 375, 384, 416-424,440,449-452
452
AAC40507.1 89, 92-93, 123-125, 127-128, 130-131, 151-152, 179-182, 201-203, 226-227, 229-232, 252, 290, 309-311, 320-325, 335-336, 346-348, 369, 378, 410-418, 434, 443-446
89-93, 123-128, 130-131, 151-152, 179-182, 201-203, 226-227, 320-325, 335-336, 346-348, 369, 378, 410-418, 434, 440-446
AAD16786.1 89, 92-93, 123-125, 127-128, 130-131, 134, 151, 179-182, 198, 200-203,226-227, 229-233, 252, 290, 309-310, 320-325, 335-336, 346-348, 369, 378, 410-418, 434, 441, 442-446
86-89, 92-93, 123-125, 127-128, 151-154, 229-233, 252, 290, 309-325, 335-336, 346-348, 369, 378, 410-418, 434, 441-446
AAD16787.1 92-93, 123-125, 127-128, 130-131, 134, 151, 179-182, 200-203, 226-227, 229-232, 252, 290, 309-311, 320-325, 335-336, 346-348, 369, 378, 410-418, 434, 443-446
134, 151, 179-182, 200-203, 226-227, 229-232, 252, 290, 309-311, 320-325, 335-336, 346-348, 369, 378, 410-418, 434, 443-446
AAD16788.1 90, 93-94,124-126, 128-129, 131-132, 152-153, 180-183, 201-204, 227-228,230-234, 291, 310-311, 321-326, 336-337, 347-349, 370, 379,411-420,435, 444-447
90, 93-94,124-126, 128-129, 131-132, 152-153, 180-183, 310-311, 321-326, 336-337, 347-349, 370, 379,411-420,435, 444-447
AAD16789.1 90, 93-94, 124-126, 128-129, 131-132, 152, 180-183, 201-204, 227-228,230-233, 253, 291, 310-312, 321-326, 336-337, 347-349, 370, 379, 411-419, 435,442, 444-447
90, 93-94, 124-126, 128-129, 131-132, 152, 180-183, 201-204, 227-228,230-233, 253, 291, 310-312, 321-326, 411-419, 435,442, 444-447
AAD16790.1 93-94, 124-126, 128-129, 131-132, 152, 180-183, 201-204, 227-228, 230-234, 291,310-312, 321-326, 336-337,347-349, 370, 379, 411-419, 435, 444-447
93-94, 124-126, 128-129, 131-132, 152, 180-183, 201-204, 336-337,347-349, 370, 379, 411-419, 435, 444-447
AAD16791.1 93-94, 124-126, 128-129, 131-132, 152, 180-183, 201-204, 227-228, 230-234, 253, 291, 310-312, 321-326, 336-337, 347-349, 370, 379, 411-419, 444-447
93-126, 128-129, 131-132, 152, 180-183, 201-204, 227-228, 230-234, 253, 291, 310-312, 321-326, 336-337, 347-349
AAD16792.1 94, 124-128, 132, 152, 180-182, 202-204, 228-232, 310-312, 322-326, 336, 348, 370,412-418, 444-447
2FK0/A 20-22, 33-34, 45-47,79, 81, 82, 103-104,122, 125-126, 128-129, 158-160, 162-173, 186-190, 192-193,197-199,222, 239-240, 242,263-264,289, 291-292, 298, 312, 323-324
20-34, 45-47,79, 81, 82, 103-104,122, 125-126, 128-129, 158-160, 162-173, 186-190, 192-193,197-199,222, 239-240, 242,263-264,289
2KAD/A/B/C/D 22-23, 45-46 20-23, 43-46 2KQT/A/B/C/D 22 22-24 3C9J/A/B/C/D 25 20-25 3F5T 21-22, 24-27, 30, 41, 45,
48-49,51, 66-82, 89-91, 94-97, 100-101, 117, 120,159, 161-162, 184, 194
21--27, 30, 41, 45, 48-49,51, 66-82, 89-91, 94-97, 100-101, 117, 120,159, 161-162, 184-194
Then the evaluation results and the prediction accuracy of test scenarios 2 are shown in Table VIII. In the evaluation of the 2nd scenario, sensitivity test and specificity done by comparing the predicted results with predicted results discotope as actual data.
Table VIII
Prediction Evaluation Results Fmamdani PDB_ID/chain T
P F P
TN F N
Sen(%) Spec(%) Ppv(%) Acc (%)
AAC14419.1 5 4
1 263 78 40.91% 99.62% 98.18% 80.05 % AAC34264.1 9
7
8 41 41 70.29% 83.67% 92.38% 73.80 % AAC40507.1 9
3
8 111 88 51.38% 93.28% 92.08% 68.00 % AAD16786.1 2
1 1 1
220 55 27.63% 95.24% 65.63% 78.50 % AAD16787.1 2
5
1 178 35 41.67% 99.44% 96.15% 84.94 % AAD16788.1 5
8
6 303 22 72.50% 98.06% 90.63% 92.80 % AAD16789.1 4
4 1 0
189 82 34.92% 94.97% 81.48% 71.69 % AAD16790.1 4
0
7 29 67 37.38% 80.56% 85.11% 48.25 % AAD16791.1 6
5 1 5
351 58 52.85% 95.90% 81.25% 85.07 % AAD16792.1 2
3
9 133 53 30.26% 93.66% 71.88% 71.56 % 2FK0/A 3
6
1 315 84 30.00% 99.68% 97.30% 80.50 % 2KAD/A/B/C/
D
4 4 37 0 100.00% 90.24% 50.00% 91.11 % 2KQT/A/B/C/
D
1 3 21 0 100.00% 87.50% 25.00% 88.00 % 3C9J/A/B/C/D 1 4 19 0 100.00% 82.61% 20.00% 83.33
%
3F5T 9
1
3 353 31 74.59% 99.16% 96.81% 92.89 % Average 57.63% 92.91% 76.26% 79.37
%
From the experimental results can be seen that when the proposed method is tested using data H5N1 variety, the evaluation results demonstrate the sensitifity are higher when compared with the data used in scenario 1. Average accuracy value was pretty high on some data, some even above 90%. But overall accuracy of the resulting value is not good enough. This may be due to a more varied data when compared to data in scenario 1. Data type being tested will greatly affect the outcome prediction. On testing H5N1
data, the average sensitivity value was above 50%, meaning that the number of epitope at residue which is also identified as an epitope has been quite a lot. On conformational epitope prediction, a value above 50% is good value, especially if have high accuracy value.
Scenario 3
In scenario 3 will be used homogeneous data, ie data that although there are several variants, but has the same sequence. Data is data VDAC3 tested. VDAC3 data shown in Figure 6.
>gi|5733504|gb|AAD49610.1| voltage-dependent anion channel VDAC3 [Homo sapiens]
MCNTPTYCDLGKAAKDVFNKGYGFGMVKIDLKTKSCSGVEFSTSGHAYTD TGKASGNLETKYKVCNYGLT FTQKWNTDNTLGTEISWENKLAEGLKLTLDTIFVPNTGKKSGKLKASYKR DCFSVGSNVDIDFSGPTIYG WAVLAFEGWLAGYQMSFDTAKSKLSQNNFALGYKAADFQLHTHVNDGTE FGGSIYQKVNEKIETSINLAW TAGSNNTRFGIAAKYMLDCRTSLSAKVNNASLIGLGYTQTLRP
Fig. 6. Data VDAC 3 Homo sapiens
Data VDAC 3 will be incorporated into SEPPA server, Discotope server and then viewed the location FMam for conformational epitope can be identified as shown in Table VIII.
Table VIII
Prediction Results VDAC 3 on SEPPA , disctotope and F Mamdani ID_PDB Epitope Location
(SEPPA)
Epitope Location (Discotope)
Epitope Location (FMam)
2JK4 1, 39-40, 54, 94-95, 109-111, 137-138, 162-165, 180, 200, 201-205, 2115-216, 218, 228-234, 253-254, 269, 271-272, 298-300
1-4,10, 38-42, 54-56,67-69, 78, 80-84, 94-95, 106-113, 136-137, 163-166,168-169, 170-180,190-191, 200-205,215-219, 231-232, 255-256, 269-274, 287-288
1-4,8-10, 38-42, 54-56,67-69, 78, 80-84, 94-95, 106-113, 136-137, 163-166,168-169, 205, 231-232, 255-256, 269-274, 287-288
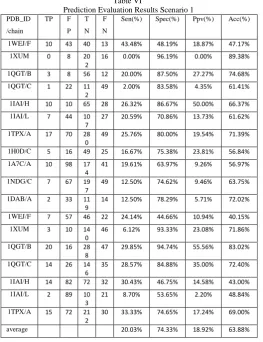
In scenario 3, the evaluation is done by comparing predictions with predicted results and the predicted results SEPPA discotope server. Evaluation of prediction results are shown in Table IX and Table X.
Table IX
The evaluation results predicted by comparison SEPPA PDB_ID /chain T P F P
TN F N
Sen(%) Spec(%) Ppv(%) Acc(%)
2JK4
40 18 102 10 80.00% 85.00% 68.97% 85.53
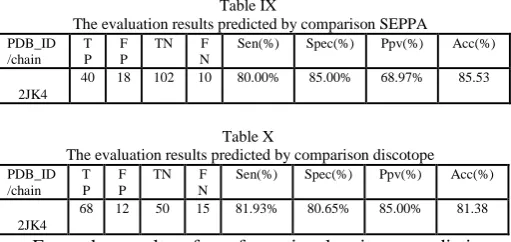
Table X
The evaluation results predicted by comparison discotope PDB_ID /chain T P F P
TN F N
Sen(%) Spec(%) Ppv(%) Acc(%)
2JK4
68 12 50 15 81.93% 80.65% 85.00% 81.38
tend have similarity, in the sense that nothing is exactly the same results if tested on the three methods.
Data VDAC3 very different from the H5N1 virus data or data of other proteins tested in scenario 1 and scenario 2. In vdac 3 although there are many variants, this protein only has 1 1d_pdb and for all variants sequencenya that same.
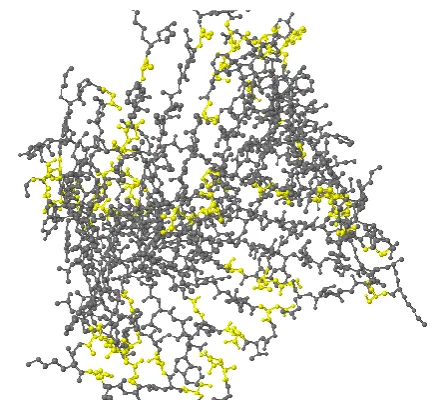
Based on the analysis of DNA Star, conformational epitope location ideally located in exon 5 -8 which began in id_residue to 108. Based on this, the prediction based on the results shown in Table 9 and Table 10, the results are approximately correct prediction is the prediction made by discotope and proposed system of Fuzzy Mamdani. Distribution locations of conformational epitope corresponding to star with DNA analysis in 3 methods shown in Figure 7. Visualitation of conformational epitope location show on Figure 8.
ID_PDB SEPPA Discotope Fuzzy Mamdani
2JK4 1, 39-40, 54, 94-95,
109-111, 137-138,
162-165, 180,
200, 201-205,
2115-216, 218,
228-234,
253-254, 269,
271-272, 298-300
1-4,10, 38-42,
54-56,67-69, 78,
80-84, 94-95,
106-113,
136-137,
163-166,168-169,
170-180,190-191,
200-205,215-219,
231-232,
255-256, 269-274,
287-288
1-4,8-10, 38-42,
54-56,67-69, 78,
80-84, 94-95,
106-113, 136-137,
163-166,168-169, 205,
231-232, 255-256,
269-274, 287-288
Fig. 7. Conformational Epitope Distribution Locations
Fig. 8. Visualiation of conformational epitope location on vdac3
VI. DISCUSSION AND CONCLUSSION
Developing of methods for epitope identification is needed because the epitope conformational choose a composition of 90% on a B-cell epitope. Studies that have been there before are still more focused on the identification of linear epitope which only has a composition of 10% in
B-cell epitope. Developing of these methods become more important because the identification of epitope location directly affects the success of vaccine development because the epitope is a major component in vaccine development. An accurate identification method is expected to accelerate the process of vaccine development and save significant development costs are extremely useful in Indonesia, which have a source of research data is very varied.
Stages of development methods by building on epitope prediction algorithm, development tool with fuzzy system mamdani and test the accuracy of the system with other existing methods. Tests performed on 3 scenarios, namely the accuracy test, test and test statistic homogenous data (protein data vdac3). Of the several steps that have been conducted in this study, several conclusions as follows:
1. Conformational epitope prediction algorithm developed is able to provide predictive results with high accuracy. This can be seen on the results of test scenario 1, where data of known as conformational epitope location on CED will be testing using Fmam tool developed. And the result is accurate.
2. The use of fuzzy systems, in this case the contact map-based fuzzy can provide problem solving solutions in the conformational epitope prediction methods have been developed previously not described in detail. The results obtained were quite good, as evidenced by the results of tests on the 3 scenarios that have been done.
3. The evaluation results using some of the data varied, ranging from epitope data, protein data, data VDAC3 virus and protein data indicate that the method is built better than other existing methods.
Some things may be possible for subsequent research are as follows :
1. Conformational Epitope prediction followed by determining the best location. This will greatly assist in the development of vaccines and the development of contraceptive alata vdac3 data.
2. Other fuzzy methods can be used to perform epitope prediction as fuzzy SVM, which probably would have different results.
REFERENCE
[1] Dong Xu., Keller, James M., Popesu, Mihail., Bondugula, RajKumar. (2008). Applications of Fuzzy Logic in Bioinformatics. London : Imperial College Press
[2] Jing Sun, Di Wu, Tianlei Xu, Xiaojing Wang, Xiaolian Xu, Lin Tao, Y. X. Li and Z. W. Cao. (May 22, 2009). SEPPA: a computational server for spatial epitope prediction of protein antigens. Nucl. Acids Res. (2009) 37 (suppl 2): W612-W616. doi: 10.1093/nar/gkp417
[3] Urmila Kulkarni-Kale, Shriram Bhosle and A. S. Kolaskar. (2005). CEP: a conformational epitope prediction server.
Oxford Journals Vulume 22, Web Server Issue, Pp. W168-W171
[4] P. H. Andersen, Morten Nielsen, Ole Lund,. (2006). Prediction of residues in discontinuous B-cell epitopesusing protein 3D structures. Protein Science 15:2558–2567.
Granier and Franck Molina. (January 30,2008). PEPOP: computational design of immunogenic peptides. BMC Bioinformatics 2008, 9:71doi:10.1186/1471-2105-9-71 [6] Joo Chua Tong., Tin Wee Tan., Ranganatha, Shoba.(2006,
September 14). Methods and protocols for prediction of immunogenic epitopes. Briefing In Informatics Vol. 8. No 2. 96-108.
[7] Faizah, Widyanto,M.R., Amaliah, Bilqis. (2010). Prediction of Conformational Epitope Using Expert System.Proceeding ICACSIS 2010
[8] Peters B, Bui HH, Sidney J, Weng Z, Loffredo JT, et al. (2005). A computational resource for the prediction of peptide binding to Indian rhesus macaque MHC class I molecules. Vaccine 23: 5212–5224.
[9] Savoie, C.J., Kamikawaji, N., Sasazuki, T. (1999) Use of BONSAI decision trees for the identification of potential MHC Class I peptide epitope motifs. Pacific Symposium on Biocomputing 4:182-189
[10] Lundegaard, Claus., Ole Lunda, Nielsen, Morten . (2003). Prediction of epitopes using neural network based methods. Journal of Immunological Methods.
[11] Wanga B, Huaa RH, Tiana Z-J, Chena N-S, Zhaoa F-R, Liua T-Q, Wanga Y-F, Tong G-Z. Identification of a virus-specific and conserved B-cell epitope on NS1 protein of Japanese encephalitis virus. Virus Res2009; 141:90–5.
[12] Zhao, Yingdong., Pinilla, Clemencia., Valmori, Danila ., Martin, Roland ., Simon, Richard. Application of support vector machines for T-cell epitopes prediction. Bioinformatics (2003) 19 (15): 1978-1984.
[13] Bhasin, M. and Raghava, G. P. S. (2004) Prediction of CTL epitopes using QM, SVM and ANN techniques. Vaccine 22:3195-204.