297
International Journal of Pharmaceutical Sciences and Drug Research
2018; 10(4): 297-305
Research Article
CODEN (USA): IJPSPP
ISSN: 0975-248X
Evaluation of the Release of Ascorbic Acid in Prolonged-Release Tablets by
in vitro Dissolution Tests
E. Damasceno Junior
*, J. M. F. DE Almeida, I. N. Silva, M. S. B. Silva, N. S. Fernandes
Universidade Federal do Rio Grande do Norte, Instituto de Química, Laboratório de Química Analítica e Meio Ambiente, Campus Universitário Lagoa Nova, CEP 59078-970, Natal-RN, Brasil
Copyright © 2018 E. Damasceno Junior et al. This is an open access article distributed under the terms of the Creative Commons Attribution-NonCommercial-ShareAlike 4.0 International License which allows others to remix, tweak, and build upon the work non-commercially, as long as the author is credited and the new creations are licensed under the identical terms.
ABSTRACT
In vitro dissolution tests are an extremely important tool in the development and quality control of drugs,
making it possible to evaluate the performance or efficiency of the pharmaceutical form in releasing the active substance through the amount dissolved in the dissolution medium when the product is subjected to specific equipment. In this sense, the main objective of the present study was to evaluate the release of ascorbic acid in prolonged release commercial vitamin C tablets by dissolution tests. Ascorbic acid and drugs of two different brands were characterized using the techniques of Molecular Absorption Spectroscopy in the Region of Infrared (IR), Thermogravimetry/Derived Thermogravimetry (TG/DTG) and Differential Scanning Calorimetry (DSC).
The in vitro dissolution tests were performed in a dissolver with a paddle apparatus at a temperature of 37°C (±
0.5°C), employing 900 mL of ultrapure water as the dissolution medium and a stirring speed of 50 rpm. The ascorbic acid dissolved in the aliquots of dissolution media obtained during the tests were quantified using the UV-Vis Molecular Absorption Spectroscopy technique. From the dissolution profiles, it was observed that the formulations of both brands promoted a prolonged release of ascorbic acid. The brand drug A dissolved about 67% of the active principle in about 360 minutes. The brand drug B, however, dissolved about 72% at the same dissolution time. Release kinetics was evaluated using kinetic models such as order zero, first order and Higuchi. The model that best fit the experimental data was that of Higuchi.
Keywords: Ascorbic acid. Prolonged release. Dissolution. Release kinetics.
DOI: 10.25004/IJPSDR.2018.100415 Int. J. Pharm. Sci. Drug Res. 2018; 10(4): 297-305
*Corresponding author: Mr. E. Damasceno Junior
Address: Universidade Federal do Rio Grande do Norte, Instituto de Química, Laboratório de Química Analítica e Meio Ambiente, Campus Universitário Lagoa Nova, CEP 59078-970, Natal-RN, Brasil
Tel.: +84991039601
E-mail : [email protected]
Relevant conflicts of interest/financial disclosures: The authors declare that the research was conducted in the absence of any commercial or financial relationships that could be construed as a potential conflict of interest.
Received: 01 June, 2018; Revised: 25 June, 2018; Accepted: 27 June, 2018; Published: 20 July, 2018
INTRODUCTION
Quality control within the pharmaceutical industry is an indispensable condition, in order to ensure the
irreparable damage to the health of the final consumer, and the quality of a drug is undoubtedly a moral attribute. Therefore, it is of paramount importance to carry out physical-chemical tests within the specifications and quality parameters established by the control and inspection bodies, in order to verify if the product is in compliance with the current legislation. [1-2]
Advances in the studies and development of new pharmaceutical technologies have made it possible to obtain the so-called long-term pharmaceutical forms (PFs) designed to release the drug gradually, keeping the plasma concentration at therapeutic levels for an extended period of time. Unlike conventional dosage forms, which are developed to release the drug rapidly after administration, the sustained release PFs allow for a more prolonged, more regular and more localized action, decreasing the occurrence of side effects without compromising pharmaceutical efficacy. In addition, these PFs increases patient adherence to treatment because it requires less frequent administrations. [3-4]
Ascorbic acid (AA) or, simply, vitamin C, is a water soluble and thermolabile vitamin, being an essential nutrient for human life. Although it is a substance of extreme importance to the body, this vitamin is not synthesized by humans, because they do not have the enzyme gulonolactone oxidase, involved in the biosynthesis of L-ascorbic acid from D-glucose. Therefore, in order to meet daily needs, it is necessary to eat foods rich in vitamin C or intake of medicines containing ascorbic acid as an active ingredient. [5-9]
To maintain saturation level of this substance in the body, it is recommended a daily dose of about 100 mg. However, AA in aqueous media undergoes oxidation rapidly under natural light, thermal and alkaline conditions, resulting in its decomposition and the loss of its biological activity. Therefore, the search for pharmaceutical forms that are capable of releasing ascorbic acid in a specific place and for an extended period of time is of paramount importance. [7]
In vitro dissolution tests have played a crucial role in the design and manufacture of pharmaceutical forms since by performing such assays it is possible to identify potential risks that may affect the bioavailability of a drug administered from a pharmaceutical form and release the active principle into a specific area of the body. In addition, the dissolution tests provide for the in vivo behavior of a medicinal product and establish the similarity between pharmaceutical forms containing the same active principle. [10-11]
The development of new pharmaceutical formulations with modified release profiles justifies the need to define specifications and alternative criteria for conducting in vitro dissolution tests, since they ensure the quality, safety and efficacy of the product. Therefore, regulatory agencies seek increasingly rigorous and defined calibration procedures with the
objective of maintaining the credibility and validity of the results obtained in these tests. [11-13] In this context,
the present work aims to investigate the release of ascorbic acid in prolonged release tablets by obtaining the dissolution profiles, by means of in vitro tests. Release kinetics was evaluated using kinetic models such as order zero, first order and Higuchi.
MATERIALS AND METHODS Characterization of the materials
Ascorbic acid (active principle) and commercial extended release tablets of two different brands (brand A and brand B) were characterized using the techniques of Molecular Absorption Spectroscopy in the Region of Infrared (IR), Thermogravimetry/ Derived Thermogravimetry (TG/DTG) and Differential Exploration Calorimetry (DSC). Samples of the medicaments were previously sprayed on a crystal agate with the aid of a pistil.
Molecular Absorption Spectroscopy in the Infrared Region (IR)
To obtain the Infrared spectra of the materials, a FTIR-8400S IRAFFINITY-1 spectrophotometer from SHIMADZU was used, in the following specifications: 32 scans; analysis range of 400-4000 cm-1; resolution of 4
cm-1 using KBr pellets.
Thermal Analysis (TG/DTG/DSC) and Determination of Purity of Ascorbic Acid
The materials were submitted to a thermal analysis (TG/DTG/DSC) by means of a thermogravimetric analyzer and simultaneous calorimeter SDTQ600 from TA INSTRUMENTS using the following analysis conditions: platinum crucible; nitrogen as purge gas (inert atmosphere); gas flow of 100 mL/min; heating rate of 10°C/min and final analysis temperature of 900°C. Determination of the purity of ascorbic acid in commercial tablets by the DSC technique was performed by the Van't Hoff method, applying the law of the depreciation of the melting point (Equation 1):
(Equation 1) Where TS is the sample temperature, T0 is the melt
temperature of the pure sample (100%), χ is the molar fraction of impurities, ΔH is the heat of fusion of the pure sample and F is the fraction of molten material (determined by of the extent of the partial areas of the experimental peak of fusion). [14]
Preparation of ascorbic acid solutions and obtaining calibration curves
A suitable amount of ascorbic acid (L-ascorbic acid PA, C6H8O6, 176.12 g/mol molar mass, brand SYNTH) was
RDC Nº 166 of the Brazilian National Agency of Sanitary Surveillance. [15]
The absorbance values were determined from the reading of each solution at wavelength of 265 nm in a molecular absorption spectrophotometer in the UV-Visible region UV-1800 model of SHIMADZU using quartz cells with 1 cm optical path. Calibration curves were obtained by comparing the concentrations and absorbances of standard ascorbic acid solutions. After obtaining the curves, some validation parameters of the methodology, more specifically the linearity, limit of detection (LD) and the limit of quantification (LQ) were evaluated. The procedure used during the evaluation is also described in the RDC number 166 of the Brazilian National Agency of Sanitary Surveillance. [15]
Dissolution profile and release kinetics
In vitro dissolution tests with the commercial extended release tablets were performed on a DT 80 ERWEKA dissolver, using 900 mL of ultrapure water as the dissolution medium at a temperature of 37°C (±0.5°C). The apparatus used during the tests was a paddle type (Type I apparatus) at a stirring speed of 50 rpm. To obtain the dissolution profile, three tablets of each brand were used. Aliquots were removed from the middle zone at 30, 60, 150, 180, 210, 240, 270, 300, 330 and 360 minutes, which were diluted and analyzed in a spectrophotometer (1800-Shimadzu) at wavelength 265 nm. For the evaluation of release kinetics, kinetic models were applied to the results of the dissolution profiles. The regression equations of the straight lines were obtained by means of the trend lines of the corresponding graphs, following the general formulas that are described in Table 1. The choice of the mathematical model that best fit the data was made from the analysis of the correlation coefficient linear (r2). The closer to 1 the numerical value of r2, the better
the sample fits the model.
RESULTS AND DISCUSSION
Molecular absorption spectroscopy in the infrared region(IR)
The absorption spectrum in the region of the IR for ascorbic acid (Figure 1) shows characteristic bands of axial deformation of OH bonds in the region between 3626 and 3216 cm-1. [16] The most acute bands
correspond to the "free" hydroxyl groups and occur in the range between 3650 and 3584 cm-1. The bands
appearing at lower frequencies, between 3550 and 3200 cm-1, are characteristic of hydroxyl groups that
participate in intermolecular hydrogen bonding interactions. [17]
The bands observed near to 3000 cm-1 correspond to the
stretching of CH bonds, occurring in the region of 3000 to 2840 cm-1. The bands presented at 1764 and 1675
cm-1 are, respectively, characteristics of the axial
deformation vibrations of C=O of the γ-lactone ring and of the double bond adjacent to the O group. The occurrence of γ-lactone molecule activation affects
carbonyl uptake and, due to the presence of the adjacent double bond, there is intense absorption in the region between 1685 and 1660 cm-1 corresponding to
the C=C group. [17]
Several absorption bands are observed in the region between 1500 and 1200 cm-1, characteristic of the
angular strain vibrations of CH in CH2 and CH
groups. The low frequency region, called the "fingerprint", is a very complex and difficult to interpret region. However, it is possible to correlate the position of some bands with specific vibrations in their study. The bands occurring in the spectrum range between 1277 and 1046 cm-1 correspond to the axial
deformation CO of alcohols. The angular deformation of OH is observed in the region between 990 and 1027 cm-1. [16]
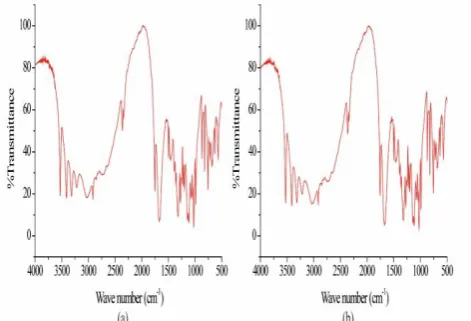
Figure 2 shows the absorption spectra in the infrared region obtained for the drug samples. The spectra of both medicaments show quite similar to the spectrum of the pure compound. The characteristic bands of axial deformation vibrations of OH bonds occurred in the same region between 3626 and 3216 cm-1. It was also
possible to identify the characteristic bands of the C=O axial deformation of the γ-lactone ring and the double bond adjacent to the O group, which occurred respectively at 1764 cm-1 and 1675 cm-1.
Fig. 1: Absorption spectrum in the IV region for ascorbic acid
Fig. 3: TG/DTG curve of the ascorbic acid
Fig. 4: TG/DTG curve of the drug: (A) Brand A and (B) Brand B
Fig. 5: DSC curve of the ascorbic acid
Fig. 6: DSC curve of the drug: (A) Brand A and (B) Brand B
Thermal Analysis(TG/DTG/DSC)
Thermal analysis has been widely applied in the pharmaceutical industry as a set of alternative techniques for the characterization and determination of drug quality parameters, producing fast and reproducible results. Thus, ascorbic acid and the drugs studied in this work were characterized by the techniques of thermogravimetry / thermogravimetry derived (TG / DTG) and differential scanning calorimetry (DSC) technique. [18-19]
Thermogravimetry/ Derivative Thermogravimetry (TG/DTG)
The chemical stability of a drug is an extremely important factor as it affects the safety and efficacy of the drug in which the substance is contained. Stability tests make an important role in assessing the quality of a medicament. Knowing the stability of a given pharmaceutical form helps to select the right packaging for the product, as well as providing the ideal storage conditions to extend its shelf life. [20]
Ascorbic acid and two brand commercial tablets were subjected to a thermal stability study by thermogravimetric analysis. Figure 3 shows the TG/DTG curve for ascorbic acid. With the aid of the DTG curve, the occurrence of two consecutive and/or simultaneous decomposition stages is observed. The first stage presents a loss of mass equivalent to 37%, which occurs approximately in the temperature range between 175°C and 260°C. The maximum rate of decomposition occurs at approximately 224°C. The second stage presents a mass loss equivalent to 33%, which occurs approximately in the temperature range between 265ºC and 500ºC. At the end of the analysis, the formation of a carbonized residue equivalent to 22% of the initial mass was observed.
Some studies found in the literature used thermogravimetry to evaluate the thermal stability of vitamin C. The tests were performed under nitrogen atmosphere and the results were similar to those obtained in this work. In an analogous way, it was possible to observe two events of mass loss. The compound began to decompose at approximately 191°C, with the maximum rate of decomposition occurring at 221°C. The second stage was observed in the temperature range between 251°C and 500°C, with an 11% formation of carbonized final residue. [21-22]
The TG/DTG curves of the commercial formulations (Figures 4 a and b) of both brands showed profiles similar to that observed in the ascorbic acid curve. However, the decomposition events were taken off at higher temperatures. Such displacements may indicate a certain type of interaction between ascorbic acid and the excipients contained in the formulation, since its thermal decomposition occurred in a manner unlike the pure compound. [21].
From the TG/DTG curve of the brand-name drug A (Figure 4 (a)) it is possible to observe two consecutive and/or simultaneous decomposition stages. The first stage presents a loss of mass equivalent to 50%, which occurs approximately in the temperature range between 165°C and 305°C. The maximum rate of decomposition occurs at approximately 205°C. The second stage presents a loss of mass equivalent to 24%, which occurs approximately in the temperature range between 305ºC and 600ºC. Figure 4 (b) illustrates the TG/DTG curve for the labeled drug B. Similarly, it is also possible to observe two consecutive and/or simultaneous decomposition stages. Both stages occurred in the same temperature ranges where mass losses occurred on the TG/DTG curve of the brand A product. The first and second stages present losses of masses equivalent to 52% and 23%, respectively. At the end of the analysis, the formation of a residue corresponding to 22% of the initial mass, probably composed of magnesium oxide (MgO) and silicon dioxide (SiO2), from the excipients composing said
formulations.
Differential Exploration Calorimetry (DSC)
Differential Scanning Calorimetry (DSC) is based on the measurement of the difference in the heat flux between a substance and a reference material as a function of a heating or cooling program. This technique is used for several purposes in the pharmaceutical industry, such as: thermal characterization, determination of drug purity, compatibility studies among the constituents of the formulation, among others. [18] Figure 5 shows the
DSC curve obtained for the ascorbic acid sample. As seen in Figure 5, the ascorbic acid DSC curve shows a single endothermic event, corresponding to the melt of the compound, which occurred in a temperature range between 185°C and 220°C and has a peak at approximately 192°C. Despite being well defined, this peak has not symmetry. This is due to the fact that decomposition of ascorbic acid starts soon after its initial melting temperature, as observed in the results of the thermogravimetric analysis described in the previous section.
DSC has been shown to be a simple and rapid alternative technique for determining the purity of organic substances, among them the drugs. One of the main advantages of using the DSC for this purpose is that it does not require a corresponding reference standard. The method evaluates the purity of the compound by analyzing the melting point of the analyte by applying the modified Van't Hoff equation. The Van't Hoff equation is based on the principle that the melt-soluble impurities, but are not solid, cause a kind of depreciation of the melting point of the pure compound. This depreciation is used to estimate sample purity. [14, 23]
Several studies can be found in the literature reporting the use of differential scanning calorimetry for the determination of drug purity. In one, the technique was used to determine the purity of an antihypertensive, the doxazosin mesylate, in commercial formulation. The results obtained with the Van't Hoff method were very close to the results obtained with the official method described in the British Pharmacopoeia, presenting a difference of only 0.03%. [14]
Thus, prolonged release tablets were characterized by the differential scanning calorimetry technique in order to evaluate the applicability of the Van't Hoff method in determining the purity of ascorbic acid in such formulations. Figures 6a and b present the DSC curves obtained for the analyzed drug samples.
Both curves showed a well defined endothermic peak corresponding to the ascorbic acid melting range, which occurred in the temperature range between approximately 155°C and 200°C. The melting point determined by the Van't Hoff method for the A-brand formulation and the B-brand formulation was respectively 189.61°C and 189.4°C. Both values are within the range of melting point described in the Brazilian Pharmacopoeia (189°C to 192°C). [24]
97.38% and 97.43% respectively. The values obtained were not satisfactory, since the minimum purity required for the method is 98%. [14] Compounds that
decompose soon after the initial melting temperature, such as ascorbic acid, generate results with greater uncertainty. The decomposition is indicated by the exothermic peak soon after the melting of the compound. In addition, the hydrophilic matrix which provides prolonged release in the tablets studied hydroxypropylmethylcellulose. [25]
Table 1: Mathematical models of release kinetics used in the dissolution profile evaluation of commercially available prolonged release tablets of ascorbic acid
Model Equation* Charts plots Zero Order Qt = Q0 + K0t Qt versus t
First Order ln Qt = ln Q0 + K1t log Qt versus t
Higuchi Qt = KH.t1/2 Qt versus t1/2
*Qt – amount of drug released in time t; Q0 – initial amount of drug in
solution; K0, K1, KH – constant characteristics of each model; t – time.
Table 2: Values of linear coefficient, coefficient of angular and linear correlation coefficient (R2)
Calibration Curve
Linear Coefficient
Angular
Coefficient r2 1 -0.00639 0.06020 0.99644
2 0.03088 0.05085 0.99679
3 0.04050 0.05172 0.99515
Table 3: Values obtained from the calibration curves for the calculation of the limit of detection (LD) and the limit of quantification (LQ).
IC Σ Detection (LD) Limit of Quantification (LQ) Limit of 0.054257 0.024766 1.5063 mg/L 4.5646 mg/L
Calibration curve and calculation of the detection limit (LD) and of the quantification limit (LC)
A prolonged release system requires tightly controlled dissolution kinetics, so that it can be quantitatively predicted with high accuracy. Therefore, it is necessary to develop accurate and efficient analytical methods capable of ensuring the quality of this type of drug. [11, 26] In order to quantify the ascorbic acid released from
the prolonged release tablets during the in vitro
dissolution tests, calibration curves were obtained from absorbance readings of standard solutions as described in the experimental methodology of that work. The Resolution of the Collegiate Board of Directors (RDC) number 166 of the Brazilian National Agency of Sanitary Surveillance establishes criteria for the evaluation of analytical methods. According to the Resolution, the linearity of a method must be demonstrated by its ability to obtain analytical responses directly proportional to the concentration of an analyte in a sample. Figure 7 shows the calibration curves obtained from the reading of standard solutions prepared independently, through the dilution of different solutions. By means of linear regression (least squares method), it was defined the best line that passes through the points obtained experimentally and, by means of specific equations, the values of the linear
coefficient and the angular coefficient of this line are calculated.
Fig. 7: Calibration curve for ascorbic acid solutions: (A) calibration curve 1, (B) calibration curve 2 and (C) calibration curve 3
Table 4: Percentages of ascorbic acid 500 mg dissolved (mean ± standard deviation) versus time (minutes) for prolonged release tablets of brands A and B.
Drug
Time (min)
30 60 150 180 210 240 270 300 330 360
% Dissolved (mean ± standard deviation)
Brand A 17.51 ± 0.41 25.50 ± 2.12 43.00 ± 0.92 47.45 ± 2.81 49.43 ± 1.54 52.40 ± 2.64 56.09 ± 0.71 57.80 ± 1.73 61.89 ± 0.54 67.20 ± 0.71
Brand B 17.75 ± 0.57 26.71 ± 1.74 44.83 ± 1.53 48.57 ± 3.51 50.72 ± 2.92 53.79 ± 1.12 61.30 ± 2.73 62.66 ± 1.86 66.37 ± 2.64 72.38 ± 1.52
Table 5: Coefficient of variation (CV) obtained from the values of the mean ± standard deviations of ascorbic acid percentages 500 mg dissolved as a function of time (minutes), for the prolonged release tablets of brands A and B
Drug
Time (min)
30 60 150 180 210 240 270 300 330 360
Coefficient of variation (%CV)*
Brand A 2.34 8.31 2.14 5.88 3.12 5.04 1.23 2.99 0.87 1.06
Brand B 3.21 6.51 3.41 7.23 5.76 2.10 4.45 2.97 3.98 2.10
*%CV – (standard deviation/mean) X 100.
Table 6: Linear correlation coefficients (R2) obtained from fitting to kinetic models of order zero, first order and higuchi.
Drug Zero order First order Higuchi Brand A 0.9609 0.8765 0.9930 Brand B 0.9762 0.8927 0.9946
Table 2 presents the values of the linear and angular coefficients, as well as the values of the linear correlation coefficients (r2), for the three calibration
curves previously presented.
It was observed from the data presented in the table above that the r2 of all the curves obtained has a value
close to unity. This result is in accordance with the current resolution, which specifies that the correlation coefficient must present values above 0.990. [15]
The limit of detection (LD) of a method must be demonstrated by obtaining the smallest amount of analyte present in a sample that can be detected. The quantification limit (LQ) corresponds to the smaller amount of the analyte in a sample that can be determined with acceptable accuracy and accuracy. [15]
The values of LD and LQ were calculated from the parameters obtained with the calibration curves by means of the following equations:
(Equation 2)
(Equation 3) Where IC corresponds to the inclination of the calibration curve (mean of the angular coefficients). The term σ can be obtained in three different ways. The most usual is from the standard deviation of the intercept with the Y axis (linear coefficient) of at least three calibration curves constructed.
Table 3 shows the values obtained from the calibration curves for the calculation of these parameters by means of the equations previously presented (Equation 2 and 3), besides the values of LD and LQ.
Dissolution profile
The ascorbic acid dissolved in the aliquots of the dissolution medium obtained during the tests was quantified through of the calibration curves described above. The medium values of the amount of ascorbic
acid dissolved at each time for tablets of both brands are shown in the table below (Table 4).
The parameters assumed in the dissolution tests (dissolution medium, stirring speed, etc.) followed the monograph of immediate release ascorbic acid tablets, in the Brazilian Pharmacopoeia there is not specific monograph for prolonged release tablets. As specified by the manufacturers, the tablets have an ascorbic acid dosage of 500 mg. Based on this fact; it can be seen from the results obtained with the dissolution tests that the brand A medicament dissolved about 67% of the active principle in about 360 minutes. Brand B medicament, however, dissolved about 72% at the same dissolution time.
Table 5 shows the coefficient of variation (CV) obtained from the mean values ± standard deviations of ascorbic acid 500 mg dissolved as a function of time (minutes), for the medicament evaluated in this study.
RDC N°. 310 of the Brazilian National Agency of Sanitary Surveillance (ANVISA) specifies that for the average dissolution use of the tablets in the dissolution test, the coefficient of variation for the first collection points (corresponding to 40% of the total points collected) may not exceed 20%. For the remaining points, a maximum of 10% is considered. [27] Therefore,
from the data observed in Table 5, the use of averages to obtain the dissolution profiles is viable statistically, since no coefficient of variation values exceeded the established limits. [2]
From the dissolution profiles (percent dissolved medicament curves as a function of time), shown in Figure 8, it can be said that the formulations of both brands promoted a prolonged release of their active principle, releasing ascorbic acid from gradually over an extended period of time. [28]
said, then, that the release of ascorbic acid from the studied solid dosage form occurs by diffusion through the matrix, regulated by this gelled layer. [28]
As described in the methodology of this work, some mathematical models were used to evaluate the release kinetics from the dissolution profiles obtained with the in vitro tests. Table 6 shows the values of the linear correlation coefficients (r2) acquired from the fit to
kinetic models of order zero, first order and Higuchi. In developing a prolonged release pharmaceutical form, it is intended that the drug contained therein be released constantly from the beginning to the end (same amount of drug per unit time). The ideal model to describe the release in this type of pharmaceutical form would be zero order. [12, 29] However, release
kinetics of this type cannot always be achieved, since in the case of matrix systems it is linked to some intrinsic characteristics of the polymer employed in the formulation, such as concentration, viscosity, stability and structure chemistry. [26, 30]
The best mechanism of release occurs with the model with the highest linear correlation coefficient (r2). From
the results described in the table above (Table 6), it can be observed that the model that best fit the experimental data was that of Higuchi. This model describes the release of the drug as a diffusion process based on Fick's law and thus can be used to describe the dissolution of drugs from various sustained release pharmaceutical forms such as water soluble drug matrix tablets. [12, 29]
From the results of the thermogravimetric analysis (TG/DTG), concludes that it was observed that ascorbic acid exhibits thermal stability up to 175°C. The TG/DTG curves of the commercial formulations exhibited profiles similar to that observed in the ascorbic acid curve. The DSC curve of ascorbic acid showed a single endothermic event, corresponding to the melting of the compound by approximately 192°C. Unlike the DSC curve of the pure compound, the DSC curves of the tablets exhibited a characteristic exothermic event of decomposition that occurred shortly after the event corresponding to the melt. The purity determined for the brand A and B medicament was 97.38% and 97.43%, respectively. Despite this, the melting point in both formulations was within the range established in the Brazilian Pharmacopoeia (189°C to 192°C).
Through of the results obtained with the IR technique, it was possible to identify the characteristic bands of bonds present in the ascorbic acid molecule. The spectra of the two medicaments are quite similar to that of the pure compound, having identical bands in the same regions.
The analytical validation parameters obtained shown that the Absorption Spectroscopy technique in the Ultraviolet-Visible Region (UV-Vis) is sufficient and efficient in the identification and quantification of ascorbic acid.
From the dissolution profiles, it was observed that the formulations of both brands promoted a prolonged release of ascorbic acid. Brand A medicament dissolved about 67% of the active ingredient in about 360 minutes. Brand B medicament, however, dissolved about 72% at the same dissolution time.
The kinetics model that best fit the experimental data was that of Higuchi. This result is intrinsically linked some characteristics of the polymer employed in the formulations, hydroxypropylmethylcellulose (HPMC), which promotes the release of the drug mainly by the diffusion mechanism.
ACKNOWLEDGMENTS
The authors acknowledgment: FAPERN, Finep, CNPq, Petrobrás, NUPLAM-UFRN e IQ-UFRN.
REFERENCES
1. Barboza FM, Vecchia DD, Pereira AV, Stulzer HK. Desenvolvimento e validação de um método analítico simples e rápido por espectroscopia UV para quantificação de aciclovir em matrizes hidrofílicas de liberação prolongada. Química Nova. 2010; 33:747-749.
2. Andrade DF, Carvalho JS, Freitas MB. Qualidade de cápsulas de fluoxetina disponibilizadas pelo Sistema Único de Saúde: estudo in vitro das condições do ensaio de dissolução. Revista de Ciências Farmacêuticas Básica e Aplicada. 2013; 34:199-205.
3. Nicoletti CD, Frasson APZ. Formas de liberação controlada: Revisão bibliográfica e avaliação comparativa da qualidade de comprimidos retard de Nifedipina 20mg de referência e similar. Revista Contexto e Saúde. 2006; 5:65-74.
4. Pezzini BR, Silva MAS, Ferraz HG. Formas farmacêuticas sólidas orais de liberação prolongada: sistemas monolíticos e multiparticulados. Revista Brasileira de Ciências Farmacêuticas. 2007; 43:491-502.
5. Azulay MM, Lacerda CAM, Perez MA, Filgueira AL, Cuzzr T. Vitamina C. Anais Brasileiros de Dermatologia. 2003; 78:265-274.
6. Fiorucci AR, Soares MHFB, Cavalheiro ETG. A importância da Vitamina C na sociedade através dos tempos. Química Nova na Escola. 2003; 17:3-7.
7. Gao X, Chen L, Xie J, Yin Y, Chang T, Duan Y, Jiang N. In vitro controlled release of vitamin C from Ca/Al layered double hydroxide drug delivery system. Materials Science and Engineering C. 2014; 39:56-60.
8. Ilie A, Ghiûulica C, Andronescu E, Cucuruz A, Ficai A. New composite materials based on alginate and hydroxyapatite as potential carriers for ascorbic acid. International Journal of Pharmaceutics. 2016; 510:501-507.
9. Santos DA, Lima KP, Março PH, Valderrama P. Vitamin C Determination by Ultraviolet Spectroscopy and Multiproduct Calibration. Journal of the Brazilian Chemical Society. 2016; 27:1912-1917.
10. Cascone S. Modeling and comparison of release profiles: Effect of the dissolution method. European Journal of Pharmaceutical Sciences. 2017; 106:352-361.
11. Santos Junior AF, Sá RR, Silva LOB, Magalhães HIF, Tarantino TB, Korn MGA. In vitro Monitoring of Macro and Microelements in Multimineral Preparations across Dissolution Profiles by Inductively Coupled Plasma Optical Emission Spectrometry (ICP OES). Journal of the Brazilian Chemical Society. 2017; 28:2163-2171.
12. Manadas R, Pina ME, Veiga F. A dissolução in vitro na previsão da absorção oral de fármacos em formas farmacêuticas de liberação modificada. Revista Brasileira de Ciências Farmacêuticas. 2002; 38:375-399.
perfil de dissolução de comprimidos de dipirona: equivalências farmacêutica entre medicamentos de referência, genéricos e similares. Revista Brasileira de Farmácia. 2009; 90:309-315.
14. ttia AK, Abdel-Moety MM, Abdel-Hamid SG. Thermal analysis study of antihypertensive drug doxazosin mesylate. Arabian Journal of Chemistry. 2017; 10:334-338.
15. Brasil. Resolução RDC n. 166, de 11 de julho de 2017. Agência Nacional de Vigilância Sanitária dispõe sobre a validação de métodos analíticos e dá outras providências. Diário Oficial da União, Brasília, n. 141, 25 jul. de 2017. Seção 1, pág. 87-89. 16. Panicker CY, Varghese HT, Philip D. FT-IR, FT-Raman and
SERS spectra of Vitamin C. Spectrochimica Acta Part A. 2006; 65:802–804.
17. Silverstein RM, Webster FX, Kiemle DJ. Spectrometric Identification of Organic Compounds. LTC, 2012.
18. Oliveira MA, Yoshida MI, Gomes ECL. Análise térmica aplicada a fármacos e formulações farmacêuticas na indústria farmacêutica. Química Nova. 2011; 34:1224-1230.
19. Silva ML, Souza SPMC, Araújo EG, Martinez-Huitle CA, Fernandes NS. Uso da termogravimetria na determinação do teor de ferro em comprimido contendo sulfato ferroso. Brazilian Journal of Thermal Analysis. 2016; 5:21-30. 20. Blessy M, Patel RD, Prajapati PN, Agrawa YK. Development
of forced degradation and stability indicating studies of drugs—A review. Journal of Pharmaceutical Analysis. 2014; 4:159-165.
21. Otero RLS, Galvão RKH, Araújo MCU, Cavalheiro ETG. Thermogravimetric determination of l-ascorbic acid in non-effervescent formulations using multiple linear regression with temperature selection by the successive projections algorithm. Thermochimica Acta. 2011; 526:200-204.
22. Juhász M, Kitahara Y, Takahashi S, Fujii T. Thermal stability of vitamin C: Thermogravimetric analysis and use of total ion
monitoring chromatograms. Journal of Pharmaceutical and Biomedical Analysis. 2012; 59:190-193.
23. Mathkar S, Kumar S, Bystol A, Olawoore K, Min D, Markovich R, Rustum A. The use of differential scanning calorimetry for the purity verification of pharmaceutical reference standards. Journal of Pharmaceutical and Biomedical Analysis. 2009; 49:627-631.
24. Brasil, Farmacopeia Brasileira, 5ª Ed., Agência Nacional de Vigilância Sanitária, Brasília, 2010.
25. Rowe RC, Sheskey PJ, Quinn ME. Handbook of Pharmaceutical Excipients. Pharmaceutical Press and American Pharmacists Association, 2009.
26. Iurian S, Turdean L, Tomuta I. Risk assessment and experimental design in the development of a prolonged release drug delivery system with paliperidone. Drug Design, Development and Therapy. 2017; 11:733-746. 27. Brasil. Resolução RDC n. 31, de 11 de agosto de 2010. Agência
Nacional de Vigilância Sanitária sobre a realização dos Estudos de Equivalência Farmacêutica e de Perfil de Dissolução Comparativo. Diário Oficial da União, Brasília, n. 154, 12ago. de 2010.
28. Aleksovski A, Aleksovska ES, Jasic M. Formulation and evaluation of ascorbic acid extended release hydrophyllic matrix tablets by using hydroxypropyl methylcellulose and polyethylene oxide as matrix forming polymers. Food in Health and Disease. 2012; 1:22-31.
29. Stulzer HK, Silva MAS. Desenvolvimento e avaliação de comprimidos de captopril de liberação prolongada. Latin American Journal of Pharmacy. 2007; 26:259-265.
30. Avadi MR, Hedayatzadeh M. Preparation and In vitro Characterization of Alprazolam Extended- Release Tablets Using HPMC 4000cps. Journal of Pharmaceutical and Health Sciences. 2016; 4:43-52.