R E S E A R C H A R T I C L E
Open Access
Improving sensitivity of machine learning
methods for automated case identification from
free-text electronic medical records
Zubair Afzal
*, Martijn J Schuemie, Jan C van Blijderveen, Elif F Sen, Miriam CJM Sturkenboom and Jan A Kors
Abstract
Background:Distinguishing cases from non-cases in free-text electronic medical records is an important initial step in observational epidemiological studies, but manual record validation is time-consuming and cumbersome. We compared different approaches to develop an automatic case identification system with high sensitivity to assist manual annotators.
Methods:We used four different machine-learning algorithms to build case identification systems for two data sets, one comprising hepatobiliary disease patients, the other acute renal failure patients. To improve the sensitivity of the systems, we varied the imbalance ratio between positive cases and negative cases using under- and over-sampling techniques, and applied cost-sensitive learning with various misclassification costs.
Results:For the hepatobiliary data set, we obtained a high sensitivity of 0.95 (on a par with manual annotators, as compared to 0.91 for a baseline classifier) with specificity 0.56. For the acute renal failure data set, sensitivity increased from 0.69 to 0.89, with specificity 0.59. Performance differences between the various machine-learning algorithms were not large. Classifiers performed best when trained on data sets with imbalance ratio below 10.
Conclusions:We were able to achieve high sensitivity with moderate specificity for automatic case identification on two data sets of electronic medical records. Such a high-sensitive case identification system can be used as a pre-filter to significantly reduce the burden of manual record validation.
Keywords:Class imbalance, Random sampling, Cost sensitive learning, Electronic health records, Improving sensitivity
Background
Electronic medical records (EMRs) are nowadays not only used for supporting the care process, but are often reused in observational epidemiological studies, e.g., to investigate the association between drugs and possible adverse events [1-3]. An important initial step in these studies is case identification, i.e., the identification of patients who have the event of interest. Case identifi-cation is particularly challenging when using EMRs be-cause data in the EMRs are not collected for this purpose [4]. Ideally, case identification is done on data that have been coded explicitly and correctly with a structured terminology such as the International Classifi-cation of Diseases version 9 (ICD-9). However, coding is
often not available. For example, in the Integrated Primary Care Information (IPCI) database [5] used in this study, almost 60% of the record lines comprise only narratives and no coded information. The non-coded part contains essential information, such as patient-reported symptoms, signs, or summaries of specialists’letters in narrative form. This information may be critical for identification of the events. The use of non-coded data (along with the coded data) in medical records has been shown to significantly improve the identification of cases [6]. However, the most commonly used method for case identification is using coded data only [7-11]. The current workflow of epi-demiological case identification typically consists of two steps: 1) issuing a broad query based on the case definition to select all potential cases from the database, and 2) manually reviewing the patient data returned by the query to distinguish true positive cases from true negative cases.
* Correspondence:[email protected]
Department of Medical Informatics, Erasmus Medical Center, P.O. Box 2040, Rotterdam 3000CA, Netherlands
Manual review of the patient data is an expensive and time-consuming task, which is becoming prohibitive with the increasing size of EMR databases. Based on our recorded data, on average about 30 patients are reviewed per hour by a trained annotator. For a data set of 20,000 patients, which is an average-sized data set in our studies, almost 650 hours (~90 days) will be required. To make case identification more efficient, manual procedures should be replaced by automated procedures as much as possible. Machine learning techniques can be employed to automatically learn case definitions from an example set of free-text EMRs. It is crucial that an automatic case identification system does not miss many positive cases, i.e., it should have a high sensitivity. This is par-ticularly important in incidence rate studies where the goal is to find the number of new cases in a population in a given time period. Any false-positive cases returned by the system would have to be filtered out manually, and thus the classifier should also have a good specificity, ef-fectively reducing the workload considerably as compared to a completely manual approach.
There is a substantial amount of literature on iden-tifying and extracting information from EMRs [12]. Machine-learning methods have been used for different classifications tasks based on electronic medical records such as identification of patients with various conditions [6,13-17], automatic coding [7,18,19], identifying candi-dates in need of therapy [20], identifying clinical entries of interest [21], and identifying smoking status [22,23]. Schuemie et al. [24] compared several machine-learning methods for identifying patients with liver disorder from free-text medical records. These methods are usually not optimized for sensitivity but for accuracy. The topic of automatic case identification with high sensitivity has not yet been addressed.
Typically, the proportion of positive and negative cases in a data set is not equal (usually there are many more negative cases than positive cases). This imbalance af-fects the learning process [25]. We use two approaches to deal with the imbalance problem: sampling methods and cost-sensitive learning. Sampling methods change the number of positive or negative cases in the data set to balance their proportions improving classifiers accur-acy. This is achieved by removing the majority class ex-amples, known as under-sampling, or by adding to the minority class examples, known as over-sampling. Both under and over-sampling methods have their drawbacks as well. Under-sampling can remove some important ex-amples from the dataset whereas over-sampling can lead to overfitting [26]. Over- and under-sampling methods, with several variations, have been successfully used to deal with imbalanced data sets [27-32]. It has also been shown that a simple random sampling method can per-form equally well as some of the more sophisticated
methods [33]. We propose a modified random sampling strategy to boost sensitivity. Cost-sensitive learning tackles the imbalance problem by changing the misclassification costs [34-37]. Cost-sensitive learning is shown to perform better than sampling methods in some application do-mains [38-40].
In this article, we focus on improving the sensitivity of machine-learning methods for case identification in epi-demiological studies. We do this by dealing with the bal-ance of positive and negative cases in the data set, which in our case consists of all potential patients returned by the broad query. A highly sensitive classifier with accept-able specificity can be used as a pre-filter in the second step of the epidemiology case identification workflow to distinguish positive cases and negative cases. The experi-ments are done on two epidemiological data sets using four machine-learning algorithms.
Methods
Data sets
Data used in this study were taken from the IPCI data-base [5]. The IPCI datadata-base is a longitudinal collection of EMRs from Dutch general practitioners containing medical notes (symptoms, physical examination, assess-ments, and diagnoses), prescriptions and indications for therapy, referrals, hospitalizations, and laboratory results of more than 1 million patients throughout the Netherlands. A patient record consists of one or more entries, where each entry pertains to a patient visit or a letter from a specialist.
We used two data sets, one with hepatobiliary disease patients and one with acute renal failure patients. These data sets are very different from each other and are taken from real-life drug-safety studies in which it is im-portant to investigate the incidence and prevalence of the outcomes in the general population. This type of studies serves as a good example for building highly sen-sitive automatic case identification algorithm because they require that all the cases in the population are iden-tified. To construct the data sets, first a broad query was issued to the IPCI database. The aim of the query was to retrieve all potential cases according to the case definition. The query included any words, misspellings, or part of the words relevant to the case definition. The sensitivity of the broad query is very high but its specificity is usually low, and therefore many of the cases retrieved by the query are likely to be negative cases.
randomly selected entries were manually labeled as ei-ther positive or negative cases. Because the broad query might have returned an entry with circumstantial evi-dence but have missed the entry with the actual evievi-dence (e.g., because of textual variation in keywords), the entire medical record (all entries) of the patients in the random sample was considered to decide on a label, not only the entry returned by the broad query. A patient was labeled as a positive case if evidence for the event was found in any of the patient’s entries. The patient was labeled as a negative case if there was no proof of the event in any of the patient’s entries.
Each random sample was manually labeled by one medical doctor. These labels are used as a gold standard. To verify the quality of the labels and to calculate inter-observer agreement, another medical doctor then labeled a small random set (n=100) from each random sample. We used Cohen’s Kappa to calculate the agreement be-tween both annotators [41].
Hepatobiliary disease was defined as either gall stones (with or without surgery), cholecystitis, hepatotoxicity, or general hepatological cases such as hepatitis or liver cirrhosis. The broad query (see the Appendix for the query definition) retrieved 53,385 entries, of which 1,000 were randomly selected for manual labeling. These 1,000 entries pertained to 973 unique patients, of whom 656 were labeled as positive cases of hepatobiliary disease and 317 were labeled as negative cases.
Acute renal failure was defined as a diagnosis of (sub) acute kidney failure/injury/insufficiency by a specialist and hospitalization, or renal replacement therapy followed by acute onset of sepsis, operation, shock, reanimation, tumorlysissyndrome, or rhabdomyolysis. The broad query for acute renal failure patients (see Appendix) retrieved 9,986 entries, pertaining to 3,988 patients who were all manually labeled. Only 237 patients were labeled as posi-tive cases of acute renal failure and 3,751 patients were la-beled as negative cases. Of these latter, many had chronic renal failure (an explanation for the high number of chronic renal failure patients is provided in the Appendix along with the broad query).
The labeled set included one entry per patient. For positive cases, we selected the entry with the evidence or, if multiple such entries were available, one was ran-domly chosen. For negative cases, we ranran-domly selected an entry. The selected entries will be called‘seen entries’ from here onwards.
Preprocessing
Since a medical record may contain differential diag-nosis information it is important to distinguish be-tween positive statements made by the physician, and negations and perhaps speculations. In order to re-move negated and speculative assertions we use an
assertion filter, similar to others [42]. We identify three sets of keywords:
– Speculation keywords: Words indicating a
speculation by the physician (e.g.’might’,’probable’, or’suspected’)
– Negation keywords: Words indicating a negation (e.g.’no’,’not’, or’without’)
– Alternatives keywords: Words indicating potential alternatives (e.g.’versus’, or’or’)
Note that the medical records and these keywords are in Dutch. Any words appearing between negation or specula-tion keywords and the end of a sentence (demarked by a punctuation mark) were removed from the record. Simi-larly, all sentences containing an alternatives keyword were completely removed. The remaining text was converted to lower case and split into individual words.
After the removal of negation, speculation, and alter-native assertions, all remaining individual words in an entry were treated as features (bag-of-words representa-tion). The advantage of using the assertion filter and bag-of-words feature representation on Dutch EMRs is presented in [24]. Since the total number of features was still very high even after preprocessing, which makes machine learning computationally expensive and may also hamper the predictive accuracy of the classifier, we performed chi-square feature selection [43]. For each feature, we compared the feature distribution of the cases and non-cases by a chi-square test. If the test was significant, the feature was selected for further process-ing. A p-value of less than 0.05 was used as feature se-lection threshold. Feature sese-lection was done as a preprocessing step in each of the cross-validation train-ing folds of the data sets.
Set expansion
Adding more cases (i.e. patients) in the data set is ex-pensive because they have to be first manually validated and labeled. We used ‘set expansion’ as an alternative approach to expand the training and test set. Each la-beled set consisted of positive and negative cases, one (seen) entry per case. The fact that each case typically has multiple entries, allowed us to expand the labeled sets. For a negative case, the annotator has extensively reviewed all of the entries in the patient record and found no convincing positive evidence. Although only one random entry (seen entry) was selected for a nega-tive case, we can however use all other entries as add-itional negative examples for the machine-learning because none of them contained any convincing positive evidence. We call these additional negative examples the
(seen entry). For all other entries of a positive case, it is uncertain whether these entries also contain convincing positive evidence. These entries therefore cannot be used as positive examples for the machine-learning. We call these uncertain entries of positive cases the ‘unseen entries’.
Training and testing
To train and test our classifiers, we used 5-fold cross-validation. Cross validation was done at the patient level (subject-level cross-validation [44]), i.e., the data set was randomly divided in five equally sized subsets of cases. In five cross-validation runs, each time the entries pertaining to four subsets of cases were used as a train-ing set and the entries of the remaintrain-ing subset were used for testing. For training, we used two sets of entries: a set without set expansion (i.e., with only the seen en-tries) and a set with set expansion (i.e., with seen and implicit entries). For testing the classifiers, however, we used all entries of the patients in the test fold. The num-bers of seen, implicit and unseen entries per data set are summarized in Table 1.
All entries of the patients in the test fold were used to simulate a real-life situation where we do not know the labels of the entries pertaining to the patients returned by the broad query. We chose not to limit ourselves to the entries returned by the broad query as they may not always contain the entry with evidence (see above), but always included all entries available for each case in the test fold.
We used sensitivity and specificity measures to evalu-ate the performance of the classifiers. Sensitivity is de-fined as the true-positive recognition rate: number of true positives / (number of true positives + number of false negatives), whereas specificity is defined as the true-negative recognition rate: number of true true-negatives / (number of true negatives + number of false positives).
Improving classifiers sensitivity
The imbalance of positive and negative examples in the training set effects the classifiers performance [23]. We used sampling and cost-sensitive learning approaches to
improve the sensitivity of our classifiers by dealing with this imbalance.
Sampling
Given an initially imbalanced data set, our proposed ran-dom sampling strategy focuses on increasing the propor-tion of positive case entries in the data set. Because the standard classifiers are biased towards the majority class [45-47], this improvement will potentially help the learn-ing algorithms to generate models that better predict the positive cases, and thus improve sensitivity. In under-sampling, we only removed entries of negative cases re-gardless of their being in the majority or minority. For the data set with set expansion, under-sampling was done only on the implicit entries (cf. Table 1), varying from 10% under-sampling to 100% (all implicit entries removed). Thus, each negative case was left with at least one entry (the seen entry). For the data set without set expansion, under-sampling was done on the seen entries, effectively removing negative cases from the data set.
In our random over-sampling approach, we duplicated the entries of positive cases, regardless of their being in the majority or minority. The number of entry duplica-tions was varied between 1 and 10.
Cost-sensitive learning
Cost-sensitive learning methods can be categorized into two categories, direct methods and meta-learning or wrapper methods [34]. In direct cost-sensitive learning, the learning algorithm takes misclassification costs into account. These types of learning algorithms are called cost-sensitive algorithms. In meta-learning, any learning algorithm, including cost-insensitive algorithms, is made cost-sensitive without actually modifying the algorithm.
We chose to use MetaCost [48], a meta-learning ap-proach, in its Weka implementation [49]. Given a learn-ing algorithm and a cost matrix, MetaCost generates multiple bootstrap samples of the training data, each of which is used to train a classifier. The classifiers are then combined through a majority-voting scheme to deter-mine the probability of each example belonging to each class. The original training examples in the data set are then relabeled based on a conditional risk function and the cost matrix [48]. The relabeled training data are then used to create a final classifier.
The cost of misclassification is often not known and there are no standard guidelines available for setting up the cost matrix. Some researchers have used the ratio of positives to negatives as the misclassification cost (20) but this has been questioned by others (21). The values in the cost matrix are also dependent on the base classi-fier used. Some classiclassi-fiers require a small misclassifica-tion cost while others require a large misclassificamisclassifica-tion cost to achieve the same result. In our experiments, we
Table 1 Total number of subjects and corresponding entries in the hepatobiliary disease and acute renal failure data sets
Hepatobiliary disease Acute renal failure
Positive cases 656 237
Seen entries 656 237
Unseen entries 61,179 58,022
Negative cases 317 3,751
Seen entries 317 3,751
varied the misclassification costs from 1 to 1000 in 9 steps.
Classifiers
We selected the four top-performing algorithms from a previous study [24], in which many well-known ma-chine-learning algorithms were evaluated for the classifi-cation of EMRs in a similar experimental setting.
– C4.5 [50], a well-known decision-tree learner. Weka’s implementation of C4.5 (called J48) is used in the experiments.
– Support Vector Machines (SVM) [46], a commonly used algorithm that can handle large data sets. Weka’s implementation of libsvm [51] is used in the experiments. Because we had a large number of binary features, we used a linear kernel [52] and the soft margin parametercwas set to 4.
– RIPPER [53], a decision-rule learner. RIPPER induces an ordered set of rules by combining covering with a reduced error pruning strategy. Weka’s implementation of RIPPER (called JRip) is used in the experiments.
– MyC, a locally developed decision-tree learner. MyC builds a tree by iteratively splitting the data based on
the chi-square test, similar to the ID3 algorithm [54]. MyC is simple and very fast.
We did an error analysis to understand why some of the positive cases were not identified by the classifiers. Errors were divided in the following four categories: dence keywords not picked up by the algorithm, evi-dence keyword picked up by the algorithm but removed from the patient entry by the negation/speculation filter, different spelling variations of the evidence keywords in the learned model and in the evidence entry, and patient wrongly labeled as a positive case by the annotator.
Results
There was a good to excellent agreement between the two annotators (kappa scores of 0.74 (95% CI 0.59-0.89) and 0.90 (95% CI 0.83-0.97) for the hepatobiliary and acute renal failure data sets, respectively). The chi-square fea-ture selection decreased the number of feafea-tures in both data sets by about a factor of 10, without affecting the per-formance of the classifiers but greatly reducing their train-ing time. For example, RIPPER ustrain-ing MetaCost took about five days to build one classifier for the acute renal failure set, which after feature selection took less than one day.
Table 2 Sensitivity and specificity results of various classifiers trained on the hepatobiliary and the acute renal failure data sets, with and without set expansion
Set Imbalance SVM C4.5 MyC RIPPER
Data set expansion ratio Sens Spec Sens Spec Sens Spec Sens Spec
Hepatobiliary No 0.5 0.99 0.03 0.99 0.03 0.99 0.07 0.99 0.04
Yes 42 0.89 0.77 0.90 0.79 0.92 0.69 0.91 0.71
Acute renal failure No 16 0.62 0.92 0.69 0.88 0.69 0.90 0.71 0.89
Yes 1363 0.39 0.98 - - 0.45 0.99 0.41 0.98
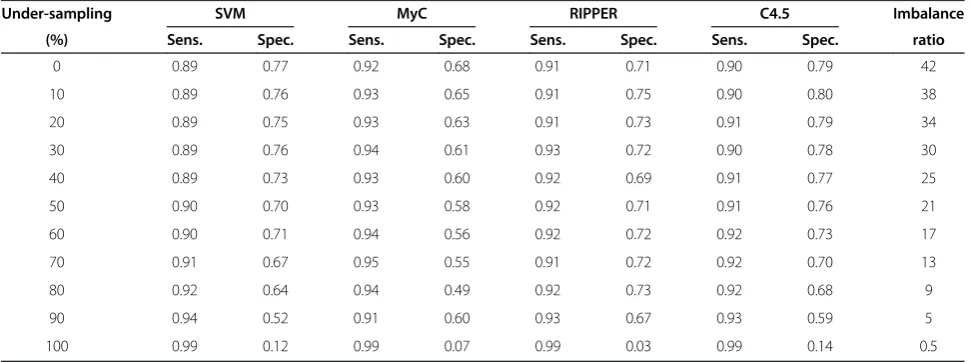
Table 3 Sensitivity and specificity of various classifiers trained on the hepatobiliary data set for difference percentages of under-sampling
Under-sampling SVM MyC RIPPER C4.5 Imbalance
(%) Sens. Spec. Sens. Spec. Sens. Spec. Sens. Spec. ratio
0 0.89 0.77 0.92 0.68 0.91 0.71 0.90 0.79 42
10 0.89 0.76 0.93 0.65 0.91 0.75 0.90 0.80 38
20 0.89 0.75 0.93 0.63 0.91 0.73 0.91 0.79 34
30 0.89 0.76 0.94 0.61 0.93 0.72 0.90 0.78 30
40 0.89 0.73 0.93 0.60 0.92 0.69 0.91 0.77 25
50 0.90 0.70 0.93 0.58 0.92 0.71 0.91 0.76 21
60 0.90 0.71 0.94 0.56 0.92 0.72 0.92 0.73 17
70 0.91 0.67 0.95 0.55 0.91 0.72 0.92 0.70 13
80 0.92 0.64 0.94 0.49 0.92 0.73 0.92 0.68 9
90 0.94 0.52 0.91 0.60 0.93 0.67 0.93 0.59 5
Table 2 shows the sensitivity and specificity results of all four classifiers trained on the hepatobiliary and the acute renal failure data sets, with and without set expansion.
C4.5 could not generate a classifier for our largest data set, acute renal failure with set expansion, because the memory requirement of this algorithm proved prohibitive.
The decision-tree and decision-rule learners performed slightly better than the SVM. The imbalance ratios (number of negative examples divided by number of positive exam-ples) varies greatly for the baseline classifiers. The specifi-city of the classifiers trained on the hepatobiliary data without set expansion was very low. For our sampling and cost-sensitive experiments, we therefore focused on chan-ging the imbalance ratio in the data with set expansion. The acute renal failure data with set expansion was very imbalanced, which resulted in classifiers with relatively low
sensitivity. We therefore focused on changing the imbal-ance ratio in the data without set expansion.
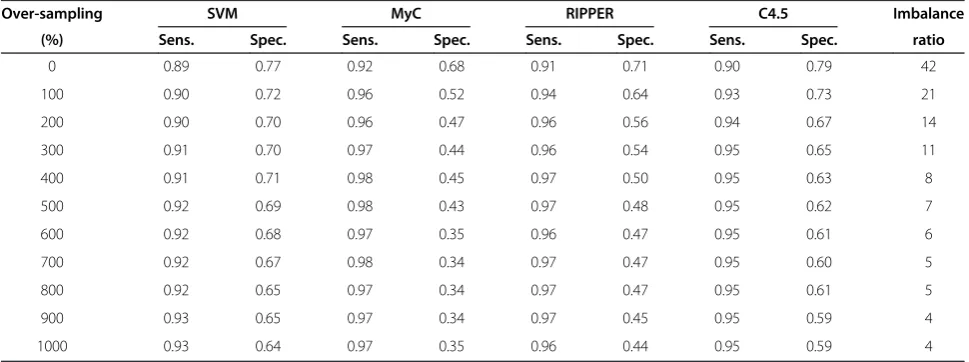
Tables 3, 4, 5 and 6 show the results for changing the proportions of positive and negative cases in both data sets by under-sampling and over-sampling, respectively.
All algorithms showed consistent behavior during the under-sampling experiments. The sensitivity increased and specificity decreased as we decrease the number of negative case entries from the data set.
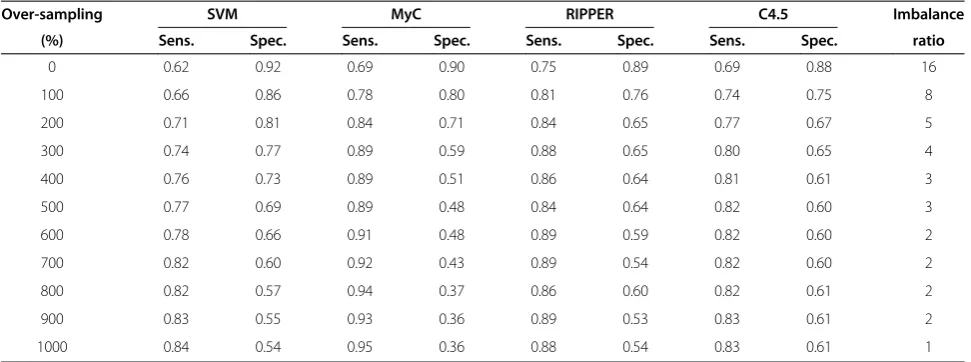
Almost a similar pattern is observed during the over-sampling experiments where sensitivity gradually in-creased and specificity dein-creased as we increase the number of positive case entries in the data set. MyC showed slightly more improvement in the sensitivity as compared to other algorithms but then also lower specificity.
Table 4 Sensitivity and specificity of various classifiers trained on the acute renal failure data set for difference percentages of under-sampling
Under-sampling SVM MyC RIPPER C4.5 Imbalance
(%) Sens. Spec. Sens. Spec. Sens. Spec. Sens. Spec. ratio
0 0.62 0.92 0.69 0.90 0.71 0.89 0.69 0.88 16
10 0.64 0.90 0.74 0.89 0.75 0.89 0.69 0.87 14
20 0.64 0.89 0.75 0.83 0.75 0.88 0.74 0.86 13
30 0.66 0.88 0.76 0.82 0.76 0.88 0.75 0.85 11
40 0.70 0.85 0.75 0.87 0.74 0.88 0.75 0.85 9
50 0.74 0.81 0.76 0.80 0.77 0.76 0.76 0.82 8
60 0.82 0.72 0.77 0.81 0.84 0.68 0.83 0.82 6
70 0.83 0.67 0.83 0.70 0.83 0.61 0.86 0.77 5
80 0.86 0.56 0.89 0.49 0.90 0.44 0.90 0.45 3
90 0.92 0.41 0.90 0.43 0.89 0.43 0.92 0.39 2
Table 5 Sensitivity and specificity of various classifiers trained on the hepatobiliary data set for difference percentages of over-sampling
Over-sampling SVM MyC RIPPER C4.5 Imbalance
(%) Sens. Spec. Sens. Spec. Sens. Spec. Sens. Spec. ratio
0 0.89 0.77 0.92 0.68 0.91 0.71 0.90 0.79 42
100 0.90 0.72 0.96 0.52 0.94 0.64 0.93 0.73 21
200 0.90 0.70 0.96 0.47 0.96 0.56 0.94 0.67 14
300 0.91 0.70 0.97 0.44 0.96 0.54 0.95 0.65 11
400 0.91 0.71 0.98 0.45 0.97 0.50 0.95 0.63 8
500 0.92 0.69 0.98 0.43 0.97 0.48 0.95 0.62 7
600 0.92 0.68 0.97 0.35 0.96 0.47 0.95 0.61 6
700 0.92 0.67 0.98 0.34 0.97 0.47 0.95 0.60 5
800 0.92 0.65 0.97 0.34 0.97 0.47 0.95 0.61 5
900 0.93 0.65 0.97 0.34 0.97 0.45 0.95 0.59 4
The results for cost-sensitive learning with MetaCost using varying misclassification costs are shown in Tables 7 and 8.
Classifiers do not seem to be very sensitive to the mis-classification cost so performance variations were ob-served at relatively high cost values.
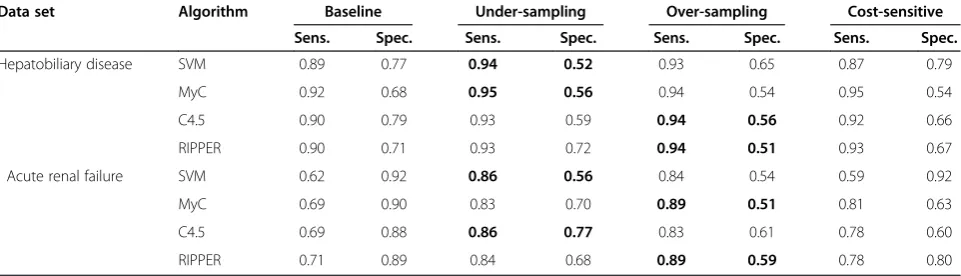
As an example of the sensitivity that can be achieved with the sampling methods and cost-sensitive learning while maintaining a reasonable specificity, Table 9 shows the performance of the classifiers with the highest sensi-tivity and a specificity of at least 0.5. Our results (cf. Tables 3, 4, 5, 6, 7 and 8) show that classifiers with high specificity than 0.5 are feasible but at the expense of a lower sensitivity.
The performance of sampling methods and cost-sensitive learning is compared to the baseline models of both data sets.
To get an estimate of the sensitivity and specificity of manual case identification, we compared the labels of
the second annotator with the gold standard labels of annotator 1. For the hepatobiliary set, sensitivity was 0.94 and specificity was 0.83, for the acute renal failure set sensitivity was 0.96 and specificity was 0.94. Our ex-periments (cf. Tables 3, 4, 5, 6, 7 and 8) showed that similar sensitivity performance (or even better sensitivity for the hepatobiliary set, depending on how much speci-ficity can be compromised in a study) could be achieved using automatic classification.
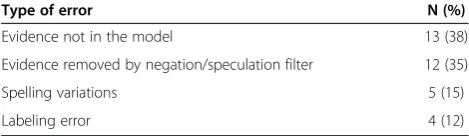
We did an error analysis of the positive cases missed by the MyC algorithm using 70% under-sampling method (sensitivity 0.95) on the hepatobiliary disease data set (Table 10). About 38% of the missed positive cases were due to the evidence keywords in the entry (e.g., leverfibrose, hepatomegalie, cholestase) not being picked up by the learning algorithm. For about a third of the missed cases, the negation/speculation filter had erroneously removed the evidence in the entry. For ex-ample, in the following entry: “Ron [O] ECHO BB: cholelithiasis, schrompelnier li? X- BOZ: matig coprostase”, the evidence“cholelithiasis” was removed by the speculation filter because the sentence ended with a question mark. Spelling variations caused about 15% of the errors (e.g., “levercirrhose” instead of
“levercirrose” (“liver cirrhosis”), and 12% of the missed cases turned out to be labeling errors. For example, in the following labeled entry: “Waarschijnlijk steatosis hepatitis bij status na cholecystectomie”the GP has men-tioned only a probability of the disease (“waarschijnlijk”, meaning “probable”), but the patient was labeled as a positive case.
Discussion
In this paper we demonstrated that dealing with the pro-portions of positive and negative cases entries in the data sets could increase the sensitivity of machine
Table 6 Sensitivity and specificity of various classifiers trained on the acute renal failure data set for difference percentages of over-sampling
Over-sampling SVM MyC RIPPER C4.5 Imbalance
(%) Sens. Spec. Sens. Spec. Sens. Spec. Sens. Spec. ratio
0 0.62 0.92 0.69 0.90 0.75 0.89 0.69 0.88 16
100 0.66 0.86 0.78 0.80 0.81 0.76 0.74 0.75 8
200 0.71 0.81 0.84 0.71 0.84 0.65 0.77 0.67 5
300 0.74 0.77 0.89 0.59 0.88 0.65 0.80 0.65 4
400 0.76 0.73 0.89 0.51 0.86 0.64 0.81 0.61 3
500 0.77 0.69 0.89 0.48 0.84 0.64 0.82 0.60 3
600 0.78 0.66 0.91 0.48 0.89 0.59 0.82 0.60 2
700 0.82 0.60 0.92 0.43 0.89 0.54 0.82 0.60 2
800 0.82 0.57 0.94 0.37 0.86 0.60 0.82 0.61 2
900 0.83 0.55 0.93 0.36 0.89 0.53 0.83 0.61 2
1000 0.84 0.54 0.95 0.36 0.88 0.54 0.83 0.61 1
Table 7 Sensitivity and specificity of various classifiers trained on the hepatobiliary data set for difference cost values of cost-sensitive learning
SVM MyC RIPPER C4.5
Cost Sens. Spec. Sens. Spec. Sens. Spec. Sens. Spec.
1 0.86 0.78 0.90 0.68 0.93 0.67 0.89 0.71
10 0.87 0.78 0.95 0.54 0.93 0.68 0.92 0.69
25 0.87 0.79 0.96 0.47 0.93 0.67 0.92 0.69
50 0.87 0.79 0.96 0.47 0.93 0.67 0.91 0.66
100 0.87 0.79 0.96 0.47 0.93 0.67 0.92 0.66
200 0.87 0.79 0.96 0.47 0.93 0.67 0.92 0.66
400 0.87 0.79 1.00 0.09 0.97 0.24 0.99 0.12
800 0.87 0.79 1.00 0.00 1.00 0.00 1.00 0.00
learning methods for automated case identification. We used sampling and cost-sensitive methods on two very different data sets and with four different machine-learning algorithms.
The under-sampling and over-sampling methods per-formed consistently well and resulted in higher sensitivity on both data sets. Although there was no clear winner be-tween under-sampling and over-sampling methods, under-sampling performed slightly better. For the hepatobiliary set, the best sensitivity-specificity score (by selecting the highest value of sensitivity at a specificity lar-ger than 0.5) using over-sampling was 0.94 sensitivity and 0.56 specificity with C4.5, the best score using under-sampling was 0.95 sensitivity and 0.56 specificity with MyC, and the best score using cost sensitive learning was 0.95 sensitivity and 0.54 specificity using MyC (cf. Table 9). For the acute renal failure set, the best sensitivity-specificity score using over-sampling was 0.89 sensitivity and 0.59 specificity using RIPPER, the best score using under-sampling was 0.86 sensitivity and 0.77 specificity using C4.5, and the best score using cost-sensitive learning
was 0.81 sensitivity and 0.63 specificity using MyC. Over-all, C4.5 and MyC appeared to perform best.
The sampling experiments demonstrated the effect of imbalance in the data sets. The question of finding an optimal or best class distribution ratio has been studied by several researchers in the past [25,55,56]. Our experi-ments showed that the classifiers performed better (high sensitivity with not too low specificity) when the imbal-ance ratio (negative cases to positive cases) was below 10 (cf. Tables 3, 4, 5 and 6). This performance improve-ment between the ratios was observed in both the data sets despite the fact that they were very different from each other.
Previous studies indicate that cost-sensitive learning usually performs as well as sampling methods if not bet-ter [39]. In our experiments, cost-sensitive learning performed about equally well as sampling, but it was dif-ficult to find an optimal cost matrix. Different classifiers treat costs differently and finding an optimal cost value depends on the data set and the classifier used. Another disadvantage of cost-sensitive learning with MetaCost is the large processing time because of its bootstrapping method. For C4.5, which requires high memory and pro-cessing capacity, MetaCost did not generate classifiers for our largest data set because processing time became prohibitive.
The positive effect of set expansion for training on the hepatobiliary disease data set can be seen in Table 2. The results show that set expansion of epidemiological data sets with relatively few negative cases can boost specificity with a modest decrease in sensitivity. For ex-ample, specificity for C4.5 increased from 0.03 to 0.79 with sensitivity decreasing from 0.99 to 0.90. On this data set, the set expansion compensated for the relatively few negative examples in the data set without set expan-sion. The set expansion method added new entries (im-plicit negative case entries, cf. Table 1) with potentially useful features unlike over-sampling, where existing negative entries in the data set would be duplicated,
Table 8 Sensitivity and specificity of various classifiers trained on the acute renal failure data set for difference cost values of cost-sensitive learning
SVM MyC RIPPER C4.5
Cost Sens. Spec. Sens. Spec. Sens. Spec. Sens. Spec.
1 0.59 0.92 0.74 0.85 0.78 0.80 0.67 0.73
10 0.59 0.92 0.81 0.63 0.78 0.80 0.73 0.69
25 0.59 0.92 0.81 0.63 0.78 0.80 0.76 0.64
50 0.59 0.92 0.89 0.35 0.78 0.80 0.78 0.60
100 0.59 0.92 1.00 0.00 0.78 0.80 0.97 0.11
200 0.59 0.92 1.00 0.00 1.00 0.00 1.00 0.00
400 0.59 0.92 1.00 0.00 1.00 0.00 1.00 0.00
800 0.59 0.92 1.00 0.00 1.00 0.00 1.00 0.00
1000 0.59 0.92 1.00 0.00 1.00 0.00 1.00 0.00
Table 9 Performance of the classifiers with the highest sensitivity and a specificity of at least 0.5 on the hepatobiliary disease and acute renal failure data sets
Data set Algorithm Baseline Under-sampling Over-sampling Cost-sensitive
Sens. Spec. Sens. Spec. Sens. Spec. Sens. Spec.
Hepatobiliary disease SVM 0.89 0.77 0.94 0.52 0.93 0.65 0.87 0.79
MyC 0.92 0.68 0.95 0.56 0.94 0.54 0.95 0.54
C4.5 0.90 0.79 0.93 0.59 0.94 0.56 0.92 0.66
RIPPER 0.90 0.71 0.93 0.72 0.94 0.51 0.93 0.67
Acute renal failure SVM 0.62 0.92 0.86 0.56 0.84 0.54 0.59 0.92
MyC 0.69 0.90 0.83 0.70 0.89 0.51 0.81 0.63
C4.5 0.69 0.88 0.86 0.77 0.83 0.61 0.78 0.60
which could lead to the problem of over-fitting. In the acute renal failure data set, negative examples were already in majority in the training model without set ex-pansion. Set expansion further increased the imbalance, which resulted in decreased sensitivity of below 0.5 for all classifiers.
Overall, the decision tree and rule learning algorithms appear to perform slightly better than the statistical al-gorithms. One important advantage of tree- and rule-learning algorithms is their ability to generate models that are easily interpretable by humans. Such models can be compared with the case definitions created by human experts.
There were some study limitations. The automatic case identification system was applied on the results of the broad query to distinguish positive cases and nega-tive cases. If cases were missed by the broad query, they will also be missed by the automatic system. In other words the sensitivity of the automatic case identifica-tion system is bound by the sensitivity of the broad query. It would be interesting to apply the automatic system on the actual EMR database and compare it with the broad query. The rate of misspellings has shown to be larger in EMRs than in other type of docu-ments [57] but no attempts were made to handle the misspellings in the case identification system. The end of a sentence was demarked by a punctuation mark which was not optimal as later confirmed by the error analysis. Our algorithm to find negated and speculative assertions has been developed for the Dutch language and currently is not as sophisticated and comprehensive as some of the algorithms available for English, e.g., NegEx [42] or Con-Text [58], and ScopeFinder [59]. To deal with such issues, we need to improve our preprocessing methods. The neg-ation algorithm can be made more informative so it can also detect double negations.
Our strategy by dealing with the imbalance ratio in a data set with and without the set expansion will result in a highly sensitive classifier. An acceptable sensitivity-specificity score will depend on the actual requirement and type of the observational study. We would like to point out that our approach is not specific to the IPCI database or the Dutch EMRs used in this study.
Conclusions
We were able to achieve high sensitivity (on a par with the manual annotator) on both data sets using our pro-posed sampling and cost-sensitive methods. During a case-identification process in an epidemiological study all records returned by the broad query need to be manually validated. An automatic case-identification sys-tem with high sensitivity and reasonable specificity can be used as a pre-filter to significantly reduce the work-load by reducing the amount of records that needs to be manually validated. The specificity can then be increased during the manual validation process on the reduced set. Using manual validation on the reduced set instead of the set retrieved by the broad query could save weeks of manual work in each epidemiological study.
Appendix
The broad query used to select potential hepatobiliary disease cases. The first four words are ICPC codes. Al-though this query is in Dutch, the only word that is dif-ferent from English is“lever”, meaning“liver”.
“D72.”OR
“D96.”OR
“D97.”OR
“D98.”OR
(“lever”AND“meta”) OR (“hepatocell”AND“carc”) OR (“lever”AND“tumor”) OR
“cholangiocarc”OR
“hepatitis”OR
(“lever”AND“vervet”) OR (“steat”AND“hepat”) OR
“cholestase”OR
“cholecyst”OR
“cholelith”OR
“galst”OR
“cirrho”OR
“cirros”OR
“ciros”OR
“hepatom”OR
“hepatoslenom”OR (“port”AND“hypert”) OR (“lever”AND“insuff”) OR (“lever”AND“transpl)
The broad query used to select potential acute renal fail-ure cases. The first three words are ICPC codes.
“U05.1”OR
“U99.1”OR
“U88”OR
“oligur”OR
“tubulus”OR
Table 10 Error analysis of the false negatives by the MyC classifier trained on the hepatobiliary disease data set with 70% under-sampling
Type of error N (%)
Evidence not in the model 13 (38)
Evidence removed by negation/speculation filter 12 (35)
Spelling variations 5 (15)
“glomerulone”OR
“anuria”OR
“urem”OR
“dialyse”OR
(“rena”AND“insuf”) OR (“rena”AND“falen”) OR (“nier”AND“insuf”) OR (“nier”AND“falen”) OR (“nier”AND“trans”) OR (“necro”AND“tubul”) OR (“interstit”AND“nephr”) OR (“interstit”AND“nepfr”)
The generic term “dialyse” (“dialysis”) is used for “renal replacement therapy” which is commonly associated with chronic renal failure. However “dialyse” is some-times also used for “acute disturbance in kidney func-tion”. The terms (“rena” AND “insuf”), (“nier” AND
“insuf”), (“rena” AND “falen”), and (“nier” AND “falen”) relate to renal/kidney insufficiency/failure, a medical condition in which kidneys fail to function adequately. Inclusion of all of these terms yielded many chronic pa-tients but exclusion of the terms would have results in missing acute renal failure patients.
Competing interests
The authors declare that they have no competing interests.
Authors’contributions
ZA carried out the experiments, and drafted the manuscript. EFS and JCvB annotated the data sets. MJS, JAK, and MCJMS supervised and coordinated the project and revised the manuscript. All authors read and approved the manuscript.
Acknowledgments
This study was supported by the VICI project 91896632 of the Netherlands Organization for Health Research and Development ZonMw.
Received: 18 October 2012 Accepted: 27 February 2013 Published: 2 March 2013
References
1. Linder JA, Haas JS, Iyer A, Labuzetta MA, Ibara M, Celeste M, Getty G, Bates DW:Secondary use of electronic health record data: spontaneous triggered adverse drug event reporting.Pharmacoepidemiol Drug Saf
2010,19:1211–1215.
2. Norén GN, Hopstadius J, Bate A, Star K, Edwards IR:Temporal pattern discovery in longitudinal electronic patient records.Data Min Knowl Discov2009,20:361–387.
3. Boockvar KS, Livote EE, Goldstein N, Nebeker JR, Siu A, Fried T:Electronic health records and adverse drug events after patient transfer.Qual Saf Health Care2010,19:e16.
4. Hurdle JF, Haroldsen SC, Hammer A, Spigle C, Fraser AM, Mineau GP, Courdy SJ:Identifying clinical/translational research cohorts: ascertainment via querying an integrated multi-source database.J Am Med Inform Assoc2013,20:164–171. doi:10.1136/amiajnl-2012-001050. 5. Vlug A, Van der Lei J, Mosseveld B, Van Wijk M, Van der Linden P, MC S, Van
Bemmel J:Postmarketing surveillance based on electronic patient records: the IPCI project.Methods Inf Med1999,38:339–344. 6. Liao KP, Cai T, Gainer V, Goryachev S, Zeng-treitler Q, Raychaudhuri S,
Szolovits P, Churchill S, Murphy S, Kohane I, Karlson EW, Plenge RM: Electronic medical records for discovery research in rheumatoid arthritis.
Arthritis Care Res (Hoboken)2010,62:1120–1127.
7. Stanfill MH, Williams M, Fenton SH, Jenders RA, Hersh WR:A systematic literature review of automated clinical coding and classification systems.
J Am Med Inform Assoc2010,17:646–651.
8. Chung CP, Murray KT, Stein CM, Hall K, Ray WA:A computer case definition for sudden cardiac death.Pharmacoepidemiol Drug Saf2010, 19:563–572.
9. Cunningham A, Stein CM, Chung CP, Daugherty JR, Smalley WE, Ray WA: An automated database case definition for serious bleeding related to oral anticoagulant use.Pharmacoepidemiol Drug Saf2011,20:560–566. 10. Singh JA, Holmgren AR, Noorbaloochi S:Accuracy of Veterans
Administration databases for a diagnosis of rheumatoid arthritis.Arthritis Rheum2004,51:952–957.
11. Nicholson A, Tate AR, Koeling R, Cassell JA:What does validation of cases in electronic record databases mean? The potential contribution of free text.Pharmacoepidemiol Drug Saf2011,20:321–324.
12. Meystre SM, Savova GK, Kipper-Schuler KC, Hurdle JF:Extracting information from textual documents in the electronic health record: a review of recent research.Yearb Med Inform2008,47:128–144. 13. Perlis RH, Iosifescu DV, Castro VM, Murphy SN, Gainer VS, Minnier J, Cai T,
Goryachev S, Zeng Q, Gallagher PJ, Fava M, Weilburg JB, Churchill SE, Kohane IS, Smoller JW:Using electronic medical records to enable large-scale studies in psychiatry: treatment resistant depression as a model.
Psychol Med2012,42:41–50.
14. Elkin PL, Froehling D, Wahner-Roedler D, Trusko B, Welsh G, Ma H, Asatryan AX, Tokars JI, Rosenbloom ST, Brown SH:NLP-based identification of pneumonia cases from free-text radiological reports, AMIA Annu Symp Proc. 2008:172–176.
15. Savova GK, Fan J, Ye Z, Murphy SP, Zheng J, Chute CG, Kullo IJ:Discovering peripheral arterial disease cases from radiology notes using natural language processing division of biomedical statistics and informatics, 2 division of cardiovascular diseases.AMIA Annu Symp Proc2010,2010:722–726. 16. Pakhomov S, Weston SA, Jacobsen SJ, Chute CG, Meverden R, Roger VL:
Electronic medical records for clinical research: application to the identification of heart failure.Am J Manag Care2007,13:281–288. 17. Friedlin J, Overhage M, Al-Haddad Ma, Waters Ja, Aguilar-Saavedra JJR,
Kesterson J, Schmidt M:Comparing methods for identifying pancreatic cancer patients using electronic data sources.AMIA Annu Symp Proc2010, 2010:237–241. http://www.ncbi.nlm.nih.gov/pmc/articles/PMC3041435/. 18. Roque FS, Jensen PB, Schmock H, Dalgaard M, Andreatta M, Hansen T,
Søeby K, Bredkjær S, Juul A, Werge T, Jensen LJ, Brunak S:Using electronic patient records to discover disease correlations and stratify patient cohorts.PLoS Comput Biol2011,7:e1002141.
19. Farkas R, Szarvas G:Automatic construction of rule-based ICD-9-CM coding systems.BMC Bioinforma2008,9(3):S10.
20. Persell SD, Dunne AP, Lloyd-Jones DM, Baker DW:Electronic health record-based cardiac risk assessment and identification of unmet preventive needs.Med Care2009,47:418–424.
21. Wang Z, Shah AD, Tate AR, Denaxas S, Shawe-Taylor J, Hemingway H: Extracting diagnoses and investigation results from unstructured text in electronic health records by semi-supervised machine learning.PLoS One
2012,7:e30412.
22. Savova GK, Ogren PV, Duffy PH, Buntrock JD, Chute CG:Mayo clinic NLP system for patient smoking status identification.J Am Med Inform Assoc
2008,15:25–28.
23. Clark C, Good K, Jezierny L, Macpherson M, Wilson B, Chajewska U: Identifying smokers with a medical extraction system.J Am Med Inform Assoc2007,15:36–39.
24. Schuemie MJ, Sen E,‘t Jong GW, van Soest EM, Sturkenboom MC, Kors JA: Automating classification of free-text electronic health records for epidemiological studies.Pharmacoepidemiol Drug Saf2012,21:651–658. 25. Garcia EA:Learning from imbalanced data.IEEE Trans Knowl Data Eng
2009,21:1263–1284.
26. Mease D, Wyner AJ:Boosted classification trees and class probability / quantile estimation.J Mach Learn Res2007,8:409–439.
27. Taft LM, Evans RS, Shyu CR, Egger MJ, Chawla N, Mitchell JA, Thornton SN, Bray B, Varner M:Countering imbalanced datasets to improve adverse drug event predictive models in labor and delivery.J Biomed Inform2009, 42:356–364.
29. Chawla NV:Data Mining for Imbalanced Datasets: An Overview.InData Mining and Knowledge Discovery Handbook.Edited by Maimon O, Rokach L. Boston, MA: Springer US; 2010:875–886.
30. Van Hulse J, Khoshgoftaar TM, Napolitano A:Experimental perspectives on learning from imbalanced data.InProceedings of the 24th international conference on Machine learning - ICML’07.New York, New York, USA: ACM Press; 2007:935–942.
31. Chawla NV, Bowyer KW, Hall LO, Kegelmeyer WP:SMOTE: synthetic minority over-sampling technique.Artif Intell2002,16:321–357. 32. Drummond C, Holte RC:C4.5, Class Imbalance, and Cost Sensitivity: Why
Under-Sampling beats Over-Sampling.InWorkshop on Learning from Imbalanced Data Sets II (ICML 2003).2003:1–8.
33. Japkowicz N:The Class Imbalance Problem: Significance and Strategies. InProceedings of the 2000 International Conference on Artificial Intelligence (ICAI).2000:111–117.
34. Ling CX, Sheng VS:Cost-Sensitive Learning and the Class Imbalance Problem.
In Encyclopedia of Machine Learning: Springer; 2011.
35. Wang T, Qin Z, Zhang S, Zhang C:Cost-sensitive classification with inadequate labeled data.Inf Syst2012,37:508–516.
36. Japkowicz N, Stephen S:The class imbalance problem: a systematic study.
Intell Data Anal2002,6:429–449.
37. Sun Y, Kamel M, Wong A, Wang Y:Cost-sensitive boosting for classification of imbalanced data.Pattern Recognit2007,40:3358–3378. 38. Zhou Z, Member S, Liu X:Training cost-sensitive neural networks with
methods addressing the class imbalance problem.IEEE Trans Knowl Data Eng2006,18:63–77.
39. McCarthy K, Zabar B, Weiss G:Does cost-sensitive learning beat sampling for classifying rare classes?InProceedings of the 1st international workshop on Utility-based data mining - UBDM’05.New York, New York, USA: ACM Press; 2005:69–77.
40. Liu X, Zhou Z:The Influence of Class Imbalance on Cost-Sensitive Learning: An Empirical Study.InSixth International Conference on Data Mining (ICDM’06).2006:970–974.
41. Cohen J:A coefficient of agreement for nominal scales.Educ Psychol Meas
1960,20:37–46.
42. Chapman WW, Bridewell W, Hanbury P, Cooper GF, Buchanan BG:A simple algorithm for identifying negated findings and diseases in discharge summaries.J Biomed Inform2001,34:301–310.
43. Setiono R, Liu H:Chi2: feature selection and discretization of numeric attributes.In Proceedings of 7th IEEE International Conference on Tools with Artificial Intelligence.IEEE Comput. Soc. Press; 1995:388–391. doi:10.1109/ TAI.1995.479783.
44. Adler W, Brenning A, Potapov S, Schmid M, Lausen B:Ensemble classification of paired data.Comput Stat Data Anal2011,55:1933–1941. 45. Sun Y, Kamel M, Wang Y:Boosting for Learning Multiple Classes with
Imbalanced Class Distribution.InSixth International Conference on Data Mining (ICDM’06).Washington, DC, USA: IEEE Computer Society; 2006:592– 602. doi:10.1109/ICDM.2006.29.
46. Akbani R, Kwek S, Japkowicz N:Applying Support Vector Machines to Imbalanced Datasets.InIn Proceedings of the 15th European Conference on Machine Learning (ECML}.2004:39–50.
47. Chen C, Liaw A, Breiman L:Using Random Forest to Learn Imbalanced Data, Discovery. 2004:1–12.
48. Domingos P:MetaCost: A General Method for Making Classifiers Cost-Sensitive, Proceedings of the fifth ACM SIGKDD international conference on Knowledge discovery and data mining - KDD’99. New York, New York, USA: ACM Press; 1999:155–164.
49. Hall M, Frank E, Holmes G, Pfahringer B, Reutemann P, Witten IH:The WEKA data mining software.InACM SIGKDD Explorations Newsletter, Volume 11. 2009:10. 50. Salzberg SL:C4.5: Programs for Machine Learning by J. Ross Quinlan.
Morgan Kaufmann Publishers, Inc., 1993.Mach Learn1994,16:235–240. 51. Chang C-C, Lin C-J:LIBSVM: a library for support vector machines.InACM
Transactions on Intelligent Systems and Technology, Volume 2. 2011:1–27. 52. Hsu C, Chang C, Lin C:A practical guide to support vector classification.
Bioinformatics2010,1:1–16.
53. Cohen WW:Fast Effective Rule Induction.InProceedings of the Twelfth International Conference on Machine Learning.Edited by Prieditis A, Morgan Kaufmann RS.; 1995:115–123.
54. Quinlan JR:Induction of decision trees.Mach Learn1986,1:81–106. 55. Weiss GM, Provost F:Learning when training data are costly: the effect of
class distribution on tree induction.J Artif Intell Res2003,19:315–354.
56. Chan PK, Stolfo SJ:Toward Scalable Learning with Non-uniform Class and Cost Distributions: A Case Study in Credit Card Fraud Detection.In
Proceedings of the Fourth International Conference on Knowledge Discovery and Data Mining, Volume 164. 1998:164–168.
57. Ruch P, Baud RH, Geiddbühler A, Lovis C, Rassinoux AM, Rivière A:Looking back or looking all around: comparing two spell checking strategies for documents edition in an electronic patient record, Proc AMIA Symp. 2001:568–72.
58. Harkema H, Dowling JN, Thornblade T, Chapman WW:ConText: an algorithm for determining negation, experiencer, and temporal status from clinical reports.J Biomed Inform2009,42:839–851.
59. Apostolova E, Tomuro N, Demner-fushman D:Automatic Extraction of Lexico-Syntactic Patterns for Detection of Negation and Speculation Scopes, Proceedings of the 49th Annual Meeting of the Association for Computational Linguistics: Human Language Technologies: short papers -Volume 2. Portland, Oregon, USA: Association for Computational Linguistics; 2011:283–287.
doi:10.1186/1472-6947-13-30
Cite this article as:Afzalet al.:Improving sensitivity of machine learning methods for automated case identification from free-text electronic medical records.BMC Medical Informatics and Decision Making201313:30.
Submit your next manuscript to BioMed Central and take full advantage of:
• Convenient online submission
• Thorough peer review
• No space constraints or color figure charges
• Immediate publication on acceptance
• Inclusion in PubMed, CAS, Scopus and Google Scholar
• Research which is freely available for redistribution