RESEARCH
Multiple poor sleep characteristics
and metabolic abnormalities consistent
with metabolic syndrome among white, black,
and Hispanic/Latina women: modification
by menopausal status
Symielle A. Gaston
1, Yong‑Moon Park
1, Ketrell L. McWhorter
1, Dale P. Sandler
1and Chandra L. Jackson
1,2*Abstract
Background: Poor sleep is a potential risk factor for metabolic syndrome (MetS), and its relationship with MetS may
vary by race/ethnicity and menopausal status among women.
Methods: We used Sister Study enrollment data from 2003 to 2009 to investigate the cross‑sectional associations
between multiple subjective sleep characteristics and having ≥ 3 prevalent metabolic abnormalities consistent with MetS among white, black, and Hispanic/Latina women. Self‑reported sleep characteristics included average sleep duration (short [< 7 h] vs. recommended [7–9 h]), sleep debt (≥ 2‑h difference between shortest and longest sleep duration, napping ≥ 3 times/week, and insomnia symptoms (difficulty falling or staying asleep). We used Poisson regression with robust variance to estimate adjusted prevalence ratios (PRs) and 95% confidence intervals (CIs) to compare MetS prevalence between women with poor sleep (e.g., short sleep, sleep debt, frequent napping, or insom‑ nia symptoms [all yes vs. no]) and non‑poor sleep within menopausal status categories (premenopausal or postmen‑ opausal). We adjusted for sociodemographic characteristics, mental health, and health behaviors.
Results: Among 38,007 eligible women (13,988 premenopausal, 24,019 postmenopausal), mean age was
55 ± 8.8 years, racial/ethnic composition was 86.63% white, 8.53% black, and 4.84% Hispanic/Latina, and 12% had MetS. Associations between certain poor sleep characteristics [i.e., short sleep (PRpremenopausal= 1.23 [95% CI 1.06– 1.42], PRpostmenopausal= 1.09 [1.02–1.16], pshort sleep*menopause= 0.0070) and insomnia symptoms (PRpremenopausal= 1.21 [1.05–1.41], PRpostmenopausal= 1.11 [1.05–1.18], pinsomnia symptoms*menopause= 0.035)] and prevalent MetS were stronger among premenopausal compared to postmenopausal women, but did not vary by race/ethnicity. Associations between concurrent short sleep/insomnia symptoms and MetS were stronger among white and Hispanic/Latina postmenopausal women compared to their black counterparts. Menopausal status and race/ethnicity did not modify positive associations for other poor sleep characteristics.
Conclusions: Poor sleep was positively associated with MetS prevalence. Associations between individual poor sleep
characteristics (i.e., short sleep, insomnia symptoms) were stronger among premenopausal compared to postmeno‑ pausal women but did not vary by race/ethnicity.
Keywords: Metabolic syndrome, Sleep, African Americans, Hispanic Americans, Whites, Women, Menopause
© The Author(s) 2019. This article is distributed under the terms of the Creative Commons Attribution 4.0 International License (http://creat iveco mmons .org/licen ses/by/4.0/), which permits unrestricted use, distribution, and reproduction in any medium, provided you give appropriate credit to the original author(s) and the source, provide a link to the Creative Commons license, and indicate if changes were made. The Creative Commons Public Domain Dedication waiver (http://creat iveco mmons .org/ publi cdoma in/zero/1.0/) applies to the data made available in this article, unless otherwise stated.
Open Access
*Correspondence: [email protected]
1 Epidemiology Branch, Department of Health and Human Services,
National Institute of Environmental Health Sciences, National Institutes of Health, Research Triangle Park, NC, USA
Background
Metabolic syndrome (MetS) is a cluster of cardiometa-bolic risk factors [e.g., elevated blood pressure (BP), elevated fasting blood glucose, dyslipidemia, abdominal obesity] that is associated with a twofold higher risk of cardiovascular disease as well as a 50% higher risk of
all-cause mortality [1, 2]. In the United States (US), the
prev-alence of MetS appears to have increased over the past two decades with a recent estimate of 34% among adults
(33% [men] and 35% [women]) [3, 4]. Among women,
MetS prevalence for non-Hispanic white and non-His-panic black (hereafter referred to as white and black)
women, increased by 44% and 41% from 1988 to 2012 [3].
Although MetS prevalence increased by only 2% among Mexican women, black and Mexican women were 20% more likely than white women to have MetS in this same
period [3]. Primary and secondary prevention of MetS is
warranted, especially among women, given the associ-ated health sequelae, increasing prevalence, and observed racial/ethnic disparities.
Meta-analyses suggest that poor sleep duration is a
potential risk factor for MetS [5–7]; however,
observa-tional studies measuring sleep quality have had mixed
results [8–17]. Nonetheless, experimental studies
sup-port associations between short-term sleep deprivation and physiological changes related to individual MetS components like weight gain, insulin resistance, and
ele-vated nocturnal BP [18–20]. Overall, one-third of
Ameri-cans do not get the 7–9 h of quality, uninterrupted sleep
recommended by the National Sleep Foundation [21, 22].
Furthermore, blacks and Hispanics/Latinos are two-to-four times more likely to report inadequate sleep com-pared to whites, and racial/ethnic disparities in sleep are likely contributors to racial/ethnic disparities in poor car-diometabolic health outcomes like frequently observed higher obesity prevalence among these racial/ethnic groups [3, 4, 23–26].
Among women, menopausal status may affect relation-ships between sleep characteristics and MetS. Postmeno-pausal women have been shown to have shorter sleep duration, worse sleep quality, and increased MetS risk compared to premenopausal women, independent of age (e.g., among younger women with surgical menopause) and likely due to declines in sex hormones (e.g., estrogen)
[27–30]. Although poor sleep and higher MetS risk may
be due to menopause-related physiologic changes among menopausal women, poor sleep may act more as a risk factor for MetS among premenopausal women. Despite commonly-observed racial/ethnic and menopausal status differences in sleep and cardiometabolic health, few stud-ies have investigated these characteristics as modifiers of sleep-MetS relationships [3, 4, 23, 24, 27–29, 31–33]. To address this important gap, the objective of our study
was to investigate the relationship between multiple sleep characteristics and prevalent metabolic abnormalities consistent with MetS among a multi-ethnic cohort of US women, and to determine whether these relationships vary by menopausal status and race/ethnicity.
Methods
The Sister Study Cohort
In 2018, we analyzed baseline data from data release 5.0.2 of the Sister Study, a prospective cohort study of 50,884 US women designed to investigate environmental and genetic risk factors for breast cancer among women aged 35–74 years. To be eligible for the study, participants had to live in the US, meet age criteria, have a sister diag-nosed with breast cancer, and be without breast cancer. Methods and recruitment strategies are described in
detail elsewhere [34]. Briefly, women were recruited from
the 50 US states and Puerto Rico. Recruitment strate-gies included word-of-mouth and flyer distribution at breast cancer support and advocacy groups and events; outreach at hospitals, medical centers, and other institu-tions the target population would visit; direct mailings; and mass media. Special recruitment efforts were made to ensure inclusion of typically underrepresented women including non-whites, older women, and women of lower socioeconomic status. Baseline data collection occurred from 2003 to 2009 and included self-administered ques-tionnaires, a two-part computer-assisted telephone inter-view, and a home visit that included anthropometric measurements, biologic specimen collection, and home environmental samples. The National Institute of Envi-ronmental Health Sciences Institutional Review Board and the Copernicus Group Independent Review Board approved the Sister Study protocol, and all participants provided informed consent.
Study participants
Women were excluded in a stepwise manner if they self-identified as any race/ethnicity other than white, black, or Hispanic/Latina (e.g., non-Hispanic Asian) due to low
sample size (n = 1334); were currently pregnant,
breast-feeding, or with pre-existing medical conditions (i.e., cancer, diabetes diagnosis before age 20 years or between ages 20 and 34 years along with continuous insulin usage,
cardiovascular/cerebrovascular disease, n = 5529); were
current shift workers (n = 288); or were missing values
or had unknown timing of excluded medical conditions
(n = 1230). Of the eligible participants, we excluded from
analyses those with missing or implausible values for
MetS components or potential confounders (n = 4147)
or who self-reported long (> 9 h) sleep duration (due to
Measures
Sleep characteristics
Detailed questionnaires used to ascertain sleep
charac-teristics are publicly available at https ://siste rstud y.niehs
.nih.gov/Engli sh/enrol l-data.htm. Participants reported hours and minutes of habitual sleep duration by respond-ing to ‘About how many hours and/or minutes of sleep per (night/day) do you get on average?’. We rounded responses to the nearest tenth of an hour and applied National Sleep Foundation recommendations,
categoriz-ing average sleep duration as short (< 7.0 h) and
recom-mended (7.0–9.0 h) [22]. We determined inconsistent weekly sleep patterns (yes vs. no) based on whether par-ticipants reported consistent (could vary day-by-day but were stable from week-to-week) or inconsistent wake-up times and bedtimes during the prior 6 weeks.
Partici-pants with consistent weekly sleep patterns reported daily
bedtimes and wake-up times from which we directly cal-culated longest and shortest sleep duration. Participants
with inconsistent weekly sleep patterns reported their
longest and shortest average sleep duration. Among all
participants, we defined sleep debt as a ≥ 2-h vs. < 2-h
difference between longest and shortest sleep dura-tion. Participants reported napping frequency, and we
dichotomized frequent napping as ≥ 3 naps per week vs.
< 3 naps per week. Participants also reported the average time taken to fall asleep and frequency of night
awaken-ings. Insomnia symptoms included either difficulty
fall-ing asleep (taking ≥ 30 min vs. < 30 min to fall asleep on
average) or difficulty staying asleep (awakening ≥ 3 times
per night/day, ≥ 3 nights/days per week vs. awakening < 3
times per night/day and/or < 3 nights/days per week) vs. neither, which were also individually assessed. We
exam-ined the combination of short sleep duration and
insom-nia symptoms. Lastly, we calculated a cumulative sleep score which was the sum of yes responses to the main
sleep characteristics (short sleep duration, inconsistent
weekly sleep patterns, sleep debt, frequent napping, and
insomnia symptoms [range: 0–5]).
Prevalent metabolic abnormalities consistent with metabolic syndrome
To be classified as having prevalent metabolic abnor-malities consistent with MetS (hereafter, referred to as MetS), participants had to meet at least three criteria related to hypertension, abdominal obesity, dyslipidemia, and prediabetes/type 2 diabetes mellitus (T2DM). We adapted the harmonized definition for MetS as outlined
by Alberti et al. [35] by using self-reported measures for
dyslipidemia and prediabetes/T2DM. During the base-line examination, technicians measured waist circumfer-ence (WC) and took three BP measurements, if possible. Participants met criteria for abdominal obesity if their
measured WC averaged ≥ 88 cm. BP measurements were
taken between 1 and 2 min apart, and we averaged the latter two BP measurements. If either of the latter two measurements was unavailable, we included the first BP measurement (3.8%). We classified participants with
a systolic BP ≥ 130 mmHg, a diastolic BP ≥ 85 mmHg,
or report of a physician’s diagnosis of hypertension and antihypertensive medication use in the past 12 months as having hypertension. We considered participants as having dyslipidemia if they self-reported a physician or healthcare provider diagnosis of high cholesterol, high triglycerides, or current use (within the past 12 months) of medications to lower triglycerides or raise high density lipoprotein cholesterol (i.e., fibrates, niacin, long-chain omega-3 fatty acids, statins). T2DM was defined as self-report of physician-diagnosed diabetes or diabetes medi-cation (including insulin) usage in the past 12 months. Prediabetes was based on self-reported physician-diag-nosed borderline diabetes.
Covariates
We considered self-reported (unless otherwise stated) potential confounders including sociodemo-graphic, health behavior, and clinical characteristics
[3, 8, 14]. Sociodemographic factors included age (in
years), educational attainment (≤ high school,
asso-ciate’s/technical degree or some college, ≥ college
graduate), current employment (yes vs. no), annual household income (< $20,000, $20,000–$49,999, $50,000–
$99,999, ≥ $100,000), household size, whether children
(aged ≤ 18 years) were in the household (yes vs. no),
and marital status (married/living as married, divorced/ separated/widowed, never married). Health behaviors included smoking status (current, former, never), alcohol consumption (never/former [0 drinks/week],
light/mod-erate [1 to ≤ 7 drinks/week], heavy [> 7 drinks/week]), the
sum of average total metabolic equivalent (METs) hours per week of self-reported ‘leisure-time, occupational, and daily activities’ physical activity in the past 12 months calculated using the Compendium of Physical Activities
[36, 37], diet quality (Healthy Eating Index [HEI] score
[38] and daily glycemic load [glucose scale] [39, 40])
cal-culated from responses to a modified Block 1998 Food Frequency Questionnaire, and reported sleep medication use to fall or stay asleep in the past 6 weeks (yes vs. no). Clinical characteristics included body mass index (BMI) calculated from objectively-measured height and weight
(kg/m2) and categorized as underweight (< 18.5 kg/m2),
normal weight (18.5–24.9 kg/m2), overweight (25.0–
29.9 kg/m2), obese (≥ 30.0 kg/m2) [41]; reported
Potential modifiers: menopausal status and race/ethnicity
We considered menopausal status and race/ethnicity as potential moderators of relationships between poor
sleep and an MetS based on prior literature [3, 26, 27,
29, 42]. Self-reported menopausal status was
dichoto-mized as premenopausal and postmenopausal (whether natural or non-natural [i.e., surgical or due to treatments] that caused cessation of menstruation). We categorized participants as white, black, or Hispanic/Latina if they reported only non-Hispanic white race/ethnicity, only non-Hispanic black race/ethnicity, or Hispanic/Latina ethnicity and any race, respectively. We used white as the reference category because whites represented the largest sample size and had the highest likelihood of both
non-poor sleep and lowest prevalence of MetS [3, 26].
Statistical analysis
We used Poisson regression with robust variance
estima-tion [43] to calculate adjusted prevalence ratios (PRs) and
95% confidence intervals (CIs) to compare MetS preva-lence between women with poor sleep to women with recommended sleep (yes vs. no for short sleep, inconsist-ent weekly sleep patterns, sleep debt, frequinconsist-ent napping, insomnia symptoms, difficulty falling asleep, or difficulty staying asleep) for premenopausal and postmenopausal women, separately. A two-sided p-value of 0.05 was used to determine statistical significance in all models. Based
on directed acyclic graphs [44] and the prior literature,
all adjusted models included age, educational attainment, annual household income, smoking status, alcohol con-sumption, healthy eating index score, log-transformed metabolic equivalents, hormone replacement therapy use, clinical depression/bipolar disorder, and sleep medication use. Models for sleep debt were addition-ally adjusted for consistent weekly sleep patterns. Mod-els including all participants were additionally adjusted for race/ethnicity. We determined statistical significance for a menopausal status-by-sleep characteristic interac-tion term in models that included all participants. Within each menopausal status category, we also included a sleep parameter-by-race/ethnicity interaction term and then stratified models by race/ethnicity. All analyses were performed using SAS software, version 9.4 of the SAS System for Windows (Cary, NC).
Sensitivity analysis
We performed six independent sensitivity analyses. First, we adjusted for use of medication for dyslipi-demia because of the potential for adverse sleep-related side effects related to medication use. Second, among menopausal women, we stratified by natural meno-pause (yes vs. no) due to the higher risk of MetS asso-ciated with surgical compared to natural menopause
[29]. Third, we recategorized participants with
dias-tolic BP ≥ 80 mmHg as hypertensive based on recent
recommendations of the American College of Cardiol-ogy/American Heart Association Task Force and reran
adjusted models [45]. Fourth, we additionally stratified
the analytic sample by sleep medication use. Fifth, we mutually adjusted for all individual sleep characteris-tics to determine which associations were robust after adjustment for other sleep characteristics. Lastly, to determine whether associations between poor sleep and individual MetS components varied by subgroup, we investigated individual metabolic abnormalities as outcomes.
Results
Study population
Our analytic sample consisted of 38,007
partici-pants (Additional file 1: Figure S1). Mean age was
55 ± 8.8 years and racial/ethnic composition was 86.6%
white, 8.5% black, and 4.8% Hispanic/Latina (Table 1).
Black women were the most likely to have at least a bachelor’s degree and be currently employed com-pared to white and Hispanic/Latina women. Blacks and Hispanics/Latinas had lower annual household income, on average, compared to whites. Most of the participants were postmenopausal (63%). Overall, postmenopausal women were generally more likely to have poor sleep characteristics compared to premeno-pausal women. The most notable racial/ethnic differ-ences in sleep characteristics were for sleep duration:
black women had the highest prevalence of short sleep
duration (53% premenopausal and 53% postmenopau-sal for blacks vs. 24% premenopaupostmenopau-sal and 26% post-menopausal for whites and 33% prepost-menopausal and 41% postmenopausal for Hispanics/Latinas). Among both premenopausal and postmenopausal participants, black and Hispanic/Latina women had similarly higher
prevalence of inconsistent weekly sleep patterns, sleep
debt, frequent napping, insomnia symptoms, and both
short sleep and insomnia symptoms compared to white women. Compared to premenopausal women, post-menopausal women also had higher prevalence of MetS (white—14% vs. 4.6%, black—28% vs. 12%, and His-panic/Latina—21% vs. 8.7%).
Poor sleep and MetS by menopausal status and race/ ethnicity
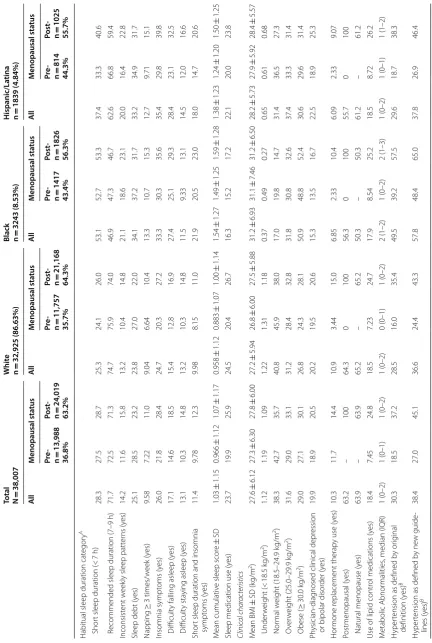
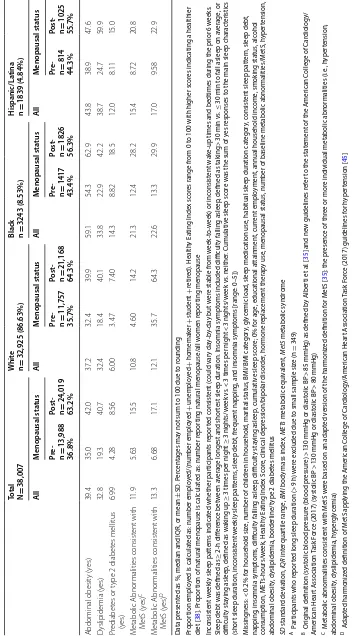
Table 1 S ocio demo gr aphic
, health b
eha
vior
, and clinic
al char
ac
teristics of eligible Sist
er S tudy par ticipan ts (N = 38,007)
Total N=
38,007 W hit e n = 32,925 (86.63%)
Black n =
3243 (8.53%) H ispanic/La tina n = 1839 (4.84%) Al l M enopausal sta tus Al l M enopausal sta tus Al l M enopausal sta tus Al l M enopausal sta tus Pr e-n = 13,988 36.8% Post -n = 24,019 63.2% Pr e-n = 11,757 35.7% Post -n = 21,168 64.3% Pr e-n = 1417 43.4% Post -n = 1826 56.3% Pr e-n = 814 44.3% Post -n = 1025 55.7% Sociodemogr aphic char acteristics M ean age ± SD (y ears) 55.0 ± 8.77 46.8 ± 5.12 59.8 ± 6.62 55.3 ± 8.79 46.8 ± 5.10 60.1 ± 6.61 53.1 ± 8.14 46.7 ± 5.16 58.1 ± 6.33 52.7 ± 8.88 45.6 ± 5.25 58.3 ± 6.89
Educational attainment ≤
H igh school 14.5 11.8 16.1 14.6 11.9 16.1 9.56 7.83 10.9 22.0 17.2 25.8 S
ome college or t
echnical deg ree 32.9 31.9 33.5 32.7 31.5 33.3 34.0 34.2 33.8 35.0 34.4 35.5 ≥ C ollege (bachelor
’s or g
reat er) 52.6 56.3 50.5 52.8 56.7 50.6 56.5 58.0 55.3 43.0 48.4 38.7 Cur rently emplo yed (y es) 68.4 83.4 59.6 67.7 83.0 59.2 77.0 89.6 67.3 64.4 78.6 53.2
Annual household income Less than $20,000
3.77 2.48 4.51 2.86 1.60 3.57 4.93 4.38 5.37 17.8 11.9 22.5 $20,000 t o $49,999 19.8 14.2 23.1 18.8 12.4 22.4 24.1 21.7 25.9 30.2 27.3 32.6 $50,000 t o $99,999 41.5 41.9 41.3 41.8 42.4 41.5 44.3 42.7 45.5 31.4 34.2 29.3
$100,000 or mor
e 34.9 41.4 31.1 36.5 43.6 32.6 26.7 31.2 23.2 20.5 26.7 15.6 Household siz
e, median (IQR)
2 (2–3) 3 (2–4) 2 (2–2) 2 (2–3) 3 (2–4) 2 (2–2) 2 (1–3) 3 (2–4) 2 (1–2) 2 (2–4) 3 (2–4) 2 (2–3) A
t least one child aged
< 18 y ears in household (y es) 27.7 55.2 11.7 26.6 55.4 10.5 33.5 51.2 19.8 37.5 59.1 20.3 M ar ital status M ar
ried/living as mar
ried 75.5 79.6 73.1 78.1 82.6 75.6 53.6 57.1 51.0 68.2 76.2 61.9 Div or ced/separat ed/wido w ed 19.0 13.1 22.5 17.4 11.6 20.6 32.4 24.1 38.9 24.7 15.6 31.9 Single/ne ver mar ried 5.47 7.31 4.40 4.55 5.86 3.82 14.0 18.8 10.2 7.12 8.23 6.24
Health behaviors Smok
ing status C ur rent 7.67 8.47 7.20 7.59 8.54 7.06 9.28 8.47 9.91 6.25 7.49 5.27 F or mer 35.0 23.4 38.8 36.6 30.3 40.2 25.2 17.5 31.1 22.9 20.0 25.2 Ne ver 57.3 63.2 54.0 55.8 61.2 52.8 65.6 74.0 60.0 70.9 72.5 69.6
Alcohol consumption (past 12
months) Hea vy (> 7 dr inks/w eek) 11.3 11.2 11.5 12.3 12.3 12.4 4.69 4.73 4.65 5.22 6.02 4.59 Light/moderat e ( ≤ 7 dr inks/w eek) 71.2 74.5 69.3 71.9 75.3 70.0 66.7 70.3 63.9 66.4 70.5 63.1 Nondr ink er (ne ver/f or mer) 17.5 14.3 19.3 15.8 12.4 17.6 28.7 25.0 31.5 28.4 23.5 32.3 ME Ts ‑hours/w eek ± SD 50.9 ± 31.1 50.3 ± 31.1 51.3 ± 31.2 51.5 ± 31.2 51.0 ± 31.3 51.8 ± 31.2 45.4 ± 29.6 45.3 ± 29.7 45.4 ± 29.5 49.7 ± 30.8 48.2 ± 29.6 51.0 ± 31.8 Health
y Eating I
ndex scor e ± SD 62.3 ± 12.2 61.3 ± 12.0 62.8 ± 12.2 62.8 ± 12.2 61.8 ± 12.1 63.3 ± 12.2 58.6 ± 11.3 58.2 ± 10.9 58.9 ± 11.5 60.1 ± 11.8 59.8 ± 11.4 60.3 ± 12.2 Daily gly cemic load
, glucose scale
Table
1
(c
on
tinued)
Total N=
38,007 W hit e n = 32,925 (86.63%)
Black n =
3243 (8.53%) H ispanic/La tina n = 1839 (4.84%) Al l M enopausal sta tus Al l M enopausal sta tus Al l M enopausal sta tus Al l M enopausal sta tus Pr e-n = 13,988 36.8% Post -n = 24,019 63.2% Pr e-n = 11,757 35.7% Post -n = 21,168 64.3% Pr e-n = 1417 43.4% Post -n = 1826 56.3% Pr e-n = 814 44.3% Post -n = 1025 55.7%
Habitual sleep duration
cat
egor
y
A
Shor
t sleep duration (<
7 h) 28.3 27.5 28.7 25.3 24.1 26.0 53.1 52.7 53.3 37.4 33.3 40.6 R
ecommended sleep duration (7–9
h) 71.7 72.5 71.3 74.7 75.9 74.0 46.9 47.3 46.7 62.6 66.8 59.4 Inconsist ent w eek
ly sleep patt
er ns (y es) 14.2 11.6 15.8 13.2 10.4 14.8 21.1 18.6 23.1 20.0 16.4 22.8
Sleep debt (y
es) 25.1 28.5 23.2 23.8 27.0 22.0 34.1 37.2 31.7 33.2 34.9 31.7 Napping ≥ 3 times/w eek (y es) 9.58 7.22 11.0 9.04 6.64 10.4 13.3 10.7 15.3 12.7 9.71 15.1 Insomnia sympt oms (y es) 26.0 21.8 28.4 24.7 20.3 27.2 33.3 30.3 35.6 35.4 29.8 39.8 Difficult
y falling asleep (y
es) 17.1 14.6 18.5 15.4 12.8 16.9 27.4 25.1 29.3 28.4 23.1 32.5 Difficult y sta
ying asleep (y
es) 13.1 10.3 14.8 13.2 10.3 14.8 11.5 9.33 13.1 14.5 12.0 16.6 Shor
t sleep duration and insomnia
sympt oms (y es) 11.4 9.78 12.3 9.98 8.15 11.0 21.9 20.5 23.0 18.0 14.7 20.6 M ean cumulativ
e sleep scor
e ± SD 1.03 ± 1.15 0.966 ± 1.12 1.07 ± 1.17 0.958 ± 1.12 0.883 ± 1.07 1.00 ± 1.14 1.54 ± 1.27 1.49 ± 1.25 1.59 ± 1.28 1.38 ± 1.23 1.24 ± 1.20 1.50 ± 1.25
Sleep medication use (y
es) 23.7 19.9 25.9 24.5 20.4 26.7 16.3 15.2 17.2 22.1 20.0 23.8 Clinic al char acteristics M ean BMI ± SD (k g/m 2) 27.6 ± 6.12 27.3 ± 6.30 27.8 ± 6.00 27.2 ± 5.94 26.8 ± 6.00 27.5 ± 5.88 31.2 ± 6.93 31.1 ± 7.46 31.2 ± 6.50 28.2 ± 5.73 27.9 ± 5.92 28.4 ± 5.57 Under w eight (< 18.5 k g/m 2) 1.12 1.19 1.09 1.22 1.31 1.18 0.37 0.49 0.27 0.65 0.61 0.68 Nor mal w eight (18.5–24.9 k g/m 2) 38.3 42.7 35.7 40.8 45.9 38.0 17.0 19.8 14.7 31.4 36.5 27.3 O ver w eight (25.0–29.9 k g/m 2) 31.6 29.0 33.1 31.2 28.4 32.8 31.8 30.8 32.6 37.4 33.3 31.4 Obese ( ≥ 30.0 k g/m 2) 29.0 27.1 30.1 26.8 24.3 28.1 50.9 48.8 52.4 30.6 29.6 31.4 Ph ysician ‑diag
nosed clinical depr
ession
or bipolar disor
der (y es) 19.9 18.9 20.5 20.2 19.5 20.6 15.3 13.5 16.7 22.5 18.9 25.3 Hor mone r eplacement therap
y use (y
es) 10.3 11.7 14.4 10.9 3.44 15.0 6.85 2.33 10.4 6.09 2.33 9.07 Postmenopausal (y es) 63.2 – 100 64.3 0 100 56.3 0 100 55.7 0 100
Natural menopause (y
es) 63.9 – 63.9 65.2 – 65.2 50.3 – 50.3 61.2 – 61.2
Use of lipid contr
ol medications (y
es) 18.4 7.45 24.8 18.5 7.23 24.7 17.9 8.54 25.2 18.5 8.72 26.2 M etabolic Abnor malities
, median (IQR)
1 (0–2) 1 (0–1) 1 (0–2) 1 (0–2) 0 (0–1) 1 (0–2) 2 (1–2) 1 (0–2) 2 (1–3) 1 (0–2) 1 (0–1) 1 (1–2) H yper
tension as defined b
y or ig inal definition (y es) B 30.3 18.5 37.2 28.5 16.0 35.4 49.5 39.2 57.5 29.6 18.7 38.3 H yper
tension as defined b
Table
1
(c
on
tinued)
Total N=
38,007 W hit e n = 32,925 (86.63%)
Black n =
3243 (8.53%) H ispanic/La tina n = 1839 (4.84%) Al l M enopausal sta tus Al l M enopausal sta tus Al l M enopausal sta tus Al l M enopausal sta tus Pr e-n = 13,988 36.8% Post -n = 24,019 63.2% Pr e-n = 11,757 35.7% Post -n = 21,168 64.3% Pr e-n = 1417 43.4% Post -n = 1826 56.3% Pr e-n = 814 44.3% Post -n = 1025 55.7% Abdominal obesit y (y es) 39.4 35.0 42.0 37.2 32.4 39.9 59.1 54.3 62.9 43.8 38.9 47.6 D yslipidemia (y es) 32.8 19.3 40.7 32.4 18.4 40.1 33.8 22.9 42.2 38.7 24.7 59.9 Pr ediabet
es or t
ype 2 diabet
es mellitus (y es) 6.99 4.28 8.56 6.00 3.47 7.40 14.3 8.82 18.5 12.0 8.11 15.0 M etabolic Abnor malities consist ent with M etS (y es) C 11.9 5.63 15.5 10.8 4.60 14.2 21.3 12.4 28.2 15.4 8.72 20.8 M etabolic Abnor malities consist ent with M etS (y es) D 13.3 6.68 17.1 12.1 35.7 64.3 22.6 13.3 29.9 17.0 9.58 22.9 Da ta pr esen
ted as %, median and IQR, or mean
± SD . P er cen tages ma
y not sum t
o 100 due t
o r
ounding
Pr
opor
tion emplo
yed is calcula
ted as: number emplo
yed/(number emplo yed + unemplo yed + homemaker + studen t + retir ed). Health y Ea ting I nde x sc or es r ange fr
om 0 t
o 100 with higher sc
or
es indica
ting a healthier
diet [
38
]. P
ropor
tion of na
tur
al menopause is calcula
ted as: number r
epor
ting na
tur
al menopause/all w
omen r epor ting menopause Inc onsist en t w eek
ly sleep pa
tt
er
ns indica
ted whether par
ticipan ts r epor ted c onsist en t (c ould v ar y da y-b y-da
y but w
er
e stable fr
om w
eek
-t
o-w
eek) or inc
onsist
en
t w
ake
-up times and bedtimes dur
ing the pr
ior 6 w
eeks
.
Sleep debt w
as defined as
≥ 2-h diff er enc e bet w een a ver
age longest and shor
test sleep dur
ation. I
nsomnia sympt
oms included difficult
y falling asleep
, defined as tak
ing > 30 min v s. ≤ 30 min t
o fall asleep on a
ver age , or difficult y sta ying asleep
, defined as w
ak
ing up
≥
3 times per nigh
t ≥ 3 nigh ts/w eek v s. <
3 times per nigh
t < 3 nigh ts/w eek v s. neither . C umula tiv
e sleep sc
or
e w
as the sum of y
es r
esponses t
o the main sleep char
ac
ter
istics
(shor
t sleep dur
ation, inc
onsist
en
t w
eek
ly sleep pa
tt
er
ns
, sleep debt
, fr
equen
t napping
, and insomnia sympt
oms [r ange: 0–5]) M issing ness: < 0.2% f
or household siz
e, number of childr
en in household
, mar
ital sta
tus
, BMI/BMI ca
tegor
y, gly
cemic load
, sleep medica
tion use
, habitual sleep dur
ation ca
tegor
y, c
onsist
en
t sleep pa
tt
er
n, sleep debt
,
napping
, insomnia sympt
oms
, difficult
y falling asleep
, difficult
y sta
ying asleep
, cumula
tiv
e sleep sc
or
e; 0% f
or age , educa tional a ttainmen t, cur ren t emplo ymen
t, annual household inc
ome , smok ing sta tus , alc ohol consumption, ME Ts-hours/w eek , Health y Ea ting I nde x S cor
e, clinical depr
ession/bipolar disor der , hor mone r eplac emen t ther ap y use
, menopausal sta
tus
, number of baseline metabolic abnor
malities/M etS, h yper tension, abdominal obesit y, dy slipidemia, bor der line/t
ype 2 diabet
es mellitus SD standar d devia tion, IQR in ter quar tile r ange , BMI
body mass inde
x, MET s metabolic equiv alen t, MetS metabolic syndr ome
A P
ar
ticipan
ts who r
epor
ted long sleep dur
ation (>
9 h) w
er
e e
xcluded due t
o small sample siz
e (n
=
349)
B Or
ig
inal definition (sy
st
olic blood pr
essur
e (blood pr
essur
e)
>
130 mmHg or diast
olic BP
>
85 mmHg) as defined b
y A
lber
ti et al
. [
35
] and new guidelines r
ef
er t
o the sta
temen
t of the A
mer
ican C
ollege of C
ar diology/ A mer ican Hear t A ssocia tion Task F or
ce (2017) (sy
st
olic BP
>
130 mmHg or diast
olic BP
>
80 mmHg)
C M
etabolic abnor
malities c
onsist
en
t with M
etS w
er
e based on an adapt
ed v
ersion of the har
moniz
ed definition f
or M
etS [
35
]: the pr
esenc
e of thr
ee or mor
e individual metabolic abnor
malities (i.e ., h yper tension, abdominal obesit y, dy slipidemia, h yper gly cemia)
D A
dapt
ed har
moniz
ed definition of M
etS applying the A
mer
ican C
ollege of C
ar diology/A mer ican Hear t A ssocia tion Task F or
ce (2017) guidelines f
or h
yper
tension [
45
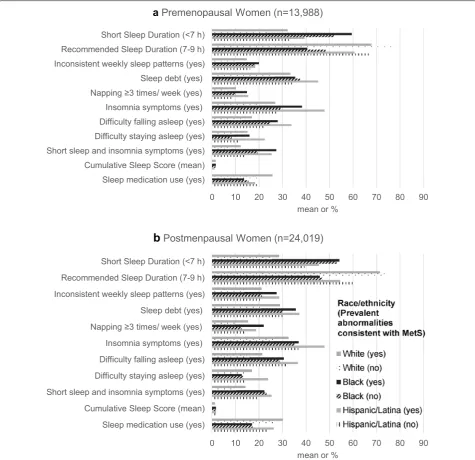
among premenopausal women, particularly among
blacks (Fig. 1). After adjusting for potential
confound-ers, associations between certain poor sleep
characteris-tics, including short sleep duration, insomnia symptoms,
difficulty staying asleep, concurrent short sleep duration and insomnia symptoms, and MetS were stronger among premenopausal compared to postmenopausal women; however, positive associations were similar regardless of
menopausal status for inconsistent weekly sleep patterns,
sleep debt, napping, difficulty falling asleep, and sleep score
(Table 2). Premenopausal women reporting short sleep
duration had 23% higher prevalence of MetS (PR = 1.23
[95% CI 1.06–1.42]) compared to their counterparts reporting recommended sleep duration, but there was 9% higher prevalence of MetS among postmenopausal
women who reported short sleep (PR = 1.09 [1.02–1.16],
pshort sleep*menopause= 0.0070). Compared to counterparts
without insomnia symptoms, premenopausal women with
insomnia symptoms had a 21% higher prevalence of MetS
(PR = 1.21 [1.05–1.41]) and postmenopausal women with
insomnia symptoms had a 11% higher prevalence of MetS
(PR = 1.11 [1.05–1.18], pinsomnia symptoms*menopause= 0.035).
Although relationships between difficulty falling asleep
and MetS did not vary by menopausal status, difficulty
staying asleep varied by menopausal status: difficulty staying asleep was associated with a 33% higher
preva-lence of MetS among premenopausal women (PR = 1.33
[1.11–1.59]) but was not associated with MetS among
postmenopausal women (PR = 1.07 [0.99–1.16], pdifficulty
staying asleep*menopause=0.0074). Only relationships for
short sleep duration and insomnia symptoms varied by
menopausal status (PRpremenopausal= 1.25 [1.04–1.50],
PRpostmenopausal= 1.12 [1.03–1.21], pshort sleep duration/insom-nia symptoms*menopause= 0.027) and race/ethnicity (pshort sleep duration/insomnia symptoms*race/ethnicity < 0.05). White and
His-panic/Latina women who reported concurrent short sleep
duration and insomnia symptoms had higher prevalence of MetS compared to their within-race counterparts; however, there was no association among black meno-pausal women.
Results of the sensitivity analyses are presented in
Additional file 1: Tables S1–S9. Although prevalence
ratios were slightly attenuated, overall findings were consistent after adjustment for use of lipid-regulating
medications (Additional file 1: Table S1). Among all
post-menopausal women, associations between sleep char-acteristics and MetS were similar between women who reported natural and non-natural menopause
(Addi-tional file 1: Table S2). After application of an 80 mmHg
cut-point for hypertension, associations between sleep characteristics and MetS prevalence were consistent
with results for original BP cut-points (Additional file 1:
Table S3). Among premenopausal women, PR’s for most
poor sleep characteristics were higher when the analysis was restricted to participants with no sleep medication use; however, among all postmenopausal women, PR’s were comparable irrespective of sleep medication use
(Additional file 1: Table S4). Nonetheless, data suggested
some variation by sleep medication use among blacks and Hispanics/Latinas. After mutual adjustment for indi-vidual sleep characteristics in models, results for short
sleep duration were robust for short sleep duration and
insomnia symptoms: each was more strongly associated with MetS among premenopausal women (Additional
file 1: Table S5). Consistently, associations between short
sleep duration, insomnia-related symptoms, and most individual MetS components (hypertension, abdominal obesity, and dyslipidemia) were stronger among pre-menopausal compared to postpre-menopausal women
(Addi-tional file 1: Tables S6–S9). Notably, associations between
poor sleep and abdominal obesity were often strongest for whites among premenopausal women and strongest for Hispanics/Latinas among postmenopausal women
(Additional file 1: Table S7).
Discussion
In this large study of white, black, and Hispanic/Latina women aged 35–74 years, short sleep duration and insomnia symptoms were positively associated with prevalent MetS. These associations were stronger among premenopausal compared to postmenopausal women. Furthermore, among postmenopausal women, relation-ships between concurrent short sleep and insomnia symptoms and MetS were stronger among Hispanics/ Latinas and whites. We observed no other racial/ethnic differences in the relationship between sleep and MetS. Pre- and post-menopausal women who reported no con-sistent weekly sleep pattern, sleep debt, frequent nap-ping, and difficulty falling asleep had similarly higher prevalence of MetS. Our findings were robust after sen-sitivity analyses.
Our finding that poor sleep characteristics were associ-ated with greater MetS prevalence is consistent with prior studies. Meta-analyses and a prospective study reported positive associations between short sleep duration and MetS as well as a dose–response relationship where odds of MetS increased with decreases in sleep duration [6, 7, 17, 31, 32]. Similarly, several cross-sectional stud-ies across geographically and ethnically diverse popula-tions observed positive relapopula-tionships between poor sleep, including sleep disturbances and difficulty staying asleep,
and prevalent MetS [9–11, 13]. These prior studies often
cross-sectional studies of participants in Spain, Japan, and China as well as a prospective study among black and white men and women aged 45–74 years in Pittsburgh observed relationships between difficulty falling asleep
and MetS [11–14]. The conflicting results could be due
to differences in population characteristics and measure-ment of sleep and MetS. However, our results remain biologically plausible.
0 10 20 30 40 50 60 70 80 90
Sleep medication use (yes) Cumulative Sleep Score (mean) Short sleep and insomnia symptoms (yes) Difficulty staying asleep (yes) Difficulty falling asleep (yes) Insomnia symptoms (yes) Napping ≥3 times/ week (yes) Sleep debt (yes) Inconsistent weekly sleep patterns (yes)
Recommended Sleep Duration (7-9 h) Short Sleep Duration (<7 h)
mean or %
a Premenopausal Women (n=13,988)
0 10 20 30 40 50 60 70 80 90
Sleep medication use (yes) Cumulative Sleep Score (mean) Short sleep and insomnia symptoms (yes) Difficulty staying asleep (yes) Difficulty falling asleep (yes) Insomnia symptoms (yes) Napping ≥3 times/ week (yes) Sleep debt (yes) Inconsistent weekly sleep patterns (yes)
Recommended Sleep Duration (7-9 h) Short Sleep Duration (<7 h)
mean or %
b
Postmenpausal Women (n=24,019)Fig. 1 Prevalence of sleep characteristics by race/ethnicity and metabolic abnormalities consistent with metabolic syndrome (MetS) among a
Poor sleep is hypothesized to affect each individual component of MetS through several distinct
biologi-cal pathways [18, 24]. For instance, lack of adequate
sleep can alter homeostatic functioning, result in greater caloric intake by increasing appetite through dysregula-tion of hormones that increase hunger and decrease
sati-ety, and lead to lower physical activity due to fatigue [18,
24]. Poor sleep can also affect glucose homeostasis and
experimental evidence has shown that sleep restriction can induce insulin resistance likely through inflamma-tory pathways and epigenetic changes to the expression of circadian clock genes that regulate biological processes
[18, 24]. Furthermore, sleep restriction raises blood
pres-sure through multiple potential mechanisms like higher
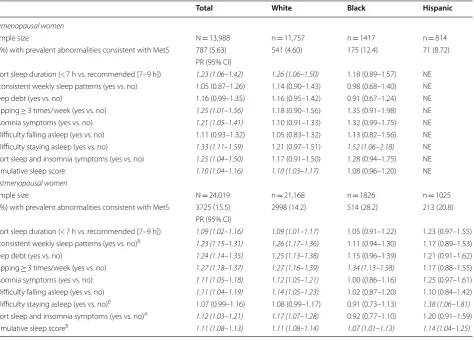
Table 2 Adjusted prevalence ratios for metabolic abnormalities consistent with metabolic syndrome for pre- and post-menopausal women with poor sleep compared to women with recommended sleep, sister study (2003–2009), N = 38,007
Pshort sleep*menopausal status= 0.0070; Pconsistent sleep*menopausal status= 0.71; Psleep debt*menopausal status= 0.27; Pnapping*menopausal status= 0.38; Pinsomnia symptoms*menopausal status= 0.035;
Pdifficulty falling asleep*menopausal status= 0.32; Pdifficulty staying asleep*menopausal status= 0.0074; Pshort sleep and insomnia symptoms*menopausal status= 0.027; Psleep score *menopausal status= 0.15
Adjusted for age at baseline (years), educational attainment (≤ high school graduate/graduation equivalent degree, some college/technical school/associate’s degree,
≥ college graduate), annual household income (< $20,000, $20,000–$49,999, $50,000–$99,999, ≥ $100,000), diet quality (Healthy Eating Index score [38]), physical activity (METs [metabolic equivalent] hours per week), use of hormone replacement therapy (yes vs. no), alcohol consumption (nondrinker [former/never], light/ moderate [≤ 7 drinks/week], heavy [> 7 drinks/week]), smoking status (never, former, current), clinical depression or bipolar disorder (yes vs. no), and sleep medication use (yes vs. no). Models for sleep debt are also adjusted for consistent weekly sleep patterns (no vs. yes)
Inconsistent weekly sleep patterns indicated whether participants reported consistent (could vary day-by-day but were stable from week-to-week) or inconsistent wake-up times and bedtimes during the prior 6 weeks. Sleep debt was defined as ≥ 2-h difference between average longest and shortest sleep duration. Insomnia symptoms included difficulty falling asleep, defined as taking > 30 min vs. ≤ 30 min to fall asleep on average, or difficulty staying asleep, defined as waking up ≥ 3 times per night ≥ 3 nights/week vs. < 3 times per night < 3 nights/week vs. neither. Cumulative sleep score was the sum of yes responses to the main sleep characteristics (short sleep duration, inconsistent weekly sleep patterns, sleep debt, frequent napping, and insomnia symptoms [range: 0–5])
< 0.2% missingness for sleep medication use, habitual sleep duration category, consistent sleep pattern, sleep debt, napping, insomnia symptoms, difficulty falling asleep, difficulty staying asleep, cumulative sleep score
MetS metabolic syndrome, PR prevalence ratio, CI confidence interval, h hours, NE not estimable Italic values indicate statistical significance at two-sided p = 0.05
A p < 0.05 for interaction term (sleep variable by race/ethnicity) B p < 0.10 for interaction term (sleep variable by race/ethnicity)
Total White Black Hispanic
Premenopausal women
Sample size N = 13,988 n = 11,757 n = 1417 n = 814
n (%) with prevalent abnormalities consistent with MetS 787 (5.63) 541 (4.60) 175 (12.4) 71 (8.72) PR (95% CI)
Short sleep duration (< 7 h vs. recommended [7–9 h]) 1.23 (1.06–1.42) 1.26 (1.06–1.50) 1.18 (0.89–1.57) NE Inconsistent weekly sleep patterns (yes vs. no) 1.05 (0.87–1.26) 1.14 (0.90–1.43) 0.98 (0.68–1.40) NE
Sleep debt (yes vs. no) 1.16 (0.99–1.35) 1.16 (0.95–1.42) 0.91 (0.67–1.24) NE
Napping ≥ 3 times/week (yes vs. no) 1.25 (1.01–1.56) 1.18 (0.90–1.56) 1.35 (0.91–1.98) NE Insomnia symptoms (yes vs. no) 1.21 (1.05–1.41) 1.10 (0.91–1.33) 1.32 (0.99–1.75) NE Difficulty falling asleep (yes vs. no) 1.11 (0.93–1.32) 1.05 (0.83–1.32) 1.13 (0.82–1.56) NE Difficulty staying asleep (yes vs. no) 1.33 (1.11–1.59) 1.21 (0.97–1.51) 1.52 (1.06–2.18) NE Short sleep and insomnia symptoms (yes vs. no) 1.25 (1.04–1.50) 1.17 (0.91–1.50) 1.28 (0.94–1.75) NE
Cumulative sleep score 1.10 (1.04–1.16) 1.10 (1.03–1.17) 1.08 (0.96–1.20) NE
Postmenopausal women
Sample size N = 24,019 n = 21,168 n = 1826 n = 1025
n (%) with prevalent abnormalities consistent with MetS 3725 (15.5) 2998 (14.2) 514 (28.2) 213 (20.8) PR (95% CI)
catecholamine production and hyperactivity of the
sym-pathetic nervous system [18]. Subjective sleep
character-istics are likely reflective of inadequate sleep and sleep deprivation, and these pathways could explain our obser-vations. Nonetheless, objective measures of sleep and MetS coupled with biomarkers of physiological function-ing are necessary.
Our finding that poor sleep was more strongly asso-ciated with MetS among premenopausal compared to postmenopausal women may be due to biological dif-ferences between premenopausal and postmenopausal women. The menopausal transition negatively affects sleep and leads to increased insomnia, which tends to
continue post-transition [28]. Additionally,
postmeno-pausal women have greater cardiovascular disease risk compared to premenopausal women likely due to the
decline of sex hormones, namely estrogen [29, 30]. Prior
studies have also shown higher prevalence of sleep-dis-ordered breathing (SDB) among postmenopausal women
compared to premenopausal women [33, 46].
Preva-lent SDB among postmenopausal women could explain higher prevalence of both poor sleep and MetS observed in this group in our cross-sectional study. It is possible that the greater likelihood of both poor sleep and MetS among postmenopausal women results in weaker relative associations compared to premenopausal women.
Among postmenopausal women, our findings that associations between concurrent short sleep duration/ insomnia symptoms and MetS were stronger among His-panic/Latina and white postmenopausal women com-pared to their black counterparts, require additional investigation. Data suggested that associations between concurrent short sleep/insomnia symptoms and the MetS component abdominal obesity were strongest among Hispanics/Latinas. Our MetS findings may have captured racial/ethnic differences in associations between sleep and abdominal obesity. Recent prior studies consisting of similarly aged US women lacked Hispanic/Latina
partici-pants [8, 14]. More racially/ethnically diverse prospective
studies are warranted.
This study has limitations as well as important strengths. This study was limited by its cross-sectional study design, which precluded our ability to infer causal relationships between poor sleep and MetS. Secondly, we relied on self-reported measures for sleep character-istics, dyslipidemia, and borderline/T2DM; however, all women were of higher SES and racial/ethnic differences in health care access and utilization necessary for diag-noses would be it is less likely. Self-reported sleep dura-tion has been shown to be overestimated compared to objectively-measured sleep duration through wrist
actig-raphy and polysomnogactig-raphy [47]. Although
measure-ment error could vary by race/ethnicity, it is generally
non-differential and likely leads to underestimation of relationships between poor sleep and MetS among all
participants [48]. Furthermore, sleep characteristics
were not assessed using standardized questionnaires; as a result, our assessment of sleep characteristics may be limited due to lack of psychometric validation. We also lacked data on SDB and sleep apnea, a sleep disorder that could affect measured sleep characteristics and MetS as well as partially explain observed associations,
particu-larly between difficulty staying asleep and MetS [8, 14].
Therefore, future studies inclusive of clinical diagnoses of MetS and objective sleep measures including sleep apnea are necessary. Thirdly, we did not study perimenopause;
but, future studies should consider perimenopause [29].
Fourth, the lower sample size among premenopausal women and non-whites resulted in limited power to esti-mate relationships and to test effect modification. Future research with greater diversity and consideration of eth-nic subgroups is needed as sleep characteristics have
been shown to differ by ethnic group [26]. Lastly, due to
the testing of multiple associations, results could be due to chance. Despite these limitations, we used data from a large cohort of US women, which allowed for stratifi-cation by menopausal status and race/ethnicity. We also investigated multiple sleep characteristics beyond sleep duration, included objective measures for abdominal obesity and hypertension, and adjusted for many poten-tial confounders. Furthermore, our results were robust as demonstrated by the consistent relationships observed in sensitivity analysis.
Conclusions
Additional file
Additional file 1: Figure S1. Composition of Analytic Sample. Table S1.
Additionally Adjusted (for Use of Medication for Dyslipidemia) Prevalence Ratios for Metabolic Abnormalities Consistent with Metabolic Syndrome for Pre‑ and Post‑Menopausal Women with Poor Sleep Compared to Women with Recommended Sleep, Sister Study (2003‑2009), N = 38,007.
Table S2. Adjusted Prevalence Ratios of Metabolic Abnormalities Consist‑ ent with Metabolic Syndrome for Poor Sleep Compared to Recommended Sleep among Postmenopausal Women, Stratified by Type of Menopause, Sister Study (2003‑2009), N = 24,019. Table S3. Adjusted Prevalence Ratios of Metabolic Abnormalities Consistent with Metabolic Syndrome for Pre‑ and Post‑Menopausal Women with Poor Sleep Compared to Women with Recommended Sleep using Elevated Diastolic Blood Pressure Cut Point of ≥ 80 mmHg, Sister Study (2003‑2009), N = 38,007. Table S4. Adjusted Prevalence Ratios of Metabolic Abnormalities Consistent with Metabolic Syndrome for Pre‑ and Post‑Menopausal Women with Poor Sleep Com‑ pared to Women with Recommended Sleep Stratified by Sleep Medica‑ tion Use, Sister Study (2003‑2009), N = 38,007. Table S5. Additionally Adjusted (for other sleep characteristics) Prevalence Ratios of Metabolic Abnormalities Consistent with Metabolic Syndrome for Pre‑ and Post‑ Menopausal Women with Poor Sleep Compared to Women with Recom‑ mended Sleep, Sister Study (2003‑2009), N = 38,007. Table S6. Adjusted Prevalence Ratios of Hypertension for Pre‑ and Post‑Menopausal Women with Poor Sleep Compared to Women with Recommended Sleep, Sister Study (2003‑2009), N = 38,007. Table S7. Adjusted Prevalence Ratios of Abdominal Obesity for Pre‑ and Post‑Menopausal Women with Poor Sleep Compared to Women with Recommended Sleep, Sister Study (2003‑2009), N = 38,007. Table S8. Adjusted Prevalence Ratios of Dyslipidemia for Pre‑ and Post‑Menopausal Women with Poor Sleep Compared to Women with Recommended Sleep, Sister Study (2003‑2009), N = 38,007. Table S9.
Adjusted Prevalence Ratios of Prediabetes/Type 2 Diabetes Mellitus (T2DM) for Pre‑ and Post‑Menopausal Women with Poor Sleep Compared to Women with Recommended Sleep, Sister Study (2003‑2009), N=38,007.
Abbreviations
MetS: metabolic syndrome; BP: blood pressure; T2DM: type 2 diabetes mel‑ litus; HEI: healthy eating index; SDB: sleep‑disordered breathing.
Authors’ contributions
Study concept and design: CLJ, SAG. Acquisition of data: DPS. Statistical analy‑ sis and expertise: SAG, Y‑MP. Interpretation of data: SAG, Y‑MP, KLM, DPS, CLJ. Drafting of the manuscript: SAG. Critical revision of the manuscript for impor‑ tant intellectual content: SAG, Y‑MP, KLM, DPS, CLJ. Administrative, technical, and material support: DPS, CLJ. Obtaining funding and study supervision: DPS, CLJ. All authors read and approved the final manuscript.
Author details
1 Epidemiology Branch, Department of Health and Human Services, National
Institute of Environmental Health Sciences, National Institutes of Health, Research Triangle Park, NC, USA. 2 Intramural Program, Department of Health
and Human Services, National Institute of Minority Health and Health Dispari‑ ties, National Institutes of Health, Bethesda, MD, USA.
Acknowledgements
This research was presented, in part, at the Epidemiology and
Prevention|Lifestyle and Cardiometabolic Health 2018 Scientific Sessions in New Orleans, Louisiana from March 20–23, 2018. We would like to thank Dr. Sanjay R. Patel for his useful suggestions regarding an earlier draft.
Competing interests
The authors declare that they have no competing interests.
Availability of data and materials
The datasets generated during and/or analyzed during the current study are not publicly available due to privacy concerns. However, proposals for collabo‑ rative studies of the data can be submitted and reviewed by the Sister Study.
Consent for publication
Not applicable.
Ethics approval and consent to participate
The National Institute of Environmental Health Sciences Institutional Review Board and the Copernicus Group Independent Review Board approved the Sister Study protocol, and all participants provided informed consent.
Funding
This work was funded by the Intramural Program at the NIH, National Institute of Environmental Health Sciences [Z1AES103325‑01 (CLJ) and Z01ES044005 (DPS)].
Publisher’s Note
Springer Nature remains neutral with regard to jurisdictional claims in pub‑ lished maps and institutional affiliations.
Received: 29 November 2018 Accepted: 7 February 2019
References
1. Reaven GM. Role of insulin resistance in human disease (syndrome X): an expanded definition. Annu Rev Med. 1993;44:121–31.
2. Mottillo S, Filion KB, Genest J, Joseph L, Pilote L, Poirier P, et al. The metabolic syndrome and cardiovascular risk a systematic review and meta‑analysis. J Am Coll Cardiol. 2010;56(14):1113–32.
3. Moore JX, Chaudhary N, Akinyemiju T. Metabolic syndrome prevalence by race/ethnicity and sex in the united states, national health and nutri‑ tion examination survey, 1988–2012. Prev Chronic Dis. 2017;14:E24. 4. Benjamin EJ, Blaha MJ, Chiuve SE, Cushman M, Das SR, Deo R, et al. Heart
disease and stroke statistics‑2017 update: a report from the American heart association. Circulation. 2017;135(10):e146–603.
5. Cappuccio FP, Taggart FM, Kandala NB, Currie A, Peile E, Stranges S, et al. Meta‑analysis of short sleep duration and obesity in children and adults. Sleep. 2008;31(5):619–26.
6. Iftikhar IH, Donley MA, Mindel J, Pleister A, Soriano S, Magalang UJ. Sleep duration and metabolic syndrome. An updated dose‑risk metaanalysis. Ann Am Thorac Soc. 2015;12(9):1364–72.
7. Xi B, He D, Zhang M, Xue J, Zhou D. Short sleep duration predicts risk of metabolic syndrome: a systematic review and meta‑analysis. Sleep Med Rev. 2014;18(4):293–7.
8. Hall MH, Okun ML, Sowers M, Matthews KA, Kravitz HM, Hardin K, et al. Sleep is associated with the metabolic syndrome in a multi‑ethnic cohort of midlife women: the SWAN sleep study. Sleep. 2012;35(6):783–90. 9. Hung HC, Yang YC, Ou HY, Wu JS, Lu FH, Chang CJ. The association
between self‑reported sleep quality and metabolic syndrome. PLoS ONE. 2013;8(1):e54304.
10. Lee J, Choi YS, Jeong YJ, Lee J, Kim JH, Kim SH, et al. Poor‑quality sleep is associated with metabolic syndrome in Korean adults. Tohoku J Exp Med. 2013;231(4):281–91.
11. Lin SC, Sun CA, You SL, Hwang LC, Liang CY, Yang T, et al. The link of self‑reported insomnia symptoms and sleep duration with metabolic syndrome: a chinese population‑based study. Sleep. 2016;39(6):1261–6. 12. Mesas AE, Guallar‑Castillon P, Lopez‑Garcia E, Leon‑Munoz LM, Graciani A,
Banegas JR, et al. Sleep quality and the metabolic syndrome: the role of sleep duration and lifestyle. Diabetes Metab Res Rev. 2014;30(3):222–31. 13. Okubo N, Matsuzaka M, Takahashi I, Sawada K, Sato S, Akimoto N, et al.
Relationship between self‑reported sleep quality and metabolic syn‑ drome in general population. BMC Public Health. 2014;14:562. 14. Troxel WM, Buysse DJ, Matthews KA, Kip KE, Strollo PJ, Hall M, et al. Sleep
symptoms predict the development of the metabolic syndrome. Sleep. 2010;33(12):1633–40.
15. Yoo H, Franke WD. Sleep habits, mental health, and the meta‑ bolic syndrome in law enforcement officers. J Occup Environ Med. 2013;55(1):99–103.
•fast, convenient online submission
•
thorough peer review by experienced researchers in your field
• rapid publication on acceptance
• support for research data, including large and complex data types
•
gold Open Access which fosters wider collaboration and increased citations maximum visibility for your research: over 100M website views per year
•
At BMC, research is always in progress.
Learn more biomedcentral.com/submissions
Ready to submit your research? Choose BMC and benefit from:
syndrome: the qazvin metabolic diseases study (QMDS), Iran. Diabetes Metab Syndr. 2017;11(Suppl 1):S377–80.
17. Kim JY, Yadav D, Ahn SV, Koh SB, Park JT, Yoon J, et al. A prospective study of total sleep duration and incident metabolic syndrome: the ARIRANG study. Sleep Med. 2015;16(12):1511–5.
18. Koren D, Dumin M, Gozal D. Role of sleep quality in the metabolic syn‑ drome. Diabetes Metab Syndr Obes. 2016;9:281–310.
19. Buxton OM, Cain SW, O’Connor SP, Porter JH, Duffy JF, Wang W, et al. Adverse metabolic consequences in humans of prolonged sleep restriction combined with circadian disruption. Sci Transl Med. 2012;4(129):129ra43.
20. Van Cauter E, Spiegel K, Tasali E, Leproult R. Metabolic consequences of sleep and sleep loss. Sleep Med. 2008;9(Suppl 1):S23–8.
21. Liu Y, Wheaton AG, Chapman DP, Cunningham TJ, Lu H, Croft JB. Prevalence of healthy sleep duration among adults‑United States, 2014. MMWR Morb Mortal Wkly Rep. 2016;65(6):137–41.
22. Hirshkowitz M, Whiton K, Albert SM, Alessi C, Bruni O, DonCarlos L, et al. National sleep foundation’s updated sleep duration recommendations: final report. Sleep Health. 2015;1(4):233–43.
23. NCHS. Health, United States, Health, United State6: with chartbook on long‑term trends in health. NCHS: Hyattsville; 2017.
24. Jackson CL, Redline S, Emmons KM. Sleep as a potential fundamental contributor to disparities in cardiovascular health. Annu Rev Public Health. 2015;36:417–40.
25. Jackson CL. Determinants of racial/ethnic disparities in disordered sleep and obesity. Sleep Health. 2017;3(5):401–15.
26. Grandner MA, Williams NJ, Knutson KL, Roberts D, Jean‑Louis G. Sleep disparity, race/ethnicity, and socioeconomic position. Sleep Med. 2016;18:7–18.
27. Freedman RR. Menopause and sleep. Menopause. 2014;21(5):534–5. 28. Baker FC, de Zambotti M, Colrain IM, Bei B. Sleep problems during the
menopausal transition: prevalence, impact, and management challenges. Nat Sci Sleep. 2018;10:73–95.
29. Pu D, Tan R, Yu Q, Wu J. Metabolic syndrome in menopause and associ‑ ated factors: a meta‑analysis. Climacteric. 2017;20(6):583–91.
30. van Dijk GM, Kavousi M, Troup J, Franco OH. Health issues for menopau‑ sal women: the top 11 conditions have common solutions. Maturitas. 2015;80(1):24–30.
31. Chaput JP, McNeil J, Despres JP, Bouchard C, Tremblay A. Seven to eight hours of sleep a night is associated with a lower prevalence of the meta‑ bolic syndrome and reduced overall cardiometabolic risk in adults. PLoS ONE. 2013;8(9):e72832.
32. Choi JK, Kim MY, Kim JK, Park JK, Oh SS, Koh SB, et al. Association between short sleep duration and high incidence of metabolic syndrome in midlife women. Tohoku J Exp Med. 2011;225(3):187–93.
33. Heinzer R, Marti‑Soler H, Marques‑Vidal P, Tobback N, Andries D, Waeber G, et al. Impact of sex and menopausal status on the prevalence, clinical presentation, and comorbidities of sleep‑disordered breathing. Sleep Med. 2018;51:29–36.
34. Sandler DP, Hodgson ME, Deming‑Halverson SL, Juras PS, D’Aloisio AA, Suarez LM, et al. The sister study cohort: baseline methods and partici‑ pant characteristics. Environ Health Perspect. 2017;125(12):127003.
35. Alberti KG, Eckel RH, Grundy SM, Zimmet PZ, Cleeman JI, Donato KA, et al. Harmonizing the metabolic syndrome: a joint interim statement of the international diabetes federation task force on epidemiology and prevention; national heart, lung, and blood institute; American heart association; world heart federation; international atherosclerosis society; and international association for the study of obesity. Circulation. 2009;120(16):1640–5.
36. Ainsworth BE, Haskell WL, Whitt MC, Irwin ML, Swartz AM, Strath SJ, et al. Compendium of physical activities: an update of activity codes and MET intensities. Med Sci Sports Exerc. 2000;32(9 Suppl):S498–504.
37. Ainsworth BE, Haskell WL, Leon AS, Jacobs DR Jr, Montoye HJ, Sallis JF, et al. Compendium of physical activities: classification of energy costs of human physical activities. Med Sci Sports Exerc. 1993;25(1):71–80. 38. Guenther PM, Kirkpatrick SI, Reedy J, Krebs‑Smith SM, Buckman DW,
Dodd KW, et al. The healthy eating index‑2010 is a valid and reliable measure of diet quality according to the 2010 guidelines dietary for Americans. J Nutr. 2014;144(3):399–407.
39. Atkinson FS, Foster‑Powell K, Brand‑Miller JC. International tables of glycemic index and glycemic load values: 2008. Diabetes Care. 2008;31(12):2281–3.
40. Block G, Hartman AM, Dresser CM, Carroll MD, Gannon J, Gardner L. A data‑based approach to diet questionnaire design and testing. Am J Epidemiol. 1986;124(3):453–69.
41. USPSTF. Screening for obesity in adults: recommendations and rationale. Am Fam Physician. 2004;69(8):1973–6.
42. Grandner MA, Patel NP, Gehrman PR, Xie D, Sha D, Weaver T, et al. Who gets the best sleep? Ethnic and socioeconomic factors related to sleep complaints. Sleep Med. 2010;11(5):470–8.
43. Barros AJ, Hirakata VN. Alternatives for logistic regression in cross‑sec‑ tional studies: an empirical comparison of models that directly estimate the prevalence ratio. BMC Med Res Methodol. 2003;3(1):21.
44. Greenland S, Pearl J, Robins JM. Casual diagrams for epidemiologic research. Epidemiology. 1999;10(1):37–48.
45. Whelton PK, Carey RM, Aronow WS, Casey DE, Collins KJ, Dennison Him‑ melfarb C, et al. 2017 ACC/AHA/AAPA/ABC/ACPM/AGS/APhA/ASH/ASPC/ NMA/PCNA guideline for the prevention, detection, evaluation, and management of high blood pressure in adults. A Report of the American college of cardiology/American heart association task force on clinical practice guidelines. Hypertension. 2018;71(19):e127–248.
46. Gomez‑Santos C, Saura CB, Lucas JA, Castell P, Madrid JA, Garaulet M. Menopause status is associated with circadian‑ and sleep‑related altera‑ tions. Menopause. 2016;23(6):682–90.
47. Lauderdale DS, Knutson KL, Yan LL, Liu K, Rathouz PJ. Self‑reported and measured sleep duration: how similar are they? Epidemiology. 2008;19(6):838–45.