* To whom all correspondence should be addressed. Mob.:+91- 9847065069;
E-mail: [email protected]
Relative Quantification of FAD2 Gene expression and
Comparative Analysis of SNPs of Indian
Peanut (
Arachis hypogaea
L
.
) Cultivars
Rajesh Mamkulathil Devasia, Salini Bhasker and Mohankumar Chinnamma*
SCMS Institute of Bioscience and Biotechnology Research and Development, Management House, South Kalamassery, Cochin, Kerala - 682 033, India.
(Received: 25 January 2013; accepted: 28 February 2013)
Fatty acid desaturase (FAD2) gene of the thirteen cultivars of peanut (Arachis
hypogaea L.) coding for omega 6 desaturase, critical for the conversion of oleic acid to
linoleic acid was cloned sequenced and analysed. Single nucleotide polymorphisms (SNPs) and the associated amino acid substitutions were detected by multiple sequence alignment of FAD2 of the peanut cultivars. The relative expression of the FAD2 gene in the cultivars was quantified by real-time PCR. Within the thirteen cultivars, K134 showed the highest level expression of FAD2 gene (2.01). The quantitative variation of the gene expression was compared with the oleic/linoleic acid ratio (O/L) of the oil analysed by gas chromatography (GC). A positive correlation was noticed in the accumulation of linoleic acid content and the FAD2 gene expression in the cultivars. The comparative sequence analysis of the FAD2 gene with its known alleles of the gene FAD2A and FAD2B showed a distinct allelic status for the FAD2 gene of K134 based on the SNPs and amino acid substitutions.
Key words: Omega 6 desaturase, FAD2 gene, Arachis hypogaea L, Relative expression, Linoleic acid, SNPs.
Of the several hundred varieties of plants known to have oil bearing seeds, only a few are significant commercially 1. As a major oleaginous
crop cultivated in India Arachis hypogaea L. (Peanut) has greater importance due to its high productivity and significant nutritional value 2, 3
.Vegetable oils have become economically important because they are the renewable source of hydrocarbons and are widely used in diets and industrial applications 4. The past years various
biochemical studies on peanut exponentially expanded our understanding of the mechanisms of oil biogenesis, oil composition and fatty acid profile of the crop 5. But the genomic approaches
for revealing the nucleotide polymorphisms among the identified cultivars and the molecular mechanism of marker gene expression involved in fatty acid synthesis still lags far behind.
The peanut seed is comprised of 45-50% oil of which approximately 80% consists of oleic acid and linoleic acid 6. As an edible oil, the oleic
acid and linoleic acid ratio (O/L) in peanut seeds has sound impact in maintaining the quality of the oil 7. Oil with higher ratio of oleic to linoleic acids
are less prone to oxidation and the development of off flavor 8. In other words the ratio of oleic to
linoleic (O/L) is an indicator of determining the oil stability of peanut. Meanwhile the higher content of the linoleic acid the polyunsaturated fatty acid (PUFA) in peanut seed is an essential nutritional factor for increasing the edible quality of peanut seeds 9. So the development of varieties with higher
The fatty acid desaturase technically called as oleoyl phosphatidylcholine (oleoyl-PC) desaturase (FAD2) is the enzyme responsible for the conversion of oleic acid to linoleic acid by the insertion of double bond in to the hydrocarbon chain 10. In the present paper the FAD2 gene was
studied at molecular level, in order to understand the relative expression of the gene in the major cultivars of peanut with respect to the linoleic acid synthesis. The study also revealed the comparative sequence analysis of the gene for revealing the nucleotide polymorphism and the amino acid variation
MATERIALS AND METHODS
Plant material
Seeds of the thirteen cultivars of peanut (Arachis hypogaea L.) - K134, DRG12, CO4, AK159, DRG17, DH86, VRI2, VRI3, VRI4, GG7, JL220, TMV7 and TMV13 were obtained from the experimental seed garden of National Research Centre for Ground nut (NRCG), Junagarh, Gujarat. The seeds were sown in the green house under ideal conditions and plantlets were developed for the isolation of RNA.
Isolation of RNA
For RNA isolation the tissue samples were collected from healthy seedlings of peanut at the sixth day of germination. RNA was isolated from 100 mg of fresh tissues by using Tri solution (Sigma, Bangalore). The quality of RNA was checked by formaldehyde agarose gel electrophoresis and stored at 80°C.
PCR primers
The gene specific primers for the amplification of full length coding region of FAD2 gene (1255 bp) were designed from the accession EF192432 of Spanish bunch type cultivar by using vector NTI software (Invitrogen, USA).
cDNA synthesis and PCR reaction
4 µg of RNA was used to synthesize cDNA in a 20 µl reaction containing 100 ng of poly T primer (Fermentas, Canada) 1mM of dNTP mix, 5 units of AMV-RT enzyme (Vivantis, Malaysia) and 15 units of RNase inhibitor at 42°C for 1 hour 11.
The PCR reaction was performed in a 25 µl PCR assay mixture containing 100 ng of cDNA, 1.0 µl of dNTPs (0.4 mM), 50 pmoles of each forward and reverse primers and 1 unit of Taq DNA polymerase
(Fermentas, Canada) by following the conditions: Initial denaturation of 1 minute at 94°C, 35 cycles of 30 seconds at 94°C, 90 seconds at 64°C and 90 seconds at 72°C followed by a final extension of 72°C for 7 minutes. The PCR products were separated on 1.2% agarose gel.
Cloning and sequencing full coding gene of FAD2
The FAD2 gene was purified from the PCR product using purification kit of Quiagen and the purified FAD2 gene was incubated with pTZ57R/ T vector (Fermentas, Canada) at 22°C overnight in the presence of T4 DNA ligase. The ligated vector was transformed to E.coli. JM109 competent cells. Positive transformants were identified by blue white screening and 8-10 recombinant plasmids were isolated from the bacterial cells by alkaline lysis method 12. The plasmids were subjected to
restriction digestion using the enzyme HindIII and the products were separated by 1.2% agarose gel. The positive clones of the FAD2 gene of the thirteen cultivars were identified and sequencing was done in triplicate for each cultivars (Sigma, Bangalore). For the analysis of the gene sequence, multiple sequence alignment was done using the software vector NTI.
Real time RT-PCR analysis
The primers for the qPCR study were designed for a size of 158 bp by eprime software (eppendorf, Germany) (Forward primer 5' AGGTTTGGGTTGGGTGGTATGTGT 3': Reverse primer 5' TGTCCACTGTTGCCAATGCTCCT3'). The primers of the actin depolymerising factor (actin-DF) of peanut were used as the reference gene 13. 4 µg of total RNA was used for RT reaction
using AMV RT enzyme (Vivantis, Malaysia). Realtime quantitative PCR was performed in a 20 µl PCR mixture containing 150 nM of each primer, 10 µl of 2X SYBR green master mix (Applied Bio systems, USA) containing dATPs, dTTPs, dGTPs, dCTPs and 1.5 mM MgCl2. For the generation of standard curve for FAD2 gene and actin depolymersing factor, the cDNA was serially diluted to a concentration ranging from 200 ng to 0.02 ng 14. The reactions were run on realplex
interpolating a standard regression curve of Ct values generated from the samples of known concentrations. Tm curve analysis was performed using realplex software. The expressions of FAD2 in thirteen different cultivars were determined from the efficiency curve of the normalized PCR assay by using the calibrator. The normalized relative quantity for each gene was calculated using the equation 2-ΔΔCt method 15.
GC analysis of peanut oil
Preparation of fatty acid methyl ester
For detecting the fatty acid profile of peanut, total lipids were extracted with hexane as solvent from dried peanuts by using soxhlet apparatus 16. Fatty acid methyl ester (FAME) were
prepared by refluxing 30 mg of oil in 3 ml of 98% methanolic H2SO4 (v/v), for 3 hours. The flask was cooled and 3 ml of hexane was added and the organic phase was collected. 3% sodium bicarbonate was added to the organic phase and collected again. The organic phase was washed with water and transferred to a bed of sodium sulphate to remove moisture. The fatty acid methyl esters were recovered with hexane 17.
GC conditions
The methyl ester analysis was carried out using GC equipped with a capillary column (30 m long, 0.32 mm I.D., 0.20 µm film thickness) of fused silica and FID detector. The operating conditions for GC/FID analysis were set as follows: injector 220ºC;FID, 220º C; flow rate of N2 as a carrier-linear velocity, 31 cm-1; split ratio, 50:1 flow rate of air,
385 mL min-1; H2, 32 mL min -1. Fatty acids were
identified by comparing the retention time with that of fatty acid methyl ester standards separated on the same GC. Measurements were done using peak height area integrals expressed as a percentage of the total of all integrals. The experiments were carried out in three replicates and data was subjected to the statistical analysis for determining the test of significance.
RESULTS AND DISCUSSION
FAD2 gene of peanut cultivars
RNA was isolated from the thirteen cultivars of peanut and cDNA was synthesized by reverse transcription. The FAD2 gene was amplified from the cDNA using forward and reverse primers (FP 5' ACACAACAATGGGAGCTGGAG
3': RP 5' CATGGCAAATCCACACACAC 3'). All the samples showed PCR amplification of FAD2 gene with the expected size of 1255 bp (Fig.1).
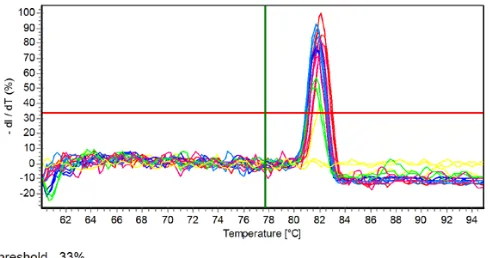
Relative expression of FAD2 gene
For the quantitative gene expression, the efficiency of the PCR reaction was checked by using the reference gene actin depolymerising factor (actin-DF) in different dilutions. The standard curve was drawn based on the concentration of cDNA. The amplification pattern of the FAD2 gene of the cultivars based on the Ct values and the melting peaks of the amplification product were shown in the figure 3 and 4. The relative expression of FAD2
Table 1. The mean values of the relative level of expression of FAD2 gene in thirteen cultivars of peanut
S. No Cultivar Expression of FAD2
1 K134 2.01±0.06
2 DRG12 1.83±0.02
3 AK159 1.60±0.01
4 Co4 1.51±0.01
5 DRG17 1.47±0.03
6 VRI3 1.43±0.01
7 VRI4 1.34±0.04
8 VRI2 1.27±0.04
9 DH86 1.20±0.03
10 GG7 1.36±0.02
11 JL220 1.14±0.01
12 TMV13 1.10±0.02
13 TMV7 1.06±0.01
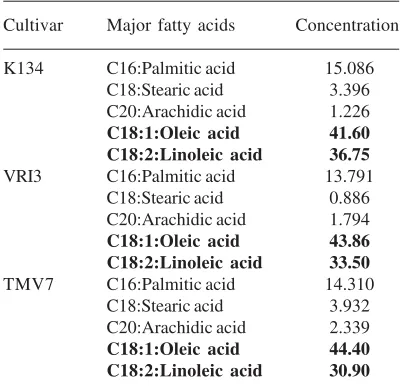
Table 2. Fatty acid content of the peanut oil of K134, VRI3 and TMV7 cultivars showing
the oleic acid and linoleic acid content
Cultivar Major fatty acids Concentration
K134 C16:Palmitic acid 15.086 C18:Stearic acid 3.396 C20:Arachidic acid 1.226 C18:1:Oleic acid 41.60 C18:2:Linoleic acid 36.75 VRI3 C16:Palmitic acid 13.791
C18:Stearic acid 0.886 C20:Arachidic acid 1.794 C18:1:Oleic acid 43.86 C18:2:Linoleic acid 33.50 TMV7 C16:Palmitic acid 14.310
T
able 3.
The correlation of the eleven cultivars with F
AD2A
indicating their similarities
in the nucleotide sequences. The difference noticed in K134 is marked as asterisk
Position of the
1 5 0 1 7 2 256 2 8 2 4 3 2 4 6 5 5 0 8 5 4 1 5 4 7 5 6 2 7 2 1 8 0 9 9 2 8 9 5 0 9 8 1 1039 1094 1105
nucleotide (bp) FAD2A(AF272951)
C G T T C A A A A T C A A T A T A A K 1 3 4 C GT T A * G * A A A T T A A A G GA C * AK159 C G T T C A A A G T C A G T A T A A C 0 4 C G T T C A A AAGC G A T A T A A DRG17 C G T T C A G A A T C A A T A T A A VRI3 C G T T C A A A A T C A A T A T A A G G 7 C G T TC A AA A T C A A T AT A A VRI4 C G T T C A A A A T C A A T A T A A VRI2 C G A T C A AAA T C A A T A T T A D H 8 6 C G T TC
A A A AT
C AA T A T A A TMV13 C G T T C A A A A T C A A T A T A A TMV7 C G T T C A A G A T C A A T A T A A T able 4
.The correlation of the nucleotides of the three cultivars with F
AD2B.The dif
ference noticed in K134 is marked as asterisk.
gene in thirteen cultivars were quantified by delta Ct method and arranged in an order from higher to lower. The values are the mean of triplicates with standard deviation. It is obvious that the cultivar K134 showed the higher level of expression (2.01) and the cultivar TMV7 showed the lower level (1.06). A moderate level of expression was found in VRI3 (1.43). In oleaginous crops FAD2 gene is responsible for the conversion of oleic acid (18:1) to linoleic acid (18:2) by the insertion of a double bond at δ 12 position of the hydrocarbon chain 18.
The level of relative expression of FAD2 gene in the cultivars K134, TMV7 and VRI3 were analysed by quantifying the end product linoleic acid.
O/L ratio of peanut oil
Based on the qPCR data of the relative expression of FAD2 gene, in the cultivars K134, VRI3 and TMV7 representing the higher, medium and lower expression respectively. The oil of the seeds of K134, VRI3 and TMV7 was analysed by gas chromatography after methyl esterification. Figure.5 represents gas chromatograph of the oil. Based on the chromatogram peaks, the fatty acid
content of the oil of the three cultivars were quantified. Based on the comparison of oleic acid (18:1) and linoleic acid (18:2) content of the three cultivars, a positive correlation was noticed in the accumulation of linoleic acid between the cultivars with the expression of FAD2 gene. The data indicate that the cultivar K134 with higher relative expression leads to the synthesis of more linoleic acid than the cultivar with lower expression. Comparable to the depletion noticed in the FAD2 gene expression from K134 to TMV7, a level of reduction was noticed in the linoleic acid content. Thus the qPCR data of relative expression of FAD2 gene corroborates the fatty acid profile of oleic acid and linoleic acid in K134, VRI3 and TMV7
SNPs and amino acid variations of the cultivars
Based on the variations observed in the relative expression of FAD2 gene of peanut by qPCR, the ful coding region of FAD2 gene (1140 bp) of the thirteen cultivars were cloned and sequenced. The gene was sequenced in both forward and reverse directions for confirming the presence of polymorphisms. For the sequence
Fig. 1. PCR amplified products of FAD2 gene
a. 158 bp partial FAD2 gene amplified in qPCR b. Full length coding region of 1255 bp
comparison, the FAD2 gene sequence of the Spanish bunch type variety of peanut was used as reference. The sequence comparison of the FAD2 gene of the thirteen cultivars of peanut has shown 18 variants in the exon regions of the FAD2 gene. Out of the 18 SNPs observed in the sequences, the nucleotide polymorphisms at 11 positions- 58, 86, 181, 183, 188, 270, 310, 317, 347, 365 and 369, were associated with amino acid substitutions. Based on these SNPs and amino acid substitutions, an attempt was made to correlate the polymorphism with that of the quantitative expression of the gene. From the qPCR data of relative gene expression of FAD2, a successive level of progress in the gene expression was noticed from TMV7 to K134 with VRI3 as intermediate. So in the correlation study more focus was given to the three cultivars K134, VRI3 and TMV7 for determining how far the SNPs and amino acid substitutions involve in the
expression level. The comparative analysis of K134, VRI3 and TMV7 showed eight SNPs with four amino acid substitutions. K134 the cultivar of higher level of FAD2 expression showed three amino acids Tyrosine (Y), Valine (V) and Glutamine (Q) substituted at 317, 347 and 369 positions, compared to cultivars VRI3 and TMV7. Similarly a single variation of amino acid as Alanine (A) instead of Threonine (T) at positions 181 was observed in TMV7, the cultivar of lower FAD2 expression. Since each amino acid has an intrinsic role in the functional property of the protein, the SNPs and the associated amino acid substitutions that observed in the three cultivars necessitates more in depth investigation to substantiate the expressional variation.
Allelic variations of FAD2 gene
The O/L ratio of peanut is controlled primarily by two alleles of the gene FAD2A and
FAD2B and these specific mutations work as genetic markers for detecting heterozygotes and seed mixtures 19. Based on the SNPs noticed in the
FAD2 gene sequence of the cultivars of peanut, the sequences were compared with the known sequence of the two alleles of FAD2A (AF272951) and FAD2B (EF186911). Table 3 and 4 demonstrate the grouping of the thirteen cultivars based on the similarity with the alleles of FAD2A and FAD2B. Ten varieties of the thirteen cultivars showed 100% similarity with that of FAD2A and the other two varieties DRG12 and JL220 exhibit close similarity with FAD2B. It could be noticed that the variety K134 remains as a unique with 3 variations from FAD2A and FAD2B. In FAD2A, K134 showed SNPs in 432(A/C), 465 (G/A) and 1105 (C/A) and in FAD2 B the SNPs were observed in 150 (C/A), 172
(G/A) and 282 (T/C) positions. With respect to the SNPs noticed in the thirteen cultivars and their comparison with the FAD2A and FAD2B, the cultivar K134 showed a similarity of 84% with FAD2A and FAD2B, unlike the other cultivars. This variation observed in K134 may be due to the mutation happened by successive breeding programmes. The genetic distance between the cultivars was measured by preparing a cladogram .Within the two groups of FAD2A and FAD2B categorised from the thirteen cultivars of peanut, the FAD2 gene of the cultivar K134 remains as unique and the gene distinguishes itself as a separate one closer to FAD2B. Thus the variations of SNPs noticed in the FAD2 gene sequence of K134 from that of FAD2A and FAD2B, the unique amino acid substitution tyrosine instead of
Fig. 5. Fatty acid profile of the peanut oil of K134 cultivar under gas chromatography
phenylalanine observed at 317 position and the higher level of expression, make the FAD2 gene of K134 as a distinct and a separate allele.
ACKNOWLEDGEMENTS
The authors acknowledge Dr. G P C Nayar, the Chairman of the SCMS group for providing the infrastructure for the work and the Director, National Research Centre for Groundnut (NRCG), Junagarh, Gujarath, for providing the seeds of the cultivars. The authors also extend their thanks to the Head, Food Science Division, National Institute of Interdisciplinary Science and Technology (NIIST, CSIR), Thiruvananthapuram for assisting the GC analysis.
REFERENCES
1. Liu,Q., Singh,S., Green,A. High oleic and high stearic cotton seed oil: Nutritionally improved cooking oils developed using gene silencing. J Am Coll Nutri.,2002; 21(3):205S-211S. 2. Higgs,J.The beneficial role of peanuts in the diet.
Nutrition and Food Sci., 2003; 33(2): 56-64. 3. Ozcan,M., Seven,S. Physical and chemical
analysis and fatty acid composition of peanut, peanut oil and peanut butter from COM and NC 7 cultivars. Grasas Y Aceites.Fasc 1., 2003:54:12-18.
4. Yang,M., Xu,Y. Oleate accumulation, induced by silencing of microsomal omega 6 desaturase, declines with leaf expansion in transgenic tobacco. J. Plant. Physiol.,2007; 164: 23-30. 5. Campos-Mondragon,M.G., CalderonDeLa
Barca,A.M., Duran Prado,A., Campos-Reyes,L.C., OilartRos,R.M., OrtegaGracia,J., Medina Juarez,L.A., Angulo,O. Nutritional composition of new peanut (Arachis hypogaea
L.) cultivars. Grasas Y Aceites.,2009; 60(2) :161-167.
6. O’Keefe,S.F., Wiley,V.A., Knauft,D.A. Comparison of Oxidative Stability of High and Normal Oleic Peanut Oils. J.Am.Oil Chem.Soc.,1993; 70: 489-492.
7. Baoming,T., Dandan,S., Yuli,L., Haiyan,S., Hua,L., Xin,Z., Bonan,W., Zhenqiang,P. Analysis of the RNAi targeting FAD2 gene on oleic acid composition in transgenic plants of
Brassica napus L. Afri. J. Micro. Res., 2011; 5(7): 817-822.
8. Bolten,G.E., Sanders,T.H. Effect of roasting oil composition on the stability of roasted high-oleic peanuts. J.Am.oil.chem.Soc., 2002;19 :129-132.
9. Napier,J.A. The Production of Unusual Fatty Acids in Transgenic Plants. Annu. Rev. Plant. Biol., 2007; 58: 295-319.
10. Jin,U.H., Lee,J.W., Chung,Y.S., Lee,J.H., Yi,Y.B., Kim,Y.K., Hyung,N.I., Pyee,J.H., Chung,C.H. Characterization and temporal expression of ω-6 fatty acid desaturase cDNA from sesame (Sesamum indicum L.) seeds. Plant Sci.,2001; 161: 935-941.
11. Anisha, S., Bhasker, S., Mohankumar, C., Recombinant lactoferrin (Lf) of vechur cow, the critical breed of Bos indicus and the Lf gene variants. Gene., 2012; 495: 23-28.
12. Joseph,S., David,R. Molecular cloning a laboratory manual, 3rd ed. Cold Spring Harbor
Laboratory Press, Cold Spring Harbor. ,2001; 1: 1.1.
13. Tsitsigiannis,D.I., Kunze,S., Willis,D.K., Feussner,I., Keller,N.P. Apergillus infection inhibits the expression of Peanut 13S-HPODE-forming seed lipoxygenases. Am. Phytopatho. Soc., 2005; 18(10):1081-1089.
14. Liu.W., Saint,D.A. A new quantitative method of real time reverse transcription polymerase chain reaction assay based on simulation of polymerase chain reaction kinetics. Anal. Biochem.,2002; 302: 52-59.
15. Livak,K.J., Schmittgen,T.D. Analysis of Relative Gene Expression Data Using Realtime Quantitative PCR and the 2-ΔΔCt Method.
Methods., 2001; 25: 402-408.
16. Shahidi, F; Current Protocols in Food Anal. Chem. Copyright (c) by J. Wiley & Sons, Inc. D1.1.1-D1.1.11.
17. Graces,R., Mancha,M. One step lipid extraction and fatty acid methyl esters preparation from fresh plants tissues. Anal. Biochem., 1993; 211:139-143.
18. Burner,A.C, Jung,S., Abbott,A.G., Powell,G.L. The naturally occurring high oleate oil character in some peanut varieties results from reduced oleoyl-PC desaturase activity from mutation of aspartate 150 to asparagine. Crop Sci.,2001; 41: 522-526.