Original Research Article
Association of socio-demographic variables and risk of type 2 diabetes
using Indian diabetes risk score: a cross-sectional
study in urban Mysuru
Mansoor Ahmed
1, Amrutha A. M.
2*
INTRODUCTION
Epidemiological transitions in India in the 21st century have led to non-communicable diseases becoming a major public health problem of growing magnitude. One of the important diseases in this respect is diabetes, which
is considered a “disease of urbanization”.1–3 About 422
million people worldwide have diabetes. India has 69.2 million people living with diabetes out of a population of 1.3 billion (8.7%) as per the 2015 data. Of these, it remained undiagnosed in more than 36 million people. In 2015, over 0.9 million deaths in India were attributed to
ABSTRACT
Background: About 422 million people worldwide have diabetes. India has 69.2 million people living with diabetes out of a population of 1.3 billion (8.7%) as per the 2015 data. Of these, it remained undiagnosed in more than 36 million people. Early identification of at-risk individuals and appropriate lifestyle intervention would help in preventing or postponing the onset of diabetes mellitus. Present study aimed to study the association of IDRS components with socio demographic and anthropometric variables among adults in urban area of Mysore.
Methods: A community-based cross sectional study was conducted in the urban areas of the field practice area of Mysore Medical College and Research Institute. The study was conducted between March and July 2015. Using the estimation set up technique for proportion, the sample size was calculated to be 872 rounded off to 900, with level of significance of 5% and precision of 10%. Risk level for diabetes was assessed using Indian Diabetic Risk Score (IDRS) and sociodemographic and anthropometric factors were assessed through a semi structured pretested questionnaire.
Results: Of 900 participants, 197 (21.9%) had a high risk score (IDRS ≥60), the majority of participants (383; 42.5%) were in the moderate-risk category (IDRS 30–50). There was statistically significant difference between type of family and different risk categories under age component of IDRS (p<0.0005). Statistical significance was observed for marital status and SES among different age groups. Association was found significant between family history of diabetes component of IDRS and gender. There was also statistically significant difference between SES and different risk categories under family history of diabetes component of IDRS (p<0.0005).
Conclusions: IDRS should be used routinely in community-based screening to find out high risk category of population for diabetes.
Keywords: IDRS, Risk for diabetes, Sociodemographic factors, Chi-square test
Department of Community Medicine, 1Mysore Medical College and Research Institute, Mysore, 2Basaveshwara Medical College and Hospital, Chitradurga, Karnataka, India
Received: 10 December 2017
Revised: 05 January 2018
Accepted: 06 January 2018
*Correspondence:
Dr. Amrutha A. M.,
E-mail: [email protected]
Copyright: © the author(s), publisher and licensee Medip Academy. This is an open-access article distributed under the terms of the Creative Commons Attribution Non-Commercial License, which permits unrestricted non-commercial use, distribution, and reproduction in any medium, provided the original work is properly cited.
diabetes directly or indirectly. The number of diabetics in the country is expected to increase to a staggering 109 million cases by 2035 out of an estimated population of 1.5 billion.4
While recognizing the increasing prevalence of type 2 diabetes in urban Indian adults, it is important to note that the prevalence of undiagnosed diabetes in the community is also high.
A novel approach utilizing simple non-invasive scores can offer a potential for mass screening programmes. The Indian Diabetes Risk Score (IDRS) was developed by V Mohan and his colleagues in Madras Diabetes Research Foundation (MDRF), Chennai and is considered to be one of the strongest predictor of incident diabetes in India.5 It is a simplified risk score for identifying undiagnosed diabetic subjects using four simple parameters like age, waist circumference, family history of diabetes and physical activity. It is an efficient tool to categorize the risk of diabetes mellitus in community. It also helps in detecting undiagnosed type 2 diabetes. The present study aimed to study the association of IDRS components with socio demographic and anthropometric variables among adults in urban area of Mysore.
METHODS
A community-based cross-sectional study was conducted in urban field practice area of department of Community Medicine, Mysore Medical College and Research Institute, Mysore. Study was approved by the Institutional Ethics Committee. The maximum inflated sample size was 872 rounded off to 900, which was calculated using estimation technique with prevalence of high risk for diabetes using IDRS as 31.5% with 5% level of significance and precision 10%. The sample size was allocated to each ward using “Proportionate allocation technique”.6 The voter’s lists were obtained from Chief
Electoral Office, Karnataka which contains demographic details of voters in different wards of urban field practice area. This list was compiled to form the required sampling frame for the selection of individuals. To achieve randomization in the selection of subjects at each ward, SRSWOR (simple random sampling without replacement) was used. To achieve random sampling RAND Corporation released random number table was used. Selected participants aged 18 years and above, not diagnosed cases of diabetes were included in the study.
Study was conducted from March to July 2015. Information was collected by visiting the houses of the selected participants. To collect the required information from the study subjects the “Direct interview method” of Primary source of information technique was used. The individuals were interviewed for collection of necessary information using the pre-tested; semi structured and structured questionnaire method. The questionnaire was prepared by a thorough review of literature. The questionnaire contained the information regarding socio-demographic profile, IDRS components and
anthropometric measurements. The questionnaire was pilot tested.
The four components of IDRS are age, family history of diabetes, physical activity and waist circumference. The study subjects were scored according to the following score.5
Table 1: Indian diabetes risk score [IDRS].
Particulars Score
Age
<35 years 0
35–49 years 20
50 years 30
Waist circumference
Waist <80 cm [female], <90 cm [male] 0 Waist 80 - 89 cm [female], 90 – 99 cm
[male] 10
Waist 90 cm [female], 100 cm [male] 20
Physical activity
Vigorous exercise [regular] or strenuous [manual] work at home / work 0 Moderate exercise [regular] or moderate physical activity at home / work 10 Mild exercise [regular] or mild physical activity at home / work 20 No exercise and sedentary activities at
home / work 30
Family history of diabetes
No diabetes in parents 0 One parent is diabetic 10 Both parents are diabetic 20
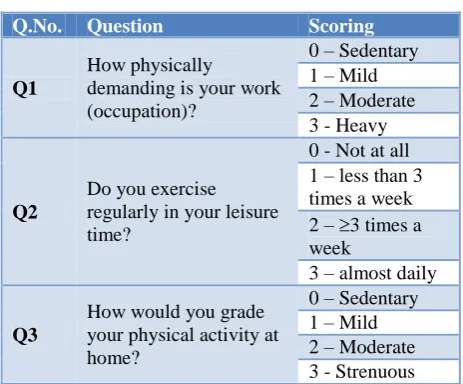
Table 2: The physical activity component of IDRS scoring.
Q.No. Question Scoring
Q1
How physically
demanding is your work (occupation)?
0 – Sedentary 1 – Mild 2 – Moderate 3 - Heavy
Q2
Do you exercise regularly in your leisure time?
0 - Not at all 1 – less than 3 times a week 2 – 3 times a week
3 – almost daily
Q3
How would you grade your physical activity at home?
0 – Sedentary 1 – Mild 2 – Moderate 3 - Strenuous
If the combined score of Q1, Q2 and Q3 is
1 - Mild: Score = 20; 0 - Sedentary: Score = 30
The final IDRS score was calculated and were subdivided into high risk if the combined score is ≥60. Moderate risk if the combined score is between 30-50 and low risk if the combined score is <30.
Statistical analysis
Data were entered into Microsoft excel sheet and analysed using SPSS Inc. 17.0 software. Frequency and percentages (descriptive statistics) were calculated. Pearson’s Chi-square was used as a test of significance. P<0.05 was considered statistically significant.
RESULTS
Of 900 participants, 197 (21.9%) had a high risk score (IDRS ≥60), the majority of participants (383; 42.5%) were in the moderate-risk category (IDRS 30–50) and 320 (35.6%) participants were found to be at low risk for diabetes (IDRS<30) (Table 3).
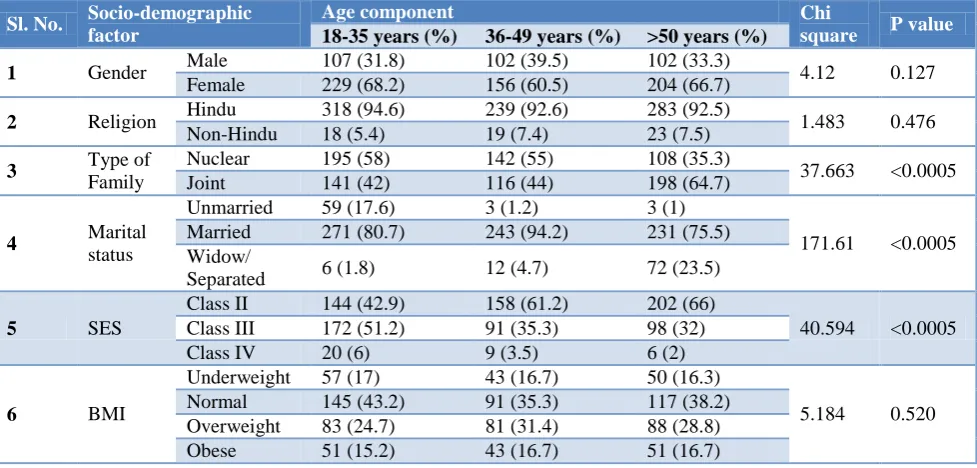
Bivariate analysis was done for socio demographic factors and BMI between different age groups of the participants. It was found that 64.7% of those aged >50 years lived in joint families and 35.3% of our study subjects belonging to >50 years age group lived in nuclear families. These differences were statistically significant (p<0.0005). Statistical significance was observed for marital status and SES among different age groups (Table 4).
Table 3: Assessment results for IDRS parameters.
Parameter N (%)
Age category
18-35 years 336 (37.3)
36-49 years 258 (28.7)
>50 years 306 (34)
Waist circumference
<80 cm (female)/ <90 cm (male) 350 (38.9) 80-89 cm (female)/ 90-99 cm (male) 191 (21.2) >90 cm (female)/ >100 cm (male) 359 (39.9)
Physical activity
Strenuous 575 (63.9)
Moderate 211 (23.4)
Mild 69 (7.7)
Sedentary 45 (5)
Family history
No family history 166 (18.4)
Either parent 39 (4.3)
Both parents 695 (77.2)
IDRS risk
High risk 197 (21.9)
Moderate risk 383 (42.5)
Low risk 320 (35.6)
Table 4: Comparison of socio-demographic factors and BMI between individuals with age component of IDRS.
Sl. No. Socio-demographic factor
Age component Chi
square P value
18-35 years (%) 36-49 years (%) >50 years (%)
1 Gender Male 107 (31.8) 102 (39.5) 102 (33.3) 4.12 0.127 Female 229 (68.2) 156 (60.5) 204 (66.7)
2 Religion Hindu 318 (94.6) 239 (92.6) 283 (92.5) 1.483 0.476 Non-Hindu 18 (5.4) 19 (7.4) 23 (7.5)
3 Type of
Family
Nuclear 195 (58) 142 (55) 108 (35.3)
37.663 <0.0005 Joint 141 (42) 116 (44) 198 (64.7)
4 Marital
status
Unmarried 59 (17.6) 3 (1.2) 3 (1)
171.61 <0.0005 Married 271 (80.7) 243 (94.2) 231 (75.5)
Widow/
Separated 6 (1.8) 12 (4.7) 72 (23.5)
5 SES
Class II 144 (42.9) 158 (61.2) 202 (66)
40.594 <0.0005 Class III 172 (51.2) 91 (35.3) 98 (32)
Class IV 20 (6) 9 (3.5) 6 (2)
6 BMI
Underweight 57 (17) 43 (16.7) 50 (16.3)
5.184 0.520 Normal 145 (43.2) 91 (35.3) 117 (38.2)
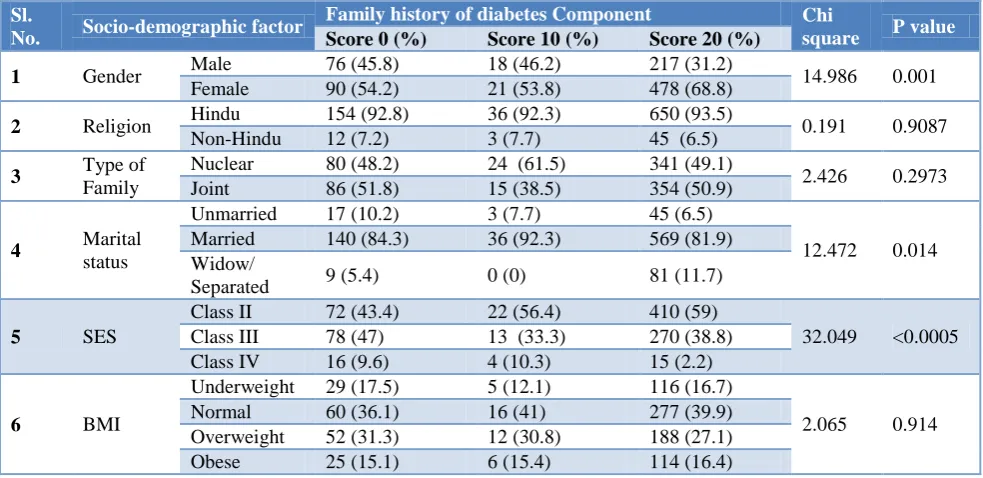
Table 5: Comparison of socio-demographic factors and BMI between individuals with family history of diabetes component of IDRS.
Sl.
No. Socio-demographic factor
Family history of diabetes Component Chi
square P value
Score 0 (%) Score 10 (%) Score 20 (%)
1 Gender Male 76 (45.8) 18 (46.2) 217 (31.2) 14.986 0.001 Female 90 (54.2) 21 (53.8) 478 (68.8)
2 Religion Hindu 154 (92.8) 36 (92.3) 650 (93.5) 0.191 0.9087 Non-Hindu 12 (7.2) 3 (7.7) 45 (6.5)
3 Type of
Family
Nuclear 80 (48.2) 24 (61.5) 341 (49.1)
2.426 0.2973 Joint 86 (51.8) 15 (38.5) 354 (50.9)
4 Marital
status
Unmarried 17 (10.2) 3 (7.7) 45 (6.5)
12.472 0.014 Married 140 (84.3) 36 (92.3) 569 (81.9)
Widow/
Separated 9 (5.4) 0 (0) 81 (11.7)
5 SES
Class II 72 (43.4) 22 (56.4) 410 (59)
32.049 <0.0005 Class III 78 (47) 13 (33.3) 270 (38.8)
Class IV 16 (9.6) 4 (10.3) 15 (2.2)
6 BMI
Underweight 29 (17.5) 5 (12.1) 116 (16.7)
2.065 0.914 Normal 60 (36.1) 16 (41) 277 (39.9)
Overweight 52 (31.3) 12 (30.8) 188 (27.1) Obese 25 (15.1) 6 (15.4) 114 (16.4)
Bivariate analysis of the family related factors and BMI was conducted between different family histories of diabetes risk groups. Among those who were high risk under family history of diabetes component (score=20), 68.8% were females and 31.2% were males. This difference was statistically significant (p=0.001). 81.9% of those whose both parents were diabetic were married and 11.7% were widow/separated. These differences were statistically significant (p=0.014). There was also statistically significant difference between SES and different risk categories under family history of diabetes component of IDRS (p<0.0005) (Table 5).
Bivariate analysis of the family related factors and BMI was conducted between different risk groups, different waist circumference risk groups and different physical activity risk groups. There was no statistically significant association.
Figure 1: Graph representing risk of developing diabetes according to IDRS.
DISCUSSION
This study used the IDRS to identify individuals at risk for diabetes and determine the association of various risk factors with their risk status. The proportion of individuals at high risk for diabetes was 21.9%. Similar findings were published by Gupta et al, who reported that 31.2% of the population in urban Pondicherry had a high risk score.7 However, a study conducted by Mohan et al., in the metropolitan city of Chennai, found 43% of the population was in the high-risk category.8 The difference in risk prevalence between the current study and the one in Chennai may be due to variance in lifestyles of the populations. The present study noted 42.5% of participants with moderate risk and 35.6% of participants with low risk, while Gupta et al. found 50.3% of participants at moderate risk and 18.5% at low risk for diabetes.7 In a study done by Krutharth et al in urban Mangalore, Karnataka, the differences between gender and IDRS components like waist circumference and physical activity was found to be statistically significant.9 However, in our study we observed that there was statistically significant difference between gender and family history of diabetes component of IDRS (p=0.001) but not with other components like age, waist circumference and physical activity. In a study conducted by Gupta et alin urban Pondicherry, it was found that 6.4% of individuals who were underweight had high IDRS score whereas this proportion was 44.5% among obese individuals.7 It was also observed, that among overweight individuals, 38.8% had high diabetes risk score and this proportion among those who had normal BMI was 38.8%. Statistical significance was observed among these groups (p<0.05).
0 50 100 150 200 250 300 350 400 450
CONCLUSION
This study estimates the usefulness of simplified Indian Diabetes Risk Score for identifying the risk pattern for diabetes in the community. This simplified diabetes risk score has categorised the risk factors based on their severity.
Non-modifiable risk factors like increasing age and family history of diabetes, and modifiable risk factors like lack of physical activity and central obesity were the most common factors found in participants who were at high risk for diabetes.
Use of IDRS can make mass screening for diabetes in India more cost effective and feasible. IDRS can be used for routine screening of people aged over 35 years for identification of subjects at high risk for development of diabetes.
ACKNOWLEDGEMENTS
The authors express their sincere gratitude towards all the study participants for their co-operation.
Funding: No funding sources Conflict of interest: None declared
Ethical approval: The study was approved by the Institutional Ethics Committee
REFERENCES
1. Reddy KS. Prevention and control of non-communicable diseases: status and strategies. New Delhi: Indian Council for Research on International Economic Relations; 2003 (Working Paper 104). Available at: https://www.syndromic.org/storage/ documents/NCDs/NCDStatusIndia2003_SrinathRed dy.pdf. Accessed on 22 February 2016.
2. Anand K, Shah B, Yadav K. Are the urban poor vulnerable to noncommunicable diseases? A survey of risk factors for non-communicable in urban slums of Faridabad. Natl Med J India. 2007;20(3):115–20. 3. Misra A, Pandey RM, Rama DJ. High prevalence of
diabetes, obesity and dyslipidemia in urban slum population in northern India. Int J Obes Relat Metab Disord. 2001;25(11):1722–9.
4. WHO. Global report on diabetes. Available at: http://apps.who.int/iris/bitstream/10665/204871/1/9 789241565257_eng.pdf. Accessed on 17 November 2017.
5. Mohan V, Deepa R, Deepa M, Somannavar S, Datta M. A simplified Indian Diabetes score for screening for undiagnosed diabetic subjects. J Assoc Physicians India. 2005;53:759-63.
6. Chowdhury R, Mukherjee A, Lahiri SK. A study on distribution and determinants of Indian diabetic risk score (IDRS) among rural population of west Bengal. National J Med Res. 2012;23:282-6. 7. Gupta SK, Singh Z, Purty AJ,Mohan V. Diabetes
prevalence and its risk factors in urban Pondicherry. Int J Diabetes Dev Ctries. 2009;29(4):166–9. 8. Mohan V, Sandeep S, Deepa R, Shah B, Varghese
C. Epidemiology of type 2 diabetes: Indian scenario. Indian J Med Res. 2007;125(3):217–30.
9. Brahmbhatt KR, Chakraborty T, Gopal C, Shwethashree M, Madappady S, Sowndarya TA, et al. Assessment of risk of type 2 diabetes using simplified Indian Diabetes Risk Score-Community-based cross-sectional study. Int J Med Sci Public Health. 2016;5:2522-5.