International Journal of Applied Science and Research
110
www.ijasr.org Copyright © 2019 IJASR All rights reservedOn the Evaluation of the Wrapper Technique for Feature Selection in Discriminant Analysis
Jude Chukwura Obi
Department of Statistics, Chukwuemeka Odumegwu Ojukwu University, Anambra State, Nigeria
IJASR 2019 VOLUME 2
ISSUE 6 NOVEMBER - DECEMBER ISSN:2581-7876 Abstract – The problem of feature selection in discriminant analysis is a challenging one, particularly in this era of availability of big data. Several techniques for selecting important features have been pro- posed by different authors, but we particularly focus on the Wrapper technique. The variants of the Wrapper technique (forward, backward and stepwise selection procedures) have been evaluated and through the use of empirical data, we have discovered that their performances are often data dependent. However, the backward selection is a greedy procedure because it includes most of the variables in classification. It seems to output the highest classification result, with relatively more variables, giving the datasets involved in the study. The forward and stepwise selection meth- ods appear to tally in choosing the important features. The number of variables chosen by both procedures are comparatively the least, in comparison with the backward selection procedure.
Keywords: Multivariate, Classification, Fisher’s Discriminant Analysis, Variable Selection, Ma- chine Learning.
1 Introduction
Feature selection is the process of selecting a subset of relevant features (variables or predictors) for use in model construction (Wikipedia contributors, 2019). It can also be described as a statistical process of optimising the performance of a predictive model by removing non-informative or redun- dant variables. Feature selection is an important aspect of statistical learning because in prediction problems, cases involving numerous predictors are often encountered. Unfortunately, most of these predictors do not contain the information needed for predicting responses. By selecting the predictors with more predictive information, the accuracy of prediction can be improved (James et al., 2013).
Feature selection is important because when fewer important features are used, the model can be explained in a simple and easily understandable way. Again, the cost of measuring variables can sometimes be prohibitive, and in some cases, some variables are destroyed in the process of measur- ing them. In such instances, it becomes imperative to select only a handful of important variables. The methods of achieving feature selection can be supervised or unsupervised (Kuhn and Johnson, 2013). It is unsupervised when the outcome is ignored during the elimination of variables. Example here includes the removal of highly correlated variables or variables with sparse and unbalanced dis- tributions. For supervised methods, variables are specifically selected for the purpose of increasing accuracy or to find a subset of variables to reduce the complexity of the model. Here, the outcome
is typically used to quantify the importance of the variables (Kuhn and Johnson, 2013). It has been argued (John et al., 1994) that apart from models with built-in feature selection, most approaches for reducing the number of predictors can be placed into two main categories: the Wrapper and Filter methods.
The Wrapper Method
International Journal of Applied Science and Research
111
www.ijasr.org Copyright © 2019 IJASR All rights reservedThe Forward Selection
In forward selection, the predictors are evaluated one at a time using the predictive model. A test of hypothesis usually follows, based on some specified threshold, to discover the predictor to be added to the model. If a number of predictors have value below the threshold, we include the predictor associated with the smallest value to the model and the process starts again. The algorithm will stop when the remaining predictors have p-values above the specified threshold. In other words, the remaining predictors are no longer statistically significant.
Here, (Kuhn and Johnson, 2013) identified the prediction model as the base learner, forward selection as the search procedure, and the objective function as the quantity being optimized which, in this case, is statistical significance as represented by the p-value. As pointed out by the authors, the forward search procedure is greedy meaning that it does not re-evaluate past solution. Again, they noted that repeated hypothesis tests in this manner invalidates many of their statistical properties since the same data are being evaluated a number of times. It should be noted that apart from using the p-value as the objective function, some measures of predictive performance such as the RMSE, classification accuracy or error under the ROC curve can be used.
Assuming that we choose the RMSE as the preferred objective function, the forward selection algo- rithm is not changed and only the predictors that bring about the smallest RMSE are added to the model. The process continues until some predefined number of predictors have been selected or the full model used. When no specific number of predictors are predefined, we can monitor the RMSE of the various subsets to determine where each one begins to increase. We then choose the subset size that results in the smallest RMSE. Apart from the RMSE, alternative functions to be optimized include the PRESS, AIC, BIC, Cp or R2adj. Each of these has merits and drawbacks.
For classification problems, the objective function is usually the error rate or accuracy. Here, the predictor that reduces the error rate or increases the accuracy of the predictive model is included in the model first. The process continues until predictors with predictive information are added to the model.
Backward Selection
The backward selection starts with all the predictors in the model. Assuming that the function to optimize is the PRESS, the first variable to remove is the variable that leads to the smallest PRESS after deletion. For a classification problem, the function to optimize is the error rate. The first variable
to leave the model is the one that results in the smallest error rate after deletion from the model. We continue the process until we reach a specified threshold or only one variable is in the model. Guyon et al., 2002 proposed a backward selection algorithm called recursive feature elimination (REF). The algorithm will not refit many models at each step of the search, instead, after creating the full model, a variable importance measure is computed that ranks the predictors from the most to least importance. The least important predictor is removed and the process starts again.
Stepwise Selection
The idea behind the stepwise selection is that after the first variable is added to the model, addition of a new variable will result in re-evaluation of the variables already in the model for possible removal from the model. In some cases, the p-value threshold for adding and removing predictors can be different (Derksen and Keselman, 1992). This procedure increases the problem of repeated hypothesis testing but it is generally less greedy compared to the backward selection.
R Functions Based on Wrapper
We have a number of R functions based on wrapper. These functions include step, stepAIC, fastbw, regsubsets and stepclass.
International Journal of Applied Science and Research
112
www.ijasr.org Copyright © 2019 IJASR All rights reservedargument includes forward, backward and both respectively for forward selection, backward selection and stepwise selection.
b. stepAIC: The function is in MASS package. As the name implies, it uses the AIC or its variants as the objective function. It is also an algorithm for stepwise variable selection with options for forward and backward variable selections.
c. fastbw: The rms package contains the function, and it uses p-value as the objective function. The function performs fast backward elimination on factors, using a method based on (Lawless and Singhal, 1978).
d. stepclass: This is contained in the klaR package, and it is used to carry out stepwise variable selection for classification. It has options for forward and backward selection.
e. As observed by (Kuhn and Johnson, 2013), the caret package function train has wrappers for leaps, stepAIC, and stepclass.
2 Aim and Objectives of the Study
The aim of the study is to understand more clearly, the responses of the Wrapper variants given different datasets’ dimensions. The objectives of the study include, but not limited to the following:
a. To find out the best performing Wrapper variants given different datasets.
b. To find out which Wrapper variant is easier to apply.
c. To find out the most consistent Wrapper variant in terms of optimum accuracy given different datasets.
d. To find out the best performing Wrapper variant as dataset dimensions increases to infinity.
e. To find out a more computational efficient Wrapper variant.
3 Research Methodology
The stepclass function of the klaR package R, will be used to implement the Wrapper technique, with adequate attention to forward, backward and stepwise selection procedures. We shall focus on the classification accuracy given each variant of the Wrapper method on different datasets. The Wrapper variant that gives the greatest classification accuracy will be noted, and eventually utilized in result summary. The R software syntax for the stepclass function is:
stpMod = stepclass(class ~., data = data, method = "lda", improvement = 0.01, direction = "forward or backward or both")
4 Empirical Investigation/Result
The datasets used in this work are contained in Table 1. The description of each dataset can be found in the work of (Obi, 2017).
S/N Dataset Features No Forward of
Features
Selection Accuracy
Rate
Backward
No of
Features
Selection Accuracy
Rate
Stepwise Method
No of Accuracy
Features Rate
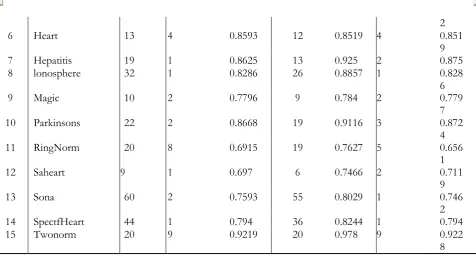
1 Breast Cancer Data 30 3 0.9578 26 0.9701 3 0.956
2 WDBC Data 29 2 0.9578 24 0.9701 2 0.959
6
3 Appendicitis 7 2 0.8964 6 0.8582 1 0.869
1
4 Auatralia 14 1 0.8549 11 0.8636 1 0.854
9
International Journal of Applied Science and Research
113
www.ijasr.org Copyright © 2019 IJASR All rights reserved2
6 Heart 13 4 0.8593 12 0.8519 4 0.851
9
7 Hepatitis 19 1 0.8625 13 0.925 2 0.875
8 lonosphere 32 1 0.8286 26 0.8857 1 0.828
6
9 Magic 10 2 0.7796 9 0.784 2 0.779
7
10 Parkinsons 22 2 0.8668 19 0.9116 3 0.872
4
11 RingNorm 20 8 0.6915 19 0.7627 5 0.656
1
12 Saheart 9 1 0.697 6 0.7466 2 0.711
9
13 Sona 60 2 0.7593 55 0.8029 1 0.746
2
14 SpectfHeart 44 1 0.794 36 0.8244 1 0.794
15 Twonorm 20 9 0.9219 20 0.978 9 0.922
8
Table 1: Number of features/accuracy rates output by the forward, backward and stepwise feature selection techniques, given different datasets.
Note that Table 1 consists of all the datasets used in this study and their different number of features. The forward and stepwise procedures seem to tally in their choices of features given the datasets. The backward selection procedure appears to select more features than the other two. The accuracy rate of the backward selection procedure seems to be consistently higher than the rest. Based on the contents of this Table, we shall be concerned with testing two important hypotheses.
Hypothesis One
H0 : The Wrapper technique variants select the same numer of features.
H1 : The Wrapper technique variants do not select the same number of features.
Hypothesis Two
H0 : The Wrapper technique variants have the same classification accuracies.
H1 : The Wrapper technique variants have different classification accuracies.
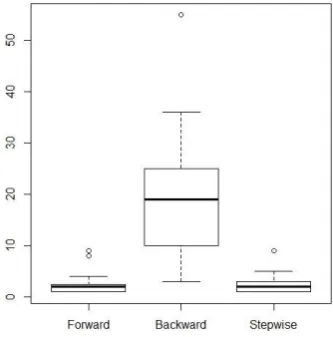
Regarding hypothesis one, Tables 2 will be of interest to us. The box plot arising from the Table (Fig- ure 1(a)) shows that the backward selection has more variables than forward and stepwise selections. Based on the sizes of the individual boxes, it seems that the features selected by the backward selec- tion procedure is significantly larger. A Kruskal-Wallis test carried out shows that the null hypothesis is rejected at a p-value of 1.825e-06. A follow-up post-hoc test gives the following output:
Forward Backward Backward 2 . 1 e −05 −
S t e p w i s e 0 . 9 3 2 . 1 e −05
International Journal of Applied Science and Research
114
www.ijasr.org Copyright © 2019 IJASR All rights reservedS/N Datasets Feature
s
Forward (No of Features )
Backwar d (No of Features)
Stepwise (No of
Features)
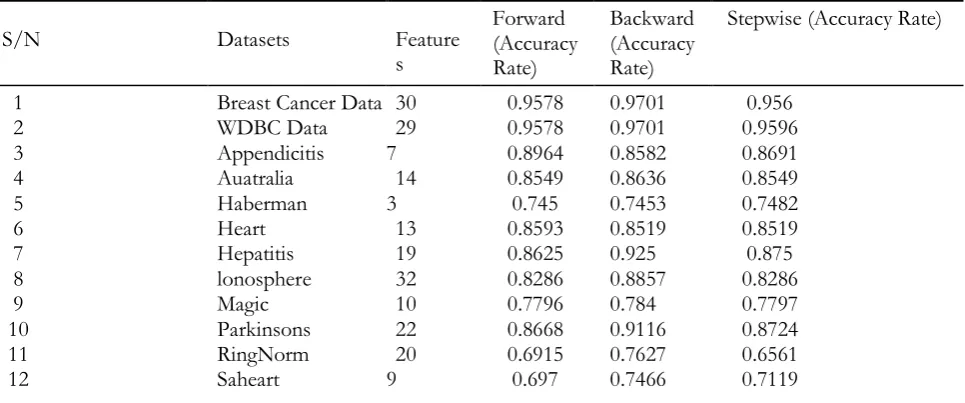
1 Breast Cancer Data 30 3 26 3
2 WDBC Data 29 2 24 2
3 Appendicitis 7 2 6 1
4 Auatralia 14 1 11 1
5 Haberman 3 1 3 1
6 Heart 13 4 12 4
7 Hepatitis 19 1 13 2
8 lonosphere 32 1 26 1
9 Magic 10 2 9 2
10 Parkinsons 22 2 19 3
11 RingNorm 20 8 19 5
12 Saheart 9 1 6 2
13 Sona 60 2 55 1
14 SpectfHeart 44 1 36 1
15 Twonorm 20 9 20 9
Table 2: Number of features utilized by the forward, backward and stepwise selection procedures.
Regarding hypothesis two, Table 3 will be very helpful. A box plot derivable from the Table is shown in Figure 1(b). It suggests that the classification accuracies of the different Wrapper techniques are not significantly different from one another. Confirming this line of thinking, the null hypothesis is not rejected at a p-value of 0.6068, based on the Kruskal-Wallis test carried out. The non-rejection of the null hypothesis confirms that the classification accuracies of the different Wrapper techniques are not significantly different from each other, given the datasets under consideration.
5 Summary/Conclusions
This research has further lend credence to the views of most researchers that not all features of a given dataset have the requisite information for classification purposes. The Wrapper techniques implemented via the forward, backward and stepwise procedures have been shown to be computa- tionally efficient. The forward, as well as the stepwise selection procedures usually will select fewer variables vis-a-vis the backward selection procedure. The backward selection procedure has classi- fication accuracies marginally higher than the other two. Unfortunately, as the analysis showed, the
S/N Datasets Feature
s Forward (Accuracy Rate) Backward (Accuracy Rate)
Stepwise (Accuracy Rate)
1 Breast Cancer Data 30 0.9578 0.9701 0.956
2 WDBC Data 29 0.9578 0.9701 0.9596
3 Appendicitis 7 0.8964 0.8582 0.8691
4 Auatralia 14 0.8549 0.8636 0.8549
5 Haberman 3 0.745 0.7453 0.7482
6 Heart 13 0.8593 0.8519 0.8519
7 Hepatitis 19 0.8625 0.925 0.875
8 lonosphere 32 0.8286 0.8857 0.8286
9 Magic 10 0.7796 0.784 0.7797
10 Parkinsons 22 0.8668 0.9116 0.8724
11 RingNorm 20 0.6915 0.7627 0.6561
International Journal of Applied Science and Research
115
www.ijasr.org Copyright © 2019 IJASR All rights reserved13 Sona 60 0.7593 0.8029 0.7462
14 SpectfHeart 44 0.794 0.8244 0.794
15 Twonorm 20 0.9219 0.978 0.9228
Table 3: Accuracy rates for the forward, backward and stepwise selection procedures.
(a) Box plot of number of features selected using forward, backward and stepwise tech- niques.
(b) Box plot of classification accuracies in respect of forward, backward and stepwise feature section
techniques.
Figure 1: Box plots of feature selection/classification accuracies for the forward, backward and step- wise techniques.
differences in their various classification accuracies are not statistically significant. For this reason, it is the position ofthe author that any of the Wrapper variant can be used if one aims to reduce the number of features needed in a given classification problem.
References
1. Derksen, Shelley and Harvey J Keselman (1992). “Backward, Forward and Stepwise Automated Sub- set
Selection Algorithms: Frequency of Obtaining Authentic and Noise Variables”. In: British Jour- nal of Mathematical and Statistical Psychology 45.2, pp. 265–282.
2. James, Gareth, Daniela Witten, Trevor Hastie, and Robert Tibshirani (2013). An Introduction to Sta- tistical Learning. Vol. 112. Springer.
International Journal of Applied Science and Research
116
www.ijasr.org Copyright © 2019 IJASR All rights reserved4. Kuhn, Max and Kjell Johnson (2013). Applied Predictive Modeling. Vol. 26. Springer.
5. Lawless, JF and Kishore Singhal (1978). “Efficient Screening of Nonnormal Regression Models”. In:
6. Biometrics, pp. 318–327.
7. Obi, Jude Chukwura (July 2017). “Application of Statistical Computing to Statistical Learning”. PhD thesis. Department of Statistics, The University of Leeds.
8. Wikipedia contributors (2019). Feature Selection — Wikipedia, The Free Encyclopedia. https://
![Übersetzungstheorie und maschinelle Übersetzung (Translation theory and machine translation) [In German]](data:image/gif;base64,R0lGODlhAQABAIAAAP///wAAACH5BAEAAAAALAAAAAABAAEAAAICRAEAOw==)