Original Research Article
A cross-sectional study to evaluate malnutrition prevalence in under 5
children and health seeking behaviour of their parents in an urban slum
area of a metropolitan city
Swapnil M. Inkane
1, Sushant S. Chavan
2*, Mukesh S. Bawa
2, Amol D. Kinge
2INTRODUCTION
Malnutrition is the principal cause of child deaths. Half of all child deaths in India could be prevented if this one issue is tackled.1 Children die because malnutrition lowers a child’s resistance to infection. Malnutrition is one of the largest factors suppressing India’s spectacular growth. In a country of lunar missions and nuclear power, a staggering 48% of all Indian children under five years
old are still underweight. Malnutrition is widespread in rural, tribal and urban slum areas and it is a significant public health problem described as a silent killer, silent emergency, and invisible enemy affecting those who cannot express their voice and have to depend upon others for their advocacy.2
India is home to one of the largest number of children in the world and records about 27 million births per year.3
ABSTRACT
Background: Malnutrition is widespread in rural, tribal and urban slum areas and it is a significant public health problem described as a silent killer, silent emergency, and invisible enemy affecting those who cannot express their voice and have to depend upon others for their advocacy. Numerous studies showed that education of parent’s, especially maternal education emerges as a key element of an overall strategy to address malnutrition. The best global indicator of children’s wellbeing is growth. Assessment of anthropometry is the single measurement that best defines the nutritional and health status of children, and provides an indirect measurement of the quality of life of the entire population.
Methods: Community based cross-sectional study was carried out in an urban slum area of Mumbai city, Maharashtra. Total 300 children of 0-5 years of age were enrolled in the study. A list of all the children below five years of age belonging to study area was taken from the health post situated in premises of UHTC. All mothers or primary care takers of the children were interviewed and weight and height of the children was recorded.
Results: Prevalence of underweight, stunting and wasting was 69.33%, 60.33% and 45.66% respectively. Mother’s literacy, low birth weight and morbidities like diarrhoea, fever and cough in previous fifteen days were significantly associated with malnutrition.
Conclusions: Chronic malnutrition was more prevalent in this area. Mother’s literacy had a much higher impact on better nutritional status of children. Morbidities like diarrhoea, fever and cough had made the children nutritionally vulnerable as malnutrition was higher in those children.
Keywords: Under five children, Urban slum, Prevalence, Malnutrition
Department of Community Medicine, 1Indira Gandhi Government Medical College and Hospital, Nagpur, 2Shri Bhausaheb Hire Government Medical College, Dhule, Maharashtra, India
Received: 06 May 2019
Accepted: 14 June 2019
*Correspondence:
Dr. Sushant S. Chavan,
E-mail: [email protected]
Copyright: © the author(s), publisher and licensee Medip Academy. This is an open-access article distributed under the terms of the Creative Commons Attribution Non-Commercial License, which permits unrestricted non-commercial use, distribution, and reproduction in any medium, provided the original work is properly cited.
India stood at 49 position in respect Under-5 mortality and the Under-5 mortality rate (U5MR), 2012 was 56.4 As 60 million children are underweight in India. It impacts on health education and productivity, persistent under nutrition causing major obstacle to human development and economic growth in the country especially among the poor and vulnerable. In India the physical impairment associated with malnutrition is estimated to cost more than 2-3% of GDP per annum even without considering the long-term productivity losses associated with development and cognitive impairment.4
Numerous studies showed that education of parent’s, especially maternal education emerges as a key element of an overall strategy to address malnutrition.5 The best global indicator of children’s wellbeing is growth. Assessment of anthropometry is the single measurement that best defines the nutritional and health status of children, and provides an indirect measurement of the quality of life of the entire population.
The purpose of this study was to examine and illustrate the relationship between child’s nutritional status and parent’s knowledge of the cause of childhood malnutrition, their educational background and their attitude towards the resources available to improve their children’s condition and socioeconomic background. Health seeking behaviour of their parents was assessed using the framed set of questions regarding the measures taken by them when the child suffers from any illness and a correlation was drawn between the health seeking behaviour of the parents and health status of the child.
METHODS
It was a community based cross-sectional study. The study was conducted in urban slum located in the field practice area of urban health training centre affiliated to a teaching institute and medical college. Study period was of 20 months i.e., from December 2015 to September 2017. This includes planning up the study, setting up protocol, getting the necessary approvals, data collection, analysis of data, data interpretation. Protocol was approved from the institutional committee.
Children between 0-5 yrs. of age group living in the above mentioned locality were included in the study and children, whose parents were not willing to participate, children’s with physical deformity and anthropometry couldn’t be taken were excluded. Taking a prevalence of 48% underweight (as stated by NFHS 3) children a sample size of 300 was derived at using the formula n=4PQ/d2.
The study area selected was sub urban slum in a metropolitan city. A list of all the children below five years of age belonging to study area was taken from the Health post situated in premises of UHTC. The list of “Pulse Polio Immunization” was comprehensive and
contained details of all children below 5 years of age. This list was acquired from health post and used for selecting the child for the study purpose.
The sample of children to be studied was taken from the list by generating random number using “Open Epi-Info” software till the sample size was reached (simple random sampling). The place of residence of the selected children was visited. Face to face interview and necessary information was taken from the parents of the children with the help of “Balwadi” teachers of NGO working in that area. In case, the parents of the child were not available at the time of visit to the residence, the household was revisited shortly, at a time when they were expected to be available. Informed consent was taken from the mothers after explaining them the purpose of the study. Information on demographic, socioeconomic and child characteristics, which included the children’s health status, in the past month prior to the survey, severity of the illness and the mothers’ health seeking behaviour, was collected. The children were classified as stunted, wasted, underweight or normal using the modified WHO growth charts and the WHO standard charts for height-for-age, weight-for-age and weight-for-height charts. Separate charts were used for the boys and girls, as recommended by the WHO. WHO’s “ANTHRO” software was used to classify the above subjects based on their anthropometric parameters.
The determinants of the health status of the child were sought after using the structured set of Anthropometric measurements and health seeking behaviour was assessed with the help of the questionnaire and correlated with the health of the child. Data was entered into excel sheet and then pulled to SPSS for statistical analysis. Test of significance (Pearson’s chi- square test) was applied to find out the association.
RESULTS
In the present study comprising of 300 children aged 0-5 years, 157 (52.34%) were males and 143 (47.66%) were female children. With regards to age distribution it was observed that highest children were found in 49-60 months (22.66%). In this study, majority 187 (62.33%) children were Muslims and 86 (28.66%) children belonged to Hindu religion. Out of total children 195 (65%) children belonged to the joint family and only 35% children belonged to nuclear family. With regards to socio-economic status, majority 191 (63.7%) of children belonged to middle class according to modified B.G. Prasad’s classification. 80 (26.7%) children belonged to lower middle and 29 (9.7%) of the children belonged to lower class. There were no children in the class I or class II socio-economic status.
state average of 70.7%.4 Further among literate mothers, 242 (80.7%) had primary education and 58 (19.3%) had secondary and higher secondary education.
As shown in Table 1, According to WHO growth standard (2006) out of total 300 involved children in the study, percentage of underweight (low weight-for age)
30.3% and percentage of severe underweight was 38.33%. So, the prevalence of underweight (acute malnutrition) was 69.63%. The prevalence of stunting (low height-for-age) and severe stunting was 27.66% and 32.66% which reflected the problem of chronic malnutrition. Wasting (low weight-for-height) was present in 19.16% of children and proportion of severe wasting was 26%.
Table 1: Distribution of children according to WHO classification (n=300).
Indices Undernourished Severely undernourished Total
N % N % N %
Underweight 91 30.33 115 38.33 206 69.33
Stunting 83 27.66 98 32.66 181 60.33
Wasting 59 19.66 78 26 137 45.66
Table 2: Distribution of malnutrition in children according to age and aex (n=395).
Total Underweight Stunting Wasting
Age (months) N % N % N % N %
Upto 12 52 17.3 80 26.5 90 30.1 20 6.66
13-24 55 18.33 96 32.1 175 58.3 33 11
25-36 64 21.33 83 27.8 126 41.2 29 9.66
37-48 61 20.33 118 39.2 170 56.8 22 7.33
49-60 68 22.66 120 40 137 45.6 33 11
χ2
=5.444; p=0.245 χ2=17.900; p=0.001 χ2=16.9; df=8; p=0.03
Sex No % No % No % No %
Male 157 52.34 102 34 92 30.66 76 25.33
Female 143 47.66 104 34.66 89 29.66 61 20.33 Total 300 100 206 68.66 181 60.33 137 45.66
χ2
=7.071; df=2; p=0.029 χ2=0.7; df=2; p=0.7 χ2=1.190; df=2; p=0.552
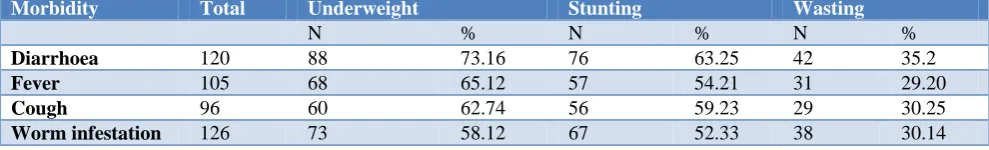
Table 3: Distribution of malnutrition in children according to common morbidities in last 15 days (n=300).
Morbidity Total Underweight Stunting Wasting
N % N % N %
Diarrhoea 120 88 73.16 76 63.25 42 35.2
Fever 105 68 65.12 57 54.21 31 29.20
Cough 96 60 62.74 56 59.23 29 30.25
Worm infestation 126 73 58.12 67 52.33 38 30.14
According to age group underweight was present in 80 (26.5%) children in 0-12 month age group. In the 13-24 months age group 96 (32.1%) children were underweight. Similarly in the 25-36 months, 37-48 months and 49-60 months age group children the prevalence of underweight was 27.8%, 39.2% and 40.0% respectively. Although the prevalence was highest with 40.0% in 49-60 months age group being underweight the difference was not statistically significant. (p=0.245). Similarly stunting was highest with 58.3% in 13-24 months age group and lowest with 30.1% in children in age group of 0-12 months. Here the difference was found to be statistically significant (p=0.001).
Regarding wasting, it was highest in 13-24 months age group and 49-60 months age group both 11 affecting 25.7% children. The distribution of wasting among age
group found statistically significant (p=0.03). In our study only in stunting the second year of life was significantly more affected.
In our study prevalence of underweight and stunting was higher in female affecting 34.6% and 46.3% children respectively but difference was not statistically significant (p=0.370, p=1.000). In regards with wasting, prevalence was higher in male (17.7%) but this difference was also not statistically significant (p=0.927) (Table 2).
literate mothers respectively and was highly significant (p=0.03).
Similarly the prevalence of wasting among children borne by illiterate and literate mothers was observed to be 32.43% and 14% respectively, which was also highly significant (p=0.000).
In our study common morbidities repeated in previous 15 days were diarrhoea, fever, cough and worm infestation. The prevalence of underweight, stunting and wasting was higher in children who has any of these morbidities in last 15 days and the difference was statistically significant (p<0.05).
DISCUSSION
About 27.7% and 32.7% were moderately and severely stunted respectively. The proportion of subjects suffering from moderate or severe underweight was 30.3% and 38.3% respectively. 19.7% of the subjects were suffering from moderate acute malnutrition and 26% (78/300) were suffering from severe acute malnutrition (Table 1).
The findings of the study was comparable to those obtained by the CNSM, which reported proportion of moderate and severe stunting to be 23% and 8% respectively and proportion of moderately and severely underweight to be around 23% and 5% respectively.2 The NNMB report too found similar rates of Moderately Stunted and Underweight children to be around (26% and 29% respectively).6 The DLHS-4 report have found higher rates of stunted, wasted and underweight children.7 Nutrition Foundation of India reported 94% malnourishment in Jabalpur with 84% stunting and 29% wasting.8 The NFHS-3 has reported 44% stunting, 22% underweight and 17% wasting in children.8
Problem of chronic malnutrition was higher among the children in our study which might be the effect of poor feeding practices since birth due to lack of knowledge and poor economic condition. Prevalence of acute malnutrition was lower than chronic malnutrition. Acute malnutrition might be the result of some recurrent infections within short time period which had led the children to under nutrition.
In the present study, the proportion of children who were malnourished gradually increased from the birth to 5 years. The proportion of malnourished children in age groups of up to 12 months, 13-24 months and 25-36 months, 37-48 months and 49-60 months were 38.4%, 60%, 45.3%, 36.06% and 48.5% respectively (Table 2). This could probably because, till 6 months of the age, the nutritional needs of the child are adequately met by the breast milk. Beyond the 6 months, if the complementary feeds are not started in appropriate amounts, frequency and quality, the nutritional status of the child gets affected. However, no statistically significant association
was found between the age of the child and the nutritional status in the study.
The findings of the study were similar to the DLHS-4 report where the proportion of children with malnutrition in children below 6 months was reported to be around 25% which increased to 45% in those between 19-24 months of age.9 Cristine et al too found the lowest rates of malnutrition in children below 6 months of age.10
When the current nutritional status of child was compared with the gender, we find a reversal of trend, 31.2% of male children were severe of the birth i.e. LBW in male 22.3% and female 21%, whereas 46.2% of the female children were severe underweight and the difference was statistically significant. This shows that probably gender bias, in the form of giving better attention and nutrition to the male child, may be present in the study area (Table 2).
Similar findings were also noted by Suresh et al where he found that 38 percent of female children compared to 32 percent of male children were underweight and 53 percent of female children compared to 48 percent of male children are stunted.11
It was observed that there was a declining trend of malnutrition with increase in educational qualification of the mothers.
A number of studies have found a similar relation between the maternal education and nutritional status of the child. The CNSM reported that 33.2% of the children belonging to illiterate mothers were malnourished, as compared to only 18.4% in whom mothers were educated for 10 or more years.12
The findings in our study reflect that mother’s educational qualification is strongly associated with nutritional status of their children. Mother’s literacy played a protective role against malnutrition in children. This might be due to better health care practices in terms of proper exclusive breast feeding, in-time complementary feeding and quality and quantity of complementary feeding among literate mothers as compared to illiterate mothers.
CONCLUSION
In our study, nearly one third of children were underweight (32.4%), half of children were stunted (46.1%) and one fifth of children were wasted (17.2%). So, chronic malnutrition was more prevalent in this area. No child was found to be overweight or obese. Mother’s literacy had a much higher impact on better nutritional status of children. Low birth weight was found to have adverse effect on nutritional status of children. Morbidities like diarrhoea, fever and cough had made the children nutritionally vulnerable as malnutrition was higher in those children
ACKNOWLEDGEMENTS
We would like to thank the Department of Community Medicine Seth G.S. Medical College & Hospital, Mumbai, Urban health Centre Staff Malvani, Malad, Mumbai, Anganwadi and Balwadi Workers Malvani, Malad, Mumbai.
Funding: No funding sources Conflict of interest: None declared
Ethical approval: The study was approved by the Institutional Ethics Committee
REFERENCES
1. Poverty, child undernutrition and morbidity: New evidence from India. Available at: https://www. researchgate.net/-publication/7936888_Poverty_ child_undernutrition_and_morbidity_New_evidence _from_India.pdf. Accessed 21 April 2019.
2. Mathad V, Prasad S. Malnutrition: a daunting problem for india’s spectacular spectacular growth. Indian J Clin Prac. 2013;23(11):760-4.
3. Bhutia DT. Protein energy malnutrition in India: the plight of our under five children. J Fam Med Prim Care. 2014;3(1):63-7.
4. You D, Wardlaw T, Salama P, Jones G. Levels and trends in under-5 mortality, 1990–2008. Lancet. 2010;375(9709):100-3.
5. Park K. Park’s Textbook of Preventive and Social Medicine; 2015. Available at: https://www.world cat.org/title/-parks-textbook-of-preventive-and-social-medicine/oclc/936412409. Accessed 5 May 2019.
6. Living Environment and Health of Urban Poor. Econ Polit Wkly. 2015;50(23):7-8.
7. State Fact Sheet Maharashtra District Level Household and Facility Survey-4 Ministry of Health and Family Welfare; 2012. Available at: http://rchiips.org/pdf/-dlhs4/report/MH.pdf.
Accessed on 5 May 2019.
8. Census of India : Annual Health Survey 2012 - 13 Fact Sheet. Available at: http://www.censusindia. gov.in/-vital_statistics/AHSBulletins/AHS_
Factsheets_2012_13.html. Accessed on 5 May 2019. 9. District Level Household & Facility Survey. http://rchiips.org/DLHS-4.html. Accessed on 5 May 2019.
10. Powell CA, Grantham-McGregor S. The ecology of nutritional status and development in young children in Kingston, Jamaica. Am J Clin Nutr. 1985;41(6):1322-31.
11. Sharma S. Child Health and Nutritional Status of Children: The Role of Sex Differentials. Available at: http://www.iegindia.org/upload/publication/ Workpap/wp262.pdf. Accessed on 5 May 2019. 12. International Institute for Population Sciences.
Available at: http://iipsindia.org/cnsm_report.htm. Accessed on 5 May 2019.
13. Santosh Kumar A, Sunil Kumar D, Ashok NC, Koppad R. Protein energy malnutrition and its association with immunization status and common morbidities among 1-5 year aged children in southern part of India, Mysore. Int J Curr Res Rev. 2013;5(2):105-10.