Characterization of 33 microsatellite markers and
development of multiplex PCR for yellow-throated marten
(Martes flavigula)
Mu-Yeong Lee1, Hea Chang Moon2, Hey Sook Jeon1, Eui-Geun Song3, Donggul Woo3, HeeBok Park3, Tae-Young Choi3, Kyung-Yeon Eo4, Yongsun Hyun5, Kangbok Lee5,
Young-Seok Park6, Ju-Young Moon7, Hyun-Jin Han8, Junghwa An1*
1
National Institute of Biological Resources, 42 Hwangyeong-ro, Seo-gu, Incheon 22689, Republic of Korea
2
Kookmin University, 77 Jeongneung-ro, Seongbuk-Gu, Seoul 02707, Republic of Korea
3
National Institute of Ecology, 1210 Geumgang-ro, Seocheon, Chungcheongnam-do 33657, Republic of Korea
4
Seoul Zoo, 102, Daegong Wong Wangjang-Ro, Gwacheon, Gyeonggi-do 13829, Republic of Korea
5Encironmental Protection Division, Suncheon City Government Official, 30
Jangmyeong-ro, Suncheon, Jeollanam-do 57956, Republic of Korea
6Chungnam Wild Animal Rescue Center, Kongju National University,
Yesan, Chungcheongnam-do 32439, Republic of Korea
7Species Restoration Technology Institute, Korea National Park Service, 33,
Sobaek-ro 2481beon-gil, Yeongju, Gyeongsanbuk-do 36015, Republic of Korea
8Seoul National University, 1, Gwank-ro, Gwanak-gu, Seoul 08826, Republic of Korea
Corresponding author: Junghwa An
E-mail: [email protected]
Genet. Mol. Res. 17 (1): gmr16039854
Received October 14, 2017
Accepted November 08, 2017
Published December 20, 2017
DOI http://dx.doi.org/10.4238/gmr16039854
Copyright © 2017 The Authors. This is an open-access article distributed under the Commons Attribution ShareAlike (CC BY-SA) 4.0 License.
terms of the Creative
ABSTRACT. The yellow-throated marten (Martes flavigula Boddaert 1785) is a medium-sized carnivore and a top predator in South Korea that is distributed throughout Western and Southeast Asia and Siberia in a wide range of habitats. In this study, we developed a panel of polymorphic microsatellite markers for M. flavigula by Illumina next-generation sequencing for investigation of population genetics. A total of 887 candidate microsatellite markers were identified and characterized from genomic sequences. By testing the markers
in three individuals, we found 73 satisfactory microsatellite loci consisting of tri- or tetranucleotide repeats. We designed four multiplex panels of 33 microsatellite loci and applied them to 35 individuals from South Korea. The number of alleles and
polymorphism information content per locus varied from 2 to 9 and from 0.164 to 0.841, respectively. The observed and expected heterozygosity per locus ranged from 0.143 (MF233) to 0.800 (MF339) and from 0.183 (MF233) to 0.871 (MF327) respectively. Nine of the 33 loci deviated significantly from Hardy-Weinberg equilibrium. We also found that at least 10 of the loci were transferrable to two other species of Mustelidae (Meles and Mustela sibirica). These markers can be applied to studies of genetic variation and population structure and can be useful for ex situ conservation and ecological monitoring by non-invasive sampling of M. flavigula populations.
Key words: Population genetics; Martes flavigula; Microsatellite; Next-generation sequencing
INTRODUCTION
The yellow-throated marten (Martes flavigula) is a medium-sized carnivore that is distributed in a wide
geographical range from eastern Afghanistan to the Russian Far East, extending south to the Malaysian peninsula, Sumatra, Java, and Borneo (Corber, 1978; Corbet and Hill, 1992). In South Korea, this species inhabits forest zones in small groups of one to six individuals (mean=2.9 ± 1.6), and helps to control the
population size of herbivores such as Chinese water deer (Hydropotes inermis) (Woo et al., 2015). Given the
extinction of large carnivores (Panthera tigris, Canis lupus, and Panthera pardus) in South Korea, the
yellow-throated marten is expected to become a top predator in ecosystems (Woo et al., 2015). Although the population
size of M. flavigula has been relatively stable in South Korea, it is classified as a Class II endangered species by
the Ministry of Environment of South Korea and as Least Concern on the International Union for Conservation of Nature red list (Chutipong et al., 2016).
Despite its wide distribution and ecological importance, there have been few genetic studies on M. flavigula.
Previous studies on the complete mitochondrial genome (Jang and Hwang, 2014; Xu et al., 2013) and phylogenetic relationships between species (Hosoda et al., 2011; Koepfli et al., 2008; Sato et al., 2003) have
shown that M. flavigula is distantly related to the other species in genus Martes, but no population-level study
has been carried out to clarify genetic diversity and population structure in M. flavigula.
Microsatellites, also known as simple sequence repeats or short tandem repeats, are distributed throughout the nuclear genome and exhibit codominance, Mendelian inheritance, high polymorphism, and a rapid mutation rate, and are therefore suitable tools for population genetics, fingerprinting, parentage identification, genetic
mapping, and ecological and evolutionary analyses (Buschiazzo et al., 2006; Goldstein and Schlötterer 1999;
Guichoux et al., 2011). In the present study, we attempted to identify and characterize novel polymorphic
microsatellite markers for M. flavigula by next-generation sequencing (NGS) and developed multiplex panels
that will reduce the time and cost of genotyping. The utility of the panels was evaluated by the
cross-amplification tests in other Mustelidae species i.e., Meles meles and Mustela sibirica. Our results may provide a
basis for future genetic studies of M. flavigula.
MATERIALS AND METHODS
Samples, DNA isolation, genomic library construction, and NGS
Samples used in this study were collected in compliance with the relevant regulations. Individuals of M.
flavigula (n=35), Meles meles (n=8), and Mustela sibirica (n=12) were collected from several regions of South Korea and tissue samples (muscle, blood, and hair) were preserved at −70°C. Total genomic DNA was extracted using the DNeasy Blood and Tissue kit (Qiagen, Valencia, CA, USA) according to the manufacturer’s protocol. Of 35 individuals, two (IN590 and IN592) were used for NGS. A genomic DNA library was constructed using the NEXTflex Rapid DNA-seq kit (Bioo Scientific, Austin, TX, USA), and DNA was sheared into 500-bp fragments with Q-Sonica 800 (QSonica, Newtown, CT, USA) according to the manufacturer’s instructions. The fragmented DNA was blunt-end repaired, 3′ adenylated, and ligated with multiplex-compatible adapters to construct an Illumina-compatible DNA library. Fragments 300–600 bp in size were selected with Agencourt AMPure XP SPRI beads (Beckman Coulter, Beverly, MA, USA). DNA with adapters on both ends was selectively enriched by PCR. The quality of the constructed DNA libraries was verified on an Agilent 2100 BioAnalyzer (Agilent Technologies, Santa Clara, CA, USA) and the DNA was quantified using a Quant-iT Picogreen dsDNA HS Assay kit (Invitrogen, CA, USA) and the KAPA SYBR FAST qPCR kit (KAPA Biosystems, Woburn, MA, USA). Equimolar amounts of each library were pooled at 10 nM for sequencing,
which was carried out on the high-throughput Illumina HiSeq 2500 platform (Illumina, San Diego, CA, USA) at the Genome Analysis Center of the National Instrumentation Center for Environmental Management, Seoul, South Korea in Rapid Paired End mode (250 cycles).
Data analysis and primer design
NGS generated approximately 42 and 21 Gb of DNA sequence data from everyone. All paired-end sequences were evaluated using PEAR v.0.9.6 (Zhang et al., 2014) to obtain a single read. De novo assembly was performed using CLC Genomics Workbench v.10.0.0.1 (CLCBio, Cambridge, MA, USA). Singleton reads that were not assembled were used for microsatellite identification in the case of tandem repeats of 2–4 bp with a minimum of four repeats. Primers targeting the flanking regions of candidate microsatellite loci were designed using Primer 3 (Rozen and Skaletsky, 2000).
Microsatellite validation and characterization
A total of 179 candidate microsatellite loci were selected for initial screening of polymorphisms in three individual yellow-throated martens. Forward primers were tagged at the 5′ end with either 6-carboxyfluorescein
(6-FAM)-labelled M13 (5′-GGATAACAATTTCACACAGG-3′) or VIC-labelled Hill
(5′-TGACCGGCAGCAAAATTG-3′). For this screen, simplex PCR reactions were carried out in a 20-μL reaction
mixture containing 10× PCR buffer, 2.5 mM MgCl2, 100 μM each dNTP, 0.04 μM forward primer tagged with
M13 or Hill at their 5’ ends, 0.2 μM reverse primer, 0.2 μM each fluorescent dye, 1 U i-start Taq DNA
polymerase, and ~20 ng genomic DNA. The thermal cycling profile was as follows: 95°C for 5 min; 10 cycles of 95°C for 1 min, 60°C to 51°C for 1 min (decreasing by 1°C per cycle), and 72°C for 1 min; and 72°C for 5 min. The annealing temperature for the last 25 cycles was 50°C with denaturation. All primer sets were genotyped using GeneScan-LIZ500 (Applied Biosystems, Foster City, CA, USA) as a size standard and analyzed with Generous Pro v.8.1.9 (Biomatters, Auckland, New Zealand; Kearse et al., 2012). When necessary, PCR products were sequenced to confirm the repeat motif. Direct sequencing was performed using the Big Dye Terminator v.3.1 Cycle sequencing kit (Applied Biosystems) and ABI 3730xl DNA Analyzer (Applied Biosystems). Sequences were analyzed for the presence of repeat motifs and/or primer site mutations using Geneious Pro v.8.1.9.
Fragment analysis and population genetics
After preliminary screening, 28 individuals were genotyped for the candidate loci using fluorescently labeled forward primers, which were connected to one of the 5′ universal primer sequence tails (6-FAM: M13, GGATAACAATTTCACACAGG-3′, VIC: Hill, TGACCGGCAGCAAAATTG-3′; NED: T3, 5′-AATTAACCCTCACTAAAGGG-3′, or PET: Neomycin, 5′-AGGTGAGATGACAGGAGATC-3′; Applied Biosystems). We designed four multiplex panels for 33 microsatellite loci. PCR amplification was performed using the Multiplex PCR Master Mix (Qiagen) in a 50-μL reaction volume containing 25 μL Multiplex PCR
Master Mix (2×) (including HotStarTaq Plus DNA Polymerase and Multiplex PCR Buffer with 3 mM MgCl2),
0.05–0.4 mM primer (Table 1), ~20 ng genomic DNA, and 19 μL RNase-free water. Touchdown PCR parameters were as follows: 95°C for 15 min; 10 cycles of 95°C for 30 s, 60°C for 90 s (decreasing by 1°C per cycle), and 72°C for 60 s; 25 cycles of 95°C for 30 s, 55°C for 90 s, and 72°C for 60 s; and 60°C for 30 min. Each panel was run on an ABI 3730xl DNA Analyzer and sized with GeneScan-LIZ500.
Allele sizes were verified and scored using Geneious Pro v.8.1.9. The occurrence of null alleles, large allele dropout, and stutters interfering with scoring accuracy was evaluated for each microsatellite locus using Micro-Checker v.2.2.3 (Van Oosterhout et al., 2004). Gene pop v.4.2 on the web (Rousset, 2008) was used to detect deviation from Hardy-Weinberg equilibrium (HWE) at each locus and linkage disequilibrium between pairs of
loci. To estimate microsatellite variation, the number of alleles (NA), polymorphism information content (PIC),
fixation index (FIS), observed heterozygosity (HO), and expected heterozygosity (HE) were calculated for a
population using FSTAT (Goudet, 1995) and the Excel Microsatellite Toolkit (Park, 2001).
RESULTS AND DISCUSSION
A total of 887 contigs (di: 451, tri: 156, tetra: 280) containing candidate microsatellite motifs were obtained using bioinformatics tools. Of these, 179 primer pairs consisting of tri- and tetranucleotide motifs were randomly evaluated in simplex PCR reactions using samples from the three individuals, yielding PCR products of the expected size from 73 primer pairs; 45 polymorphic and 28 monomorphic loci were excluded from further characterization. We ultimately selected a set of 33 novel microsatellite loci that were used to generate four multiplex panels (Table 1) based on the degree of polymorphism. The strength and consistency of the loci were
verified by comparing the results from the initial and multiplexing reactions. Detailed information on the loci is provided in Table 1.
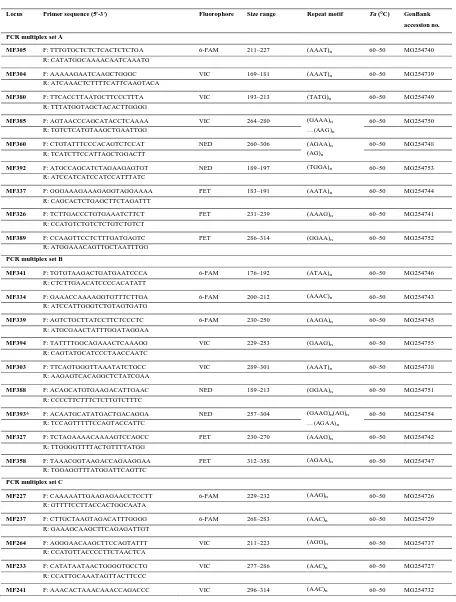
Table 1. Characteristics of 33 newly developed microsatellite loci in M. flavigula in the four PCR multiplexes
Locus Primer sequence (5′-3′) Fluorophore Size range Repeat motif Ta (°C) GenBank
accession no.
PCR multiplex set A
MF305 F: TTTGTGCTCTCTCACTCTCTGA 6-FAM 211–227 (AAAT)n 60–50 MG254740
R: CATATGGCAAAACAATCAAATG
MF304 F: AAAAAGAATCAAGCTGGGC VIC 169–181 (AAAT)n 60–50 MG254739
R: ATCAAACTCTTTTCATTCAAGTACA
MF380 F: TTCACCTTAATGCTTCCCTTTA VIC 193–213 (TATG)n 60–50 MG254749
R: TTTATGGTAGCTACACTTGGGG
MF385 F: AGTAACCCAGCATACCTCAAAA VIC 264–280 (GAAA)n 60–50 MG254750
…(AAG)n
R: TGTCTCATGTAAGCTGAATTGG
MF360 F: CTGTATTTCCCACAGTCTCCAT NED 260–306 (AGAA)n 60–50 MG254748
(AG)n
R: TCATCTTCCATTAGCTGGACTT
MF392 F: ATGCCAGCATCTAGAAGAGTGT NED 189–197 (TGGA)n 60–50 MG254753
R: ATCCATCATCCATCCATTTATC
MF337 F: GGGAAAGAAAGAGGTAGGAAAA PET 183–191 (AATA)n 60–50 MG254744
R: CAGCACTCTGAGCTTCTAGATTT
MF326 F: TCTTGACCCTGTGAAATCTTCT PET 231–239 (AAAG)n 60–50 MG254741
R: CCATGTCTGTCTCTGTCTGTCT
MF389 F: CCAAGTTCCTCTTTGATGAGTC PET 286–314 (GGAA)n 60–50 MG254752
R: ATGGAAACAGTTGCTAATTTGG
PCR multiplex set B
MF341 F: TGTGTAAGACTGATGAATCCCA 6-FAM 176–192 (ATAA)n 60–50 MG254746
R: CTCTTGAACATCCCCACATATT
MF334 F: GAAACCAAAAGGTGTTTCTTGA 6-FAM 200–212 (AAAC)n 60–50 MG254743
R: ATCCATTGGGTCTGTAGTGATG
MF339 F: AGTCTGCTTATCCTTCTCCCTC 6-FAM 230–250 (AAGA)n 60–50 MG254745
R: ATGCGAACTATTTGGATAGGAA
MF394 F: TATTTTGGCAGAAACTCAAAGG VIC 229–253 (GAAG)n 60–50 MG254755
R: CAGTATGCATCCCTAACCAATC
MF303 F: TTCAGTGGGTTAAATATCTGCC VIC 289–301 (AAAT)n 60–50 MG254738
R: AAGAGTCACAGGCTCTATCGAA
MF388 F: ACAGCATGTGAAGACATTGAAC NED 189–213 (GGAA)n 60–50 MG254751
R: CCCCTTCTTTCTCTTGTCTTTC
MF393* F: ACAATGCATATGACTGACAGGA NED 257–304 (GAAG)n(AG)n 60–50 MG254754
…(AGAA)n
R: TCCAGTTTTTCCAGTACCATTC
MF327 F: TCTAGAAAACAAAAGTCCAGCC PET 230–270 (AAAG)n 60–50 MG254742
R: TTGGGGTTTTACTGTTTTATGG
MF358 F: TAAACGGTAAGACCAGAAGGAA PET 312–358 (AGAA)n 60–50 MG254747
R: TGGAGGTTTATGGATTCAGTTC
PCR multiplex set C
MF227 F: CAAAAATTGAAGAGAACCTCCTT 6-FAM 229–232 (AAG)n 60–50 MG254726
R: GTTTTCCTTACCACTGGCAATA
MF237 F: CTTGCTAAGTAGACATTTGGGG 6-FAM 268–283 (AAC)n 60–50 MG254729
R: GAAAGCAAGCTTCAGAGATTGT
MF264 F: AGGGAACAAGCTTCCAGTATTT VIC 211–223 (AGG)n 60–50 MG254737
R: CCATGTTACCCCTTCTAACTCA
MF233 F: CATATAATAACTGGGGTGCCTG VIC 277–286 (AAC)n 60–50 MG254727
R: CCATTGCAAATAGTTACTTCCC
MF241 F: AAACACTAAACAAACCAGACCC VIC 296–314 (AAC)n 60–50 MG254732
R: TCCTTTTCCAACCAACTTCTTA …(AT)n
MF259* F: ACAGTCTGAGAAAAGGACTCCA NED 183–210 (AG)n(AGA)n 60–50 MG254736
R: CCCTTTTGGTAATAGGAAGGAC
MF239 F: GGTGAGTGCTTTGAATTGTGTA NED 291–303 (AAC)n 60–50 MG254731
R: AGTAAAGGATGGTTTTCACTGG
PCR multiplex set D
MF238 F: GGGAATTGAGTATAAAGAGGAAGA 6-FAM 186–198 (AAC)n 60–50 MG254730
R: ACCGTTGATCTTCTAAGGTTGA
MF225 F: TGGTGAGGTACGTGCTATAGTG 6-FAM 251–281 (AAG)n 60–50 MG254725
R: GGGTACTTTGCTGGACATAGAA
MF258 F: CCCTGAATACACTAAAAGCCAA 6-FAM 300–312 (AGA)n 60–50 MG254735
R: CTAAGCCTGAGAGCTGTGAGTT
MF242 F: CATACTTTTGGAGAAAGGCAAC VIC 186–192 (AAC)n 60–50 MG254733
R: CCCACTATTGTCTTTTGTGCTT
MF243 F: ATCTGCAAAACAACATGAACTG VIC 279–293 (AAC)n…(CT)n 60–50 MG254734
TTTT(CA)n
R: TTTCCTTGGCTTAATTCTTTGA
MF236 F: TGTGCTAGGATTCCTTTCATTC NED 210–222 (AAC)n 60–50 MG254728
R: TAGGACCATCTAGCTCCACAGT
MF224 F: TCATATAAATTGGTTAAGCGGC NED 291–306 (AAG)n 60–50 MG254724
R: TAACTACCCATAGCTTGCCATT
MF223 F: CCCACCTTGCAAAATAAAATAA PET 200–218 (AAG)n 60–50 MG254723
R: TGTCTCATGTAAGCTGAATTGG
Ta, Annealing temperature; *These loci do not follow the stepwise mutation model.
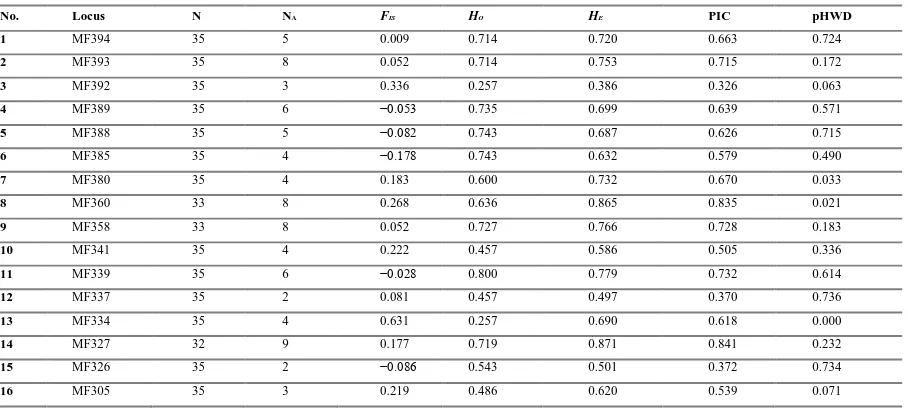
The 33 polymorphic microsatellites were characterized (Table 2). The estimated fragment size at each locus was between 169 and 358 bp, including the tailed primer sequences. The average number of alleles was 4.3, ranging from 2 (MF337, MF326, MF264, MF242, MF233, and MF227) to 9 (MF327 and MF259). PIC per locus ranged
from 0.164 to 0.841, with an average value of 0.541. HO ranged from 0.143 (MF233) to 0.800 (MF339), and HE
ranged from 0.183 (MF233) to 0.871 (MF327). The inbreeding coefficient (FIS) ranged from −0.200 to 0.706.
Significant deviations from HWE were detected for nine of the 33 loci (MF380, MFR360, MF334, MF303, MF243, MF241, MF238, MF236, and MF224); six of these (MF360, MF334, MF327, MF303, MF259, and MF241) exhibited significant homozygote excess, which was likely due to null alleles or stutter issues, as suggested by the Micro-Checker results. Alternatively, it may reflect the Wahlund effect (Wahlund 1928) or non-random mating since the samples collected in this study were from patchy regions. There were 39 cases of linkage disequilibrium between loci in 528 paired comparisons.
Table 2. Estimates of genetic diversity in M. flavigula in South Korea based on 33 microsatellite loci
No. Locus N NA FIS HO HE PIC pHWD
1 MF394 35 5 0.009 0.714 0.720 0.663 0.724
2 MF393 35 8 0.052 0.714 0.753 0.715 0.172
3 MF392 35 3 0.336 0.257 0.386 0.326 0.063
4 MF389 35 6 −0.053 0.735 0.699 0.639 0.571
5 MF388 35 5 −0.082 0.743 0.687 0.626 0.715
6 MF385 35 4 −0.178 0.743 0.632 0.579 0.490
7 MF380 35 4 0.183 0.600 0.732 0.670 0.033
8 MF360 33 8 0.268 0.636 0.865 0.835 0.021
9 MF358 33 8 0.052 0.727 0.766 0.728 0.183
10 MF341 35 4 0.222 0.457 0.586 0.505 0.336
11 MF339 35 6 −0.028 0.800 0.779 0.732 0.614
12 MF337 35 2 0.081 0.457 0.497 0.370 0.736
13 MF334 35 4 0.631 0.257 0.690 0.618 0.000
14 MF327 32 9 0.177 0.719 0.871 0.841 0.232
15 MF326 35 2 −0.086 0.543 0.501 0.372 0.734
16 MF305 35 3 0.219 0.486 0.620 0.539 0.071
17 MF304 35 4 −0.028 0.371 0.361 0.324 1.000
18 MF303 34 4 0.706 0.206 0.694 0.626 0.000
19 MF264 35 2 0.130 0.371 0.426 0.332 0.447
20 MF259 35 9 0.168 0.714 0.857 0.826 0.092
21 MF258 35 4 −0.033 0.514 0.498 0.438 1.000
22 MF243 35 3 0.212 0.457 0.578 0.507 0.023
23 MF242 35 2 0.160 0.314 0.373 0.300 0.376
24 MF241 33 4 0.478 0.273 0.518 0.430 0.003
25 MF239 35 3 0.016 0.629 0.639 0.555 0.782
26 MF238 35 3 0.198 0.457 0.568 0.499 0.002
27 MF237 34 2 0.019 0.471 0.479 0.361 1.000
28 MF236 35 3 0.198 0.457 0.568 0.499 0.002
29 MF233 35 2 0.220 0.143 0.183 0.164 0.279
30 MF227 35 2 0.208 0.400 0.504 0.373 0.308
31 MF225 35 6 0.098 0.714 0.790 0.744 0.098
32 MF224 35 4 0.214 0.486 0.616 0.530 0.046
33 MF223 35 4 −0.200 0.771 0.645 0.591 0.350
FIS, inbreeding coefficient; HE, expected heterozygosity; HO, observed heterozygosity; N, number of individuals genotyped at each
locus; NA, number of alleles; pHWD, expected P value for Hardy-Weinberg equilibrium test; PIC, polymorphism information
content of each locus.
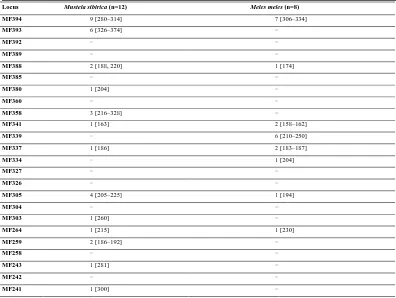
We examined cross-amplification of M. flavigula microsatellite markers to determine their transferability to two
species of Mustelidae, i.e., Meles meles and Mustela sibirica. Not all loci were transferable, with a greater
number of alleles and loci recovered in more closely related species: for example, 19 loci were successfully
amplified in M. sibirica as compared to 10 in M. meles (Table 3), with eight (MF394, MF388, MF341, MF337,
MF305, MF264, MF236, and MF233) amplified in both species. MF394 exhibited greater polymorphism in M.
sibirica (NA=9) and M. meles (NA=7) than in M. flavigula (NA=5). These results indicate that the polymorphic
marker panel developed for M. flavigula can be useful for investigating population genetics and genetic
diversity in other Mustelidae species.
Table 3. Cross-species transferability of 33 microsatellite loci identified in M. flavigula to two other Mustelidae
Locus Mustela sibirica (n=12) Meles meles (n=8)
MF394 9 [280–314] 7 [306–334]
MF393 6 [326–374] −
MF392 − −
MF389 − −
MF388 2 [188, 220] 1 [174]
MF385 − −
MF380 1 [204] −
MF360 − −
MF358 3 [216–328] −
MF341 1 [163] 2 [158–162]
MF339 − 6 [210–250]
MF337 1 [186] 2 [183–187]
MF334 − 1 [204]
MF327 − −
MF326 − −
MF305 4 [205–225] 1 [194]
MF304 − −
MF303 1 [260] −
MF264 1 [215] 1 [230]
MF259 2 [186–192] −
MF258 − −
MF243 1 [281] −
MF242 − −
MF241 1 [300] −
MF239 1 [291] −
MF238 1 [181] −
MF237 − −
MF236 2 [180, 204] 2 [179–203]
MF233 1 [261] 2 [276–279]
MF227 2 [232–236] −
MF225 1 [223] −
MF224 − −
MF223 − −
*Number of alleles and size ranges (in base pairs, shown in brackets) of the PCR product are indicated.
CONCLUSION
In summary, we report 33 novel microsatellite markers in M. flavigula identified by NGS and demonstrate their
transferability to two other Mustelidae species. These results provide a non-invasive analytical tool for ex situ
conservation and ecological monitoring of this important predator.
ACKNOWLEDGMENTS
Genetic samples for this study were collected under permits obtained from the Ministry of Environment, Republic of Korea. This work was supported by grants from the National Institute of Biological Resources (NIBR201703102) and National Institute of Ecology (NIE-Fundamental Research-2017-07) funded by the Ministry of Environment, Republic of Korea.
REFERENCES
Buschiazzo E, Gemmell NJ (2006). The rise, fall and renaissance of microsatellites in eukaryotic genomes. BioEssays. 28: 1040-1050. https://doi.org/10.1002/bies.20470
Chutipong W, Duckworth JW, Timmins RJ, Choudhury A, et al. (2016). Martes flavigula. The IUCN Red List of Threatened Species. 2016: e.T41649A45212973.
Corbet GB (1978). The Mammals of the Palaearctic Region: A Taxonomic Review. British Museum (Natural History) and Cornell University Press, London, U.K., and Ithaca, USA. 314.
Corbet GB, Hill JE (1992). The Mammals of the Indomalayan Region: a Systematic Review. Natural History Museum Publications and Oxford University Press, Oxford, U.K. 488.
Chunzhu X, Honghai Z, Jianzhang M (2013). The complete mitochondrial genome of Martes flavigula. Mitochondrial DNA. 24: 240-242. https://doi.org/10.3109/19401736.2012.752479
Goudet J (2001). FSTAT: A Program to Estimate and Test Gene Diversities and Fixation Indices, Version 2.9.3 Lausanne University: Lausanne, Switzerland.
Hosoda T, Sato JJ, Lin LK, Chen YJ, et al. (2011). Phylogenetic history of mustelid fauna in Taiwan inferred from mitochondrial genetic loci. Can. J. Zool. 89: 559-569. https://doi.org/10.1139/z11-029
Kearse M, Moir R, Wilson A, Stones-Havas S, et al. (2012). Geneious basic: an integrated and extendable desktop software platform for the organization and analysis of sequence data. Bioinformatics. 28: 1647-1649. https://doi.org/10.1093/bioinformatics/bts199
Koepfli KP, Deere KA, Slater GJ, Begg C, et al. (2008). Multigene phylogeny of the Mustelidae: resolving relationships, tempo and biogeographic history of a mammalian adaptive radiation. BMC Biol. 6: 10. https://doi.org/10.1186/1741-7007-6-10
Kuem HJ, Hwang UW (2016). Complete mitochondrial genome of Korean yellow-throated marten, Martes flavigula (Carnivora, Mustelidae). Mitochondrial DNA A DNA Mapp. Seq. Anal. 27: 1785-1786. https://doi.org/10.3109/19401736.2014.963812
Goldstein DB, Schlotterer C (1999). Microsatellites. Evolution and application. Oxford University Press, New York.
Guichoux E, Lagache L, Wagner S, Chaumeil P, et al. (2011). Current trends in microsatellite genotyping. Mol. Ecol. Resour. 11: 591-611.
https://doi.org/10.1111/j.1755-0998.2011.03014.x
Park SDE (2001). The Excel microsatellite toolkit. Trypan tolerance in west African cattle and the population genetic effects of selection. Ph. D thesis, University of Dublin, Dublin, Ireland.
Peakall R, Smouse PE (2006). GenAlEx 6: genetic analysis in excel. Population genetic of software for teaching and research. Mol. Ecol. Notes. 6: 288-295.https://doi.org/10.1111/j.1471-8286.2005.01155.x
Rousset F (2008). GENEPOP’007: a complete re-implementation of the gene pop software for Windows and Linux. Mol. Ecol. Resour. 8: 103-106. https://doi.org/10.1111/j.1471-8286.2007.01931.x
Sato JJ, Hosoda T, Wolsan M, Tsuchiya K, et al. (2003). Phylogenetic relationships and divergence times among mustelids (Mammalia: Carnivora) based on nucleotide sequences of the nuclear interphotoreceptor retinoid binding protein and mitochondrial cytochrome b genes. Zool. Sci. 20: 243-264.https://doi.org/10.2108/zsj.20.243
Schuelke M (2000). An economic method for the fluorescent labelling of PCR fragments. Nat. Biotechnol. 18: 233-234. https://doi.org/10.1038/72708
Van Oosterhout C, Hutchinson WF, Wills DPM, Shipley P (2004). MICRO-CHECKER: software for identifying and correcting genotyping errors in microsatellite data. Mol. Ecol. Notes. 4: 535-538. https://doi.org/10.1111/j.1471-8286.2004.00684.x
Wahlund S (1928). Composition of populations from the perspective of the theory of heredity. Hereditas. 11: 65-105.
https://doi.org/10.1111/j.1601-5223.1928.tb02483.x
Woo DG, Choi TY, Kwon HS, Lee SG, et al. (2015). The food habits and habitat use of yellow-throated martens (Martes flavigula) by snow tracking
in Korean temperate forest during the winter. J. Environ. Impact Assess. 24: 532-548. https://doi.org/10.14249/eia.2015.24.5.532
Zhang J, Kobert K, Flouri T, Stamatakis A (2014) PEAR: a fast and accurate Illumina Paired-end reAd mergeR. Bioinformatics 30: 614-
620.https://doi.org/10.1093/bioinformatics/btt593