2832
An Approach For Improving Page Search By
Clustering With Reference To Web Log Data In R
Anshu Agarwal, Dr Akash Saxena
Abstract: Today in information age, a huge amount of data is available in various form and we need to gain something useful from the data. A way to do so is Data mining, which is a way to retrieve relevant data from huge amount of data stored in databases, files, web logs and many other such means. In the paper, our main concern or source of such data is Web log that has user’s data related to navigation, session details, urls ip etc. The mechanism to derive these data is called web usage mining. It is a type of data mining. User related data along with url visited, active session, browser used, status etc. can also be used to improve page searching process if proper clustering is applied to it. We can understand a user’s access pattern and relevant websites that the user uses commonly and frequently based on various patterns. Clustering commonly is used to form groups based on some similarities. However, before that we need to filter data by removing noises and impurities, treating redundant and missing data. Once this is done and clustering applied we need to find a pattern or infer some result from it. There are various clustering techniques but here we choose k-means and Fuzzy C Means because our study found these two techniques more efficient to implement on the data sets. R tool is used to perform clustering and compare the performance on basis of number of iterations, computation speed, time complexity, size of clusters, view of cluster, number of clusters a lso many other factors were compared generated using R tool to perform clustering. The result generated shows that FCM generates a better result as it allows overlapping although the time complexity and computation time high. In addition, we find that FCM treats outliers well as compared to K-Means as k-means is very sensitive to outliers. The results are satisfactory as per the need.
Index Terms: Web Log, Data Mining, K-Means, FCM, Page Search, Iterations, Computation Time, clusters, R Programming.
—————————— ——————————
1.
INTRODUCTION
INTERNET had tremendously increased the amount of data on the web in terms of size and its usage as the time passes away. And this is not going to keep growing. Data mining is a way which allow us to extract needed data from huge amount of data and utilize it to improve the usage and applications in various fields like medicine, learning, AI, Recommendation, Page search, business etc. Data Mining is a general Mining tool and web log mining is a special form of data mining which specifically allows us to retrieve and deal with web data. It is always a challenge to manage the web data because of its dynamic nature as it keeps updating and changing every fraction of time and keeps multiplying every time we visit the websites or internet. To solve the problem we divide web mining into three different categories: web usage mining, content mining and structure mining. Data mining extracts such data that are understandable and useful to the users [1]. Clustering is a technique that put up the datasets together based on their similarities along with maintaining the groups having similar properties together and putting different datasets into another group that has dissimilarities with the previous groups formed. It partitions the unlabeled dataset into groups of similar items. Data classification and data clustering are two different broader categories used to segregate data for analysis or visualization. Data clustering does not require data labeling as classification but classification performs better but still is complicated to work with labelled data hence it is complex and expensive. In simple words, we can say that data clustering is a technique that creates group of similar objects, having some properties in common.
________________________
Dr Anshu Agarwal is currently Assistant Professor at AURO University, Surat, Gujarat, India, Mo-9510200771. E-mail: [email protected]
Dr Akash Saxena, CIITM, Jaiputr, Rajasthan, India. Mo-9414296027. E-mail: [email protected]
Clustering can be broadly classified into various models as hierarchical, partitioned, exclusive, overlapping, fuzzy, complete or partial and not limited to these models only. Based on implementation it can have various other models. The choice of methods to be selected cannot be fixed and it depends upon the desired output, implementation complexity, time complexity etc. [2] Web mining can be divided into three categories namely, Web Content Mining, Structure Mining and Web Usage Mining. Web Content Mining deals with the content from the web pages like, text, images, multimedia data like audio or video. Web structure mining generally deals with the navigation pattern of the user, where a structural data can be found representing link structure of webpages or web sites. Web Log or Usage Mining is a subset of web mining that particularly deals with content derived form a web log. The data in the web log are not complete and they requires many additional tasks to make it ready for further use. This process is called Data Preprocessing, where incomplete, unwanted or missing data are worked upon so that clustering can be applied to it. These logs many time contain bots, broken link, status error, incomplete path etc. and they are to be removed. After preprocessing next step is pattern discovery that deals with finding some knowledge or relational and statistical is applied on the filtered data for clustering, frequent data set mining, association rule mining etc. and then comes pattern analysis, where we mainly focus on converting the pattern discovery data into the format that is better understood by the target audience. The data here are stored in databases or presented in some other forms. They are converted into visual form, 2D or 3D images or can also be retrieved as per the need using database tools, queries etc. [3]
2 CLUSTERING
objects based on some similarity parameters. Based on capability of clustering algorithm to handle overlapping it can be categorized as hard or soft where hard or crisp does not allow overlapping and soft or fuzzy allow overlapping, one element can belong to multiple clusters [4].
2.1 K-MEANS
It is one of the most used and oldest clustering algorithm used for forming clusters based on unsupervised learning algorithm. [14]. This is most popular because of its simplicity and computationally fast. Clusters formed are center based. It is partition-based algorithm that divides the datasets into k-subsets, where k is number of clusters that need to be specified as input or we need to initialize the number of clusters before performing any kind of partition. A cluster has a centroid, i.e. centre point of any shaped cluster. By this, we mean that the centroid is the data that has maximum relation with other data in the cluster. In addition, a function is used to minimize the distance between the clusters using Euclidian distance formula. This clustering technique work well with numerical data only and are highly effected by the outliers. [15]. In addition, here every data group belongs to the cluster that has nearest mean value. The result of cluster is highly dependent on number of clusters to be formed. If the data set is too small and number of k is selected high then the resultant cluster will not follow the minimization function. For example for 4 data points and two clusters to be formed the considered cluster will be horizontal instead of vertical as the selected centroid will not change the position and hence resultant cluster will not be of good quality. The basic algorithm can be given by following algorithm: [7,15]
1. Select k point, number of clusters to be formed.
2. Repeat to form k clusters and assign a centroid to form initial group. 3. Implement Euclidian distance to form
nearest and closest cluster. 4. Recalculate new centroid until centroid
keeps changing.
The same can be explained as having dataset with n-number of objects. We arbitrarily choose value for k- number of clusters to be formed and then we find the most similar object using Euclidian formula, place them in a cluster, and find the centroid. We keep calculating the distance between the objects and centroid and adding it to the most relevant cluster until and unless the centroid do not change anymore. Every step leads to finding a new centroid, binding is done between data set points and nearest, and new centroid formed. Processing ends up once the centroid does not update themselves. This algorithm minimizes the squared error function given by:
Where last part of formula in the absolute section is the measure of distance between a data point and cluster indicates the distance between data points and their respective cluster centroid.
In addition, k-means works on calculating average, actually that means the related response divided by total
number or responses. However, we do not use the term average as it works with only linear data whereas means works with vector data that is at point A. All related data to an attribute is stored and at B other set of data and so on and adding up a vector means all A’s are added and all B’s are added so on.
2.2 FUZZY C MEANS
It is an extended or derived version of Hard C-Means or k-means commonly called as.it is based on the concept of fuzzy logic and fuzzy set theory. In addition, this assures that every data item belongs to a cluster and in fact can belong to multiple clusters based on the initial matrix used for optimizing the result. The fizzy theory can be explained as any object belong to a set having degree of membership between 0 and 1. Fuzzy clustering is a collection k data sets and a partition matrix where every element has a weight, which represents the degree of membership. It is type of unsupervised learning where problems related to feature analysis; classification and clustering are to be used. It is used in astronomy, agriculture analysis, geology, chemistry, medical diagnosis, target recognition etc. [5]. It is based on Ruspini Fuzzy Algorithm proposed in 1980s. It generates partitions and prototypes for sets of data. The partitions generated are useful for unexplored data. It uses least square function [6] for finding distance between various data points. And the cluster are formed based on the distance calculated and so are the centroids. In this algorithm, the resultant clusters are formed on degree of belongingness. The data points with high belongingness to the data will be placed in the same cluster else will be placed in separate clusters. It works with initial matrix as an input to generate result that is more robust. The similarity measures used for finding the belongingness is intensity, connectivity and distance between the data points [7]. It allows overlapping and hence even the outliers are well managed and irrelevant data is less as compared to other clustering techniques. FCM minimizes the intra cluster variations. It creates a prediction and not probabilistic result. It is very similar to k-means and its functionality. The major advantage of using FCM is that it allows one data to belong to multiple clusters. The minimization objective is given as:
||
Where m stands for any real number greater than 1 and less than infinity, i.e. any valid number, uij is membership
degree, cj is center and || || is similarity between centroid
and data points. Fuzzy partition takes place iteratively optimizing the objective function with updating membership and center of the clusters. The iteration stops when maximum values reaches the minimum criteria specified or when center stops updating. The fuzzy clustering can be represented as collection of clusters C1, C2,C3…..Cn represents the collection of k
clusters, and partition matrix as
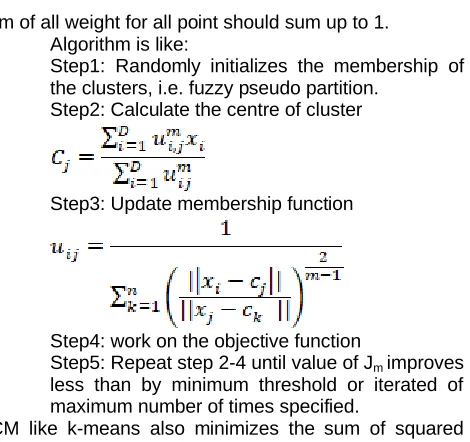
2834 sum of all weight for all point should sum up to 1.
Algorithm is like:
Step1: Randomly initializes the membership of the clusters, i.e. fuzzy pseudo partition.
Step2: Calculate the centre of cluster
Step3: Update membership function
Step4: work on the objective function
Step5: Repeat step 2-4 until value of Jm improves
less than by minimum threshold or iterated of maximum number of times specified.
FCM like k-means also minimizes the sum of squared function. It is highly used in pattern recognition.
The function can be represented as:
Cmeans(x, centers, iter.max = 100, verbose = false, dist = "euclidean", method = "cmeans", m = 2, rate.par = null, weights = 1, control = list ())
Where the parameters can be explained as below X The data matrix where columns correspond to variables and rows to observations.
Centers Number of clusters or initial values for cluster centers.
iter.max Maximum number of iterations.
Verbose If TRUE, make some output during learning. Dist Must be one of the following: If "euclidean", the mean square error, if "manhattan", the mean absolute error is computed. Abbreviations are also accepted. Method If "cmeans", then we have the c-means fuzzy clustering method, if "ufcl" we have the on-line update. Abbreviations are also accepted. M A number greater than 1 giving the degree of fuzzification. More value of it defines the high fuzzy of membership for the data points. rate. Par A number between 0 and 1 giving the parameter of the learning rate for the on-line variant. The default corresponds to 0.3. Weights a numeric vector with non-negative case weights. Recycled to the number of observations in x if necessary. [8] Clusters value contains the matrix having data points based on indices and are assigned to the closets centroid belonging to class of maximal membership. When we talk about fuzzy cluster, these are used to select initial object as a part of fuzzy cluster. Fuzzy toleration relation represents the object set. The clusters formed are such that use fuzzy tolerance relation based on similarity degree to form cluster not more than threshold value. [9] To Summarize FCM is a hard clustering, which is more robust and has the capacity to hold more information as compare to other hard clustering techniques. It is an extension of crisp k-means with fuzzy set domain. It is used for image clustering, pattern recognition and wireless sensor networks for its ability to tolerate ambiguity. The result generated are crisp and precise as compared to other similar clustering of the same family.
3 PROPOSED WORK
The proposed work is to find a better way for page searching using clustering techniques. Where IP address and URL had been considered as the most important fields derived after preprocessing of web log. In addition, these two fields are found to be most suited for our proposed work as they have some link and meaning with all other data headers. We have also formed a hash table of above specified columns that serves as faster processing techniques as compared to storing whole data in a table and creating link between multiple tables. Hash table has the tendency to reduce the complexity and processing time for finding the result. [10] Whole of the records are indexed with the help hash table fields to identify them as a unique data. Then this hash table is used to apply clustering on it to forms groups of dataset that have some similarities in them to provide a better page search to the users.
The design of the database is shown as below
Fig. 1. Database designed from web log data after preprocessing
Fig. 2. Proposed method for comparing the result using clustering techniques.
Here we have introduced a new step of forming hash table for better and faster result generation. Which further is used to form clusters based on k-means and FCM algorithm for choosing any one method to generate needed dataset that are closely linked to each other.
4 RESULTS AND DISCUSSIONS
Here we have taken 156 records as sample size and comparison had been done based on following attributes discussed further.
1) Clusters diagram
2) Based on graph plotted for mean values generated
Table 1 FCM Data
Cluster No. ip url
Cluster 1 64.03919 45.73635 Cluster 2 26774.64575 629.23781 Cluster 3 14651.18476 194.15828 Cluster 4 22199.29894 76.50440 Cluster 5 15093.60155 28025.28025
Graph 1 FCM Means Plot
Table 2 K-Means data
Cluster No
ip url
2836 Graph 2 K- Means Means Plot
3) Based on Computation Time
No of
Records FCM
No of
Iteration
Compilation time
156 61 0.83
105 21 0.28
Graph 3 Compilation time vs Iteration FCM
Graph 4 Compilation Time vs Iteration K-Means
4) Based on Time Complexity (a) No of Cluster
Number of Cluster, k
KMeans (O(nkid)
FCM O(ndk2i)
5 1050 5250
10 2100 21000
15 3150 47250
20 4200 84000
Graph 5 Time Complexity based on No. of Cluster
(b) Number of Iterations
Here we consider number of clusters as 5, data points=105, i=varying, dimension=2. Number of
Iterations, i KMeans FCM
1 1050 5250
No of Records for K Means
No of Iteration Compilation time
156 2 0
105 2 0
0 50 100 150 200
Point 1 Point 2
K-Means Compilation Time vs
Iteration
Iteration Compilation Time No of Records
0 1000 2000
Point 1 Point 2
FCM Compilation Time vs
Iteration
Iteration Compilation Time
2 2100 10,500
3 3150 15,750
Graph 6 Time Complexity on No. of Iterations
5) Other parameters considered
Variable FCM K-Means
Size of cluster 63 8 1 29 4 2 50 58 5 41 Between.ss 1.35e+10 5.31e+10 Within.ss 2022300
9449071 0 18859463 47198 7.45e+07 1.71e+04 2.93e+04 6.51e+05 4.38e+08 tot.within.ss 30378032 5.13e+08
Iteration 21 2
Summary of result generated Sr.
No.
Parameters FCM K-Means
1 Means The means
formed are more crisp and accurate as it depends on fuzzy logic
The means formed are more scattered and distance beteen them is very high. 2 Computation Time High
computation time
Low Computation 3 Time Complexity
based on number of clusters
It is high It is low
4 Time Complexity based on Number of Iterations
High Low
5 Graph Plotted Good and intact clusters
Scattered clusters 6 Size of the clusters
formed
63 8 1 29 4 2 50 58 5 41 7 Between_ss
(Distance between clusters)
1.35e+10 5.31e+10
8 Within_ss (Distance within clusters) 2022300.3 9449070.9 47197.5 18859463.4 0.0 1.43e+08 6.51e+05 2.93e+04 1.58e+07 0.00 9 Total within_ss 30378032 5.13e+08
Iterations 21 2
5 CONCLUSION AND DISCUSSION
The main difference between FCM and K-Means is the partitioning of objects in to groups formed after applying clustering. In K-Means which is a hard clustering the data points belong to one cluster where as in FCM the data points belong to multiple clusters and it treats that every data is a member of every cluster based on degree of “membership”. The similarity is defined by a distance measure; Euclidian distance is the one, which is commonly used in all the clustering techniques. Here we have considered Manhattan’s with Dunn's Fuzziness Coefficient. After generating and comparing the statistical results and graphical results generated by R, we conclude that in terms of time complexity, FCM performs poor but in terms of quality of clusters, it is better as compared to Means. Although beside of the fact that K-Means is easy to implement as compared to FCM it generates poor result in terms of quality of clusters. In addition, the centers are very far located. In FCM clusters of larger size are formed, that means that more related data points are identified and placed in a cluster. Betweenss of FCM is also higher that also means that it forms a better cluster and withinss has to be low. In addition, the same can be seen from the result. The number of iterations is higher in FCM as it uses a fuzzy matrix to find more relevant and related data to be placed in the cluster.
REFERENCES
[1] S. Ghosh and S. K. Dubey, "Comparative Analysis of K-Means and Fuzzy CMeans Algorithms," International Journal of Advanced Computer Science and Applications, vol. 4, no. 4, 2013.
[2] A. Sheshasayee and P. Sharmila, "Comparative Study of Fuzzy C Means and K Means Algorithm for Requirements Clustering," Indian Journal of Science and Technology, vol. 7, no. 6, pp. 853-857, June 2014.
[3] C. Varnaga, N. Madhak, T. Kodinariya and J. Rathod, "Web Usage Mining: A Review on Process, Methods and Techniques," in International Conference in Information Communication and Embedded Systems , Chennai, 2013.
[4] R. Subhashini and V. J. Senthil Kumar, "The Anatomy of Web Search Result Clustering and Search Engines," Indian Journal of Computer Science and Engineering, vol. 1, no. 4, pp. 392-401.
[5] S. Ghosh and S. K. Dubey, "Comparative Analysis of K-Means and Fuzzy CMeans Algorithms," ((IJACSA) International Journal of Advanced Computer Science and Applications,, vol. 4, no. 4, 2013.
[6] D. K. Dharmarajan, K. Balasree and D. K. Abirami, "Students E-Learning Performance Improvement and Predicting the Students Learning Interest Using Data Mining," International Journal of Management, Technology And Engineering, vol. 9, no. 2, February 2019. 0
10000 20000
1 2 3 Category 4
Time Complexity based on
Number of Iterations
2838 [7] A. Agarwal and A. Saxena, "An Accountability of
Various Clustering Techniques for Improvement of Page Searching Process and Analysis," in International Conference on Sustainable Computing in Science, Technology & Management (SUSCOM-2019), Jaipur, 2019.
[8] D. Mayer,
"https://www.rdocumentation.org/packages/e1071 /versions/1.7-0.1/topics/cmeans," [Online]. [9] D. A. Viattchenin, "Heuristic Algorithms of
Possibilistic Clustering," in Studies in Fuzziness and Soft Computing, Berlin, Heidelberg: Springer, 2013.
[10] J. Sastry, C. S. Chittibomma and T. M. R. Alla, "Enhancing the Perfomance of search engines based heap based data file and hash based indexing file," Internaitonal Journal of Engineering and Technology, vol. 7, no. 2.7, 2018.
[11] M. Tiwari and R. Singh, "International Journal of Engineering Research and Development," Comparative Investigation of Means and K-Medoid Algorithm on Iris Data, vol. 4, no. 8, pp. 69-72, November 2012.
[12] O. Bachem, M. Lucic, S. Hassani and A. Krause, "Approximate K-Means++ in Sublinear Time," in Proceedings of the Thirtieth AAAI Conference on Artificial Intelligence (AAAI-16), 2016.
[13] A. David and S. Vassilvitskii, "k-means++: The Advantages of Careful Seeding," in Proceedings of the Eighteenth Annual ACM-SIAM Symposium on Discrete Algorithms, SODA 2007, New Orleans, USA, 2007.
[14] JinHuaXu and H. , "web user clustering analysis based on k means algorithm," international conference on Information Networing and Automation, 2010.
[15] A. K. Mann and N. Kaur, "Grid Density Based Clustering Algorithm," International Journal of Advanced Research in Computer Engineering and Technology, vol. 2, no. 6, June 2013.
[16] A. Agarwal and . D. A. Saxena, "Efficient web mining using clustering techniques for better page searching by enhancing web log data," International Journal of Advanced Research and Development, vol. 2, no. 6, 2017.