INTRODUCTION
While industrial countries such as USA, USSR, Japan, and Germany are developing methods to generate more substitute natural gas(SNG), middle Asian countries like Iran are still flaringhuge amounts of separators natural gasses on the wellheads1.
Modeling for optimization of the conditions (pressure) of separators in multistage separators reduces the amount of gases produced with oil to a minimum.
www.orientjchem.org
CODEN: OJCHEG 2011, Vol. 27, No. (4): Pg. 1503-1508
Est. 1984
An International Open Free Access, Peer Reviewed Research Journal
Optimization of Oil and Gas Multi Stage
Separators Pressure to Increase Stock Tank Oil
MAHSAKAZEMI
Thermodyanmic Laboratory, Faculty of Chemical Engineering, Tarbiat Modanes University, Tehran (Iran).
*Corresponding author: E-mail: [email protected] (Received: April 12, 2011; Accepted: June 04, 2011)
ABSTRACT
A computer simulator is written to optimize the conditions of oil and gas separators using Hysys and Matlab software. Off gases in some wellhead equipment of south of Iran are burnt in flare. In the present paper, the separators of one of these wellheads are simulated. By changing different variables such as the plus fraction splitting methods and the temperature of separators the condition with the least difference with empirical data of crude oil separator test was selected based on which the optimal pressure of separators which minimize total GOR function was calculated. The results show thatusing oftheCavett-Edmister method leads to the lowest value of error andtemperature changes have little effect of the separators conditions.
Key words: Separation, Multi stage separators, Optimization, Gas oil ratio, Crud oil.
composition are exactly specified. In well fluids, or gas reservoirs we face a range of compositions that the quantity and characteristic of all of them is not known to us.Therefore, the optimized conditions of separators have to be specified by a combination of laboratory method and modeling.
Theory
Stage separation of oil and gas is carried out by a series of separators whose pressures gradually decrease. The fluid is discharged from a high pressure separator to the next low pressure separator. The purpose of stage separation is to get the highest amount of hydrocarbon liquid from the well fluid, and provide the highest stability of the two streams of liquid and gas4.
An ideal separation of gas and oil in term of the highest liquid recovery is carried out when the pressure of the well fluid from the wellhead in the separator vessel inlet is reduced to the atmospheric pressure in the separator outlet or near that, and gas or vapor is continuously removed from separator as soon as it is separated from the liquid. This special usage of differential separation is not practical and is never used5.
Some of the advantages of an ideal separator may be realized by using multistage separation.When the pressure of the separator is increased, the gas/oil ratio of the separator is decreased. Increasing the pressure of the separator causes more light molecules enter the stock tank liquid. When the pressure is reduced to the atmospheric pressure, these molecules
leave the liquid phase, and this increases the gas/oil ratio in the stock tank. Therefore, the separator and stock tank gases pass a minimum together. The pressure of this minimum point is referred to as the optimized pressure of the separator6.
MATERIAL AND METHODS
In the laboratory the well fluid is subjected to pressure reduction in several stages and the volume of the produced gas and oil is specified for different conditions.(Separator test). In order to achieve laboratory results, different methods of describing and splitting of the plus fraction are studied and used.
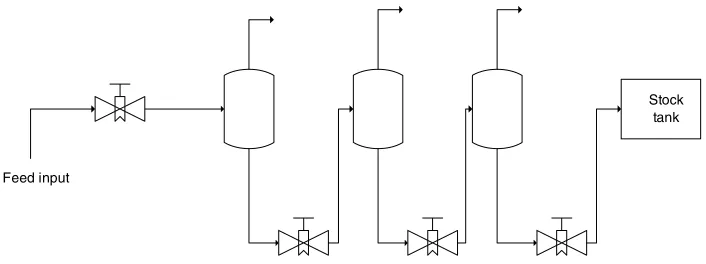
Here, in order to solve the problem, a four-unit set including three separation four-units and one atmospheric storage tank are considered. Well fluid from various oil wells enters the first stage in a simple stream with a given temperature, pressure and flow rate. Temperature and pressure of the entering stream are usually greater than the first stage. The drop in pressure cause flash vaporization. Crude oil from the first stage flows to the second stage. This process continued until the final stage which is a stock tank. Since there is a pressure-reducing valve at the input of each separator vessel, according to the input pressure, there will be three variables for the value of pressure fall in valves and this amount is a dependent value for the fourth valve. The general schema of the considered unit which was simulated by hysys is seen in Figure 1.
Fig. 1: Proposed Schema for calculations
Stock tank
There wasn’t any LPG unit on the sight under study, so it is not considered here. However if there is a LPG plant separators conditions affect the amount of LPG produced7. Optimization in this condition is beyond the scope of this paper, however the producer applied here would be helpful in optimizing of any supposed function.
Thus the problem under studied can be formulated as follow: it is desired to find optimal pressures of stages which minimize total GOR as an objective function.
An important point for optimization of this collection is to develop a mathematical model that is accurate enough to be able to simulate the function of these units properly. Based on this fact, the Peng-Robbinson equation of state is used, for flash calculations which can describe oil mixtureswell8.
Also different methods for plus fraction description such as Riazi-Dauber t-Edmister, Cavett- Edmister ,Lee-Kesler, Bergman andits splitting such as Katz and Ahmed have been studied and employed6. The best method which has the lowest difference with experimental data is chosen and used in determination ofoptimum pressure fall in valves.In this paper, the Simplex method in MATLAB software is used to find the optimum point of GOR function9.
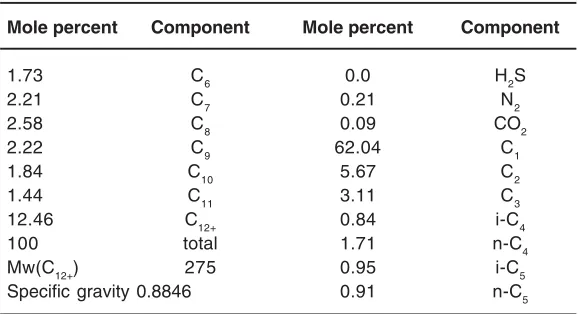
The composition of applied oil for performing simulation is shown in Table 1.
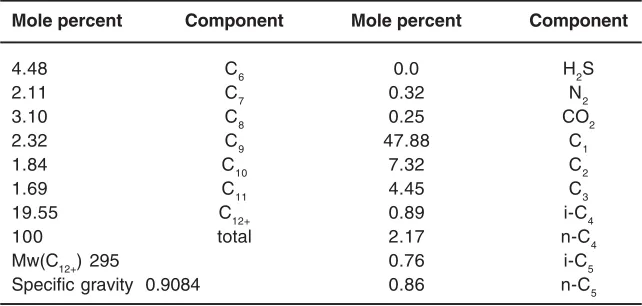
Separator test results for this oil sample are shown in table 2. In this test the oil has encountered pressure fall from bubble point (6100 psia, 209 F0) in four stages.Also another oil sample has been used which its composition is shown in table 3.
Table 1: Composition of oil number1 applied in simulation Mole percent Component Mole percent Component
1.73 C6 0.0 H2S
2.21 C7 0.21 N2
2.58 C8 0.09 CO2
2.22 C9 62.04 C1
1.84 C10 5.67 C2
1.44 C11 3.11 C3
12.46 C12+ 0.84 i-C4
100 total 1.71 n-C4
Mw(C12+) 275 0.95 i-C5
Specific gravity 0.8846 0.91 n-C5
Table 2: Separator test results for oil number 1 Gas / Oil Ratio Separators SCF/Bbl Temp. F Pressure psig
1479.05 110 390
87.1 110 100
24.34 110 30
35.2 110 atmospheric
Table 4: Separator test results for oil number2-120F° Gas / Oil Ratio Separators SCF/Bbl Temp. F Pressure psig
600 120 746.52
90 120 149.78
20 120 28.16
atmospheric 120 38.84
Total GOR : 963.31 API@60 F°:32.99
Table 5: Separator test results for oil number2-95F° Gas / Oil Ratio Separators SCF/Bbl Temp. F Pressure psig
600 95 682.77
90 95 154.43
20 95 29.62
atmospheric 95 46.07
Total GOR : 912.89 API@60 F°:32.3
Table 6: Errors obtained with comparison of total GOR calculated by program with empirical data for oil number1 Plus Fraction properties Spliting Error of total
determination methods method GOR
Riazi-Daubert-Edmister - 3.6%
Cavett- Edmister - 3.16%
Lee-Kesler - 4.14%
Bergman - 3.2%
Riazi-Daubert-Edmister Katz 4.68%
Riazi-Daubert-Edmister Ahmed 6.55%
Separator test results for this oil sample are shown in table 4 and table 5. In these tests the oil has encountered pressure fall from bubble point (4024psia, 215 F0) in four stages in two different temperatures
RESULTS
Error values obtained from comparison of simulation results with experimental data for oil number 1 and 2 are given in table 6, 7 and 8.
Table 3: Composition of oil number2 applied in simulation
Mole percent Component Mole percent Component
4.48 C6 0.0 H2S
2.11 C7 0.32 N2
3.10 C8 0.25 CO2
2.32 C9 47.88 C1
1.84 C10 7.32 C2
1.69 C11 4.45 C3
19.55 C12+ 0.89 i-C4
100 total 2.17 n-C4
Mw(C12+) 295 0.76 i-C5
Table 8: Errors obtained with comparison of total GOR calculated by program with empirical data for oil number 2-95F° Plus Fraction properties Spliting Error of total
determination methods method GOR
Riazi-Daubert-Edmister - 4.96%
Cavett- Edmister - 3.57% L e e
-Kesler - 5.62%
Bergman - 3.91%
Riazi-Daubert-Edmister Katz 6.04%
Riazi-Daubert-Edmister Ahmed 4.46%
Table 9: Optimum pressures for oil number 1 Stages Optimum pressure Gas/oil Ratio
(psia) SCF/Bbl
First stage 619.4 1341.01
Second stage 109.2 137.25
Third stage 28.27 34.03
Forth stage Atmospheric 15.4 Total GOR : 1527.88API@60 F0:44.35
Table 10: Optimum pressures for oil number2-120F°
Stages Optimum pressure Gas/oil Ratio
(psia) SCF/Bbl
First stage 466.4 721.58
Second stage 86.41 102.98
Third stage 25.78 29.55
Forth stage Atmospheric 14.65 Total GOR : 868.78API@60 F0:39.85
Table 11: Optimum pressures for oil number2-95F°
Stages Optimum pressure Gas/oil Ratio
(psia) SCF/Bbl
First stage 499.2 705.4
Second stage 86.37 105.08
Third stage 25.98 30.36
Forth stage Atmospheric 14.94 Total GOR : 856.08API@60 F0:40.22
The method which has the lowest error is Cavett-Edmister without splitting of plus fraction.Obtained optimum pressures of four stages using this method in program are given in table 9, 10 and 11.
DISCUSSION
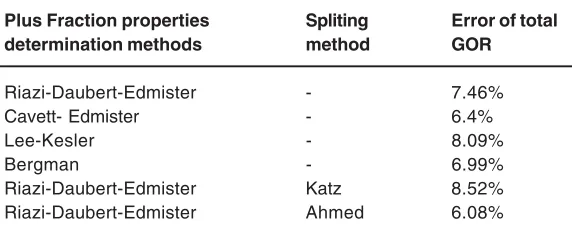
First for relaying on simulation results and finding the best way for plus fraction description, Table 7: Errors obtained with comparison of total GOR calculated
by program with empirical data for oil number 2-120F° Plus Fraction properties Spliting Error of total
determination methods method GOR
Riazi-Daubert-Edmister - 7.46%
Cavett- Edmister - 6.4%
Lee-Kesler - 8.09%
Bergman - 6.99%
Riazi-Daubert-Edmister Katz 8.52%
1. Alameeri,R.,“Optimization of LPG and LNG production from a middle east crude oil”, SPE9624, middle east oil technical conference of SPE held on Manama, Bahrain, (1981).
2. Sánchez-Olea, E. and Martinez-Romero, N., “A New Methodology to Determine the Optimal Pressures ofthe Stages in the Separation Oil-Gas”, SPE 39859, SPE International Petroleum Conference and Exhibitionof Mexico held in Villahermosa, Mexico (1998).
3. Boyer, B.E., and O’Connell, S.C., “Optimize Separator Operating Pressures to Reduce Flash Losses”, SPE 94373, SPE/EPA/DOE Exploration and Production Environmental Conference held in Galveston, Texas (2005). 4. Clar k, N., “Elements of Petroleum Reservoirs”, Society of Petroleum Engineers,
REFERENCES
Dallas (1960).
5. Kalish.P.’’The utilization of flash – differential process to increase stock tank recovery.’’Journal of petroleum technology. 25 (1988).
6. Ahmed, T., “Hydrocarbon Phase Behavior”, Gulf Publishing Co., Huston (1989). 7. “LPG characterization and production
quantification for oil and gas reservoirs”, Journal of Natural Gas Science and Engineering, (2010).
8. Ahmed, T.,” Comparativestudy of eight equations of state for predicting hydrocarbon volumetric phase behavior”. SPE.Reservior Engineering (1988).
9. Constantinides, A. and Mostoufi, N., “Numerical Methods for Chemical Engineers with MATLABApplications”, Prentice Hall Pubs. Co., NJ, (1999).
the results of simulation are compared with crude oil separator test data. So how to describe oil compositions properties is important in following calculations.
What is very important here is the method of oil describing which affects the amounts of error. Splitting the plus fraction of oil does not necessarily lead to better results. When the plus fraction of oil is not split, the method used to describe the plus fraction is important.
After comparison of the results from each method with empirical data, the best method of describing oil is selected and used in the optimization program and determination of the optimized pressures.
The method with the lowest amount of error in total gas/oil ratio is the Cavett-Edmister without splitting of plus fraction. The separator tests carried out on the oil number 2, and the results from the program show the slight effect of changes in temperature on the conditions of separators. A change of %20.83 in temperature results in a change of %1.46 in the total gas/oil ratio.