Psychology Research and Behavior Management
Dove
press
O R i g i n a l R e s e a R c h
open access to scientific and medical research
Open access Full Text article
Taste perception analysis using a semantic
verbal fluency task
Maria ghemulet1,2
Maria Baskini3
lambros Messinis2,4
eirini Mouza1
Hariklia Proios1,5
1Department of speech Therapy,
anagennisis (Revival) Physical Recovery and Rehabilitation centre, Nea Raidestos, Filothei, Thessaloniki, greece; 2Department of speech
and language Therapy, Technological institute of Western greece, Patra, greece; 3Department of Neurosurgery, Interbalkan European Medical Centre, Thessaloniki, greece; 4neuropsychology section,
Department of neurology, University of Patras, Medical school, Patras, greece; 5Department of education
and social Policy, University of Macedonia, Thessaloniki, Greece
Correspondence: Hariklia Proios Department of educational and social Policy, University of Macedonia, 156 egnatia street, PO 1591, 540 06 Thessaloniki, Greece
email [email protected]
Abstract: A verbal fluency (VF) task is a test used to examine cognitive perception. The main aim of this study was to explore a possible relationship between taste perception in the basic taste categories (sweet, salty, sour, and bitter) and subjects’ taste preferences, using a VF task in healthy and dysphagic subjects. In addition, we correlated the results of the VF task with body mass index (BMI). The hypothesis is that categorical preferences would be consistent with the number of verbal responses. We also hypothesized that higher BMI (.30 kg/m2) would correlate with more responses in either some or all four categories. VF tasks were randomly administered. Analysis criteria included number of verbally produced responses, number of clusters, number of switches, number and type of errors, and VF consistency with taste preferences. Sixty Greek-speaking individuals participated in this study. Forty-three healthy subjects were selected with a wide range of ages, sex, and education levels. Seventeen dysphagic patients were then matched with 17 healthy subjects according to age, sex, and BMI. Quantitative one-way analysis of vari-ance (between groups as well as repeated measures), post hoc, and chi-square, and qualitative analyses were performed. In the healthy subjects’ group, the differences among the mean number of responses for the four taste categories were statistically significant. When comparing the two matched groups of healthy and dysphagic subjects, there were no statistically significant dif-ferences in the mean number of responses in the four basic taste categories. However, for both groups, most responses were generated in the following descending order: sweet, salty, sour, and bitter. The bitter category presented the majority of errors for both groups. Obese subjects produced a greater mean number of responses for the “sweet,” “sour,” and “bitter” categories; conversely, underweight subjects produced a larger mean number of responses for the “salty” category, even though these differences were not statistically significant. The relationship of VF with taste perception and BMI could contribute to evidence-based knowledge that can be used for clinical practice.
Keywords: verbal fluency task, dysphagia, body measure index, taste perception, taste preferences
Introduction
Verbal fluency (VF) is a widely used test in cognitive and developmental neuropsy-chology for assessing executive functions and language skills, as well as divergent thinking. Its tasks are considered simple and efficient clinical tools. It is widely used by clinicians in assessment, diagnosis, and prognosis and as a baseline tool for different neurological and neurodegenerative disorders such as head trauma, strokes, dementia, epilepsy, and so on.1–3 The administration procedure allows 1 minute for the participant
to generate as many words as possible according to specific rules. The most commonly
Psychology Research and Behavior Management downloaded from https://www.dovepress.com/ by 118.70.13.36 on 26-Aug-2020
For personal use only.
Number of times this article has been viewed
This article was published in the following Dove Press journal: Psychology Research and Behavior Management
Dovepress
ghemulet et al
used score is the total number of words generated.4,5 Our main
aim was to explore the perception related to the four basic taste categories (sweet, salty, sour, and bitter).
VF tasks involve associative exploration and word retrieval based on phonemic or semantic criteria (phonemic and semantic fluency, respectively), usually conducted in the setting of a time constraint.4,5 Regarding the underlying
cognitive mechanisms, VF tasks are considered to impose comparable demands on executive and supervisory processes, as they both require efficient organization of verbal retrieval and recall.6 Searching for semantic extensions of a
super-ordinate target relies on well-established search strategies consistent with the organizational structure of a word.7
Adequate semantic fluency requires intact semantic memory stores and effective search processes. Category fluency tasks use a more familiar search strategy than phonological tasks because of their reliance on meaning; this is because activa-tion of the first prototypical exemplar automatically activates other semantically related words.8 A review of the literature
shows that the category “animals” is the most frequently employed category;4,9,10 however, other authors have used
foods and vegetables, fruits and drinks,10,11 types of
transpor-tation and car parts,12 items found in a supermarket,4,13 tools
and clothing,14 or inanimate objects.15 To our knowledge,
no study has been reported in the literature using VF for various categories of taste perception in either healthy or dysphagic subjects.
Performance on fluency tasks includes quantitative as well as qualitative measures of the outcomes. The most common quantitative measure involves counting the number of words generated on each task. Still, this does not explain why the number of answers in some categories is lower than in others. There is emerging evidence that fluency is a multifactorial task and that quantitative measures do not fully explain all the important aspects of a participant’s performance. To address this, qualitative aspects of fluency performance have been studied via examination of errors. Regarding semantic fluency, production of category labels (as opposed to specific exemplars) and number of exemplars generated per superor-dinate category were also investigated.13,16,17 To explain the
cognitive mechanism behind fluency performance, Troyer and colleagues suggested that optimal fluency performance involves generating words within a subcategory and, when exhausted, switching to a new category (clustering and switching).5
Clustering involves phonemic analysis on phonemic fluency and semantic categorization on semantic flu-ency and is thought to be a relatively automatic process.
Switching involves cognitive flexibility in shifting from one subcategory to another and is a relatively effortful process.4
Clustering is associated with temporal lobe functioning, as indicated by patients with temporal lobectomy for intract-able epilepsy,18 and is unaffected by focal frontal lesions.19
Switching is related to frontal functioning and is specifi-cally impaired in patients with left dorsolateral and superior medial frontal lobe lesions.18 Decreased switching is observed
under conditions of divided attention,5 in Parkinson’s
dis-ease,17 in Huntington disease,20,21 multiple sclerosis,17 and
schizophrenia.22 Patients with more widespread brain
dysfunc-tion tend to produce little clustering and switching.4
VF deficits were associated with clinical conditions that vary in terms of the relative prominence of frontal dysfunction,17–19,21 as well as focal nonfrontal injuries.7,23 In
a study about the effects of focal frontal and temporal lobe lesions on VF, Troyer and colleagues found that performance on fluency tasks is not specific to lesions in any single brain region but is sensitive to diffuse brain damage.18 They also
found that in patients with damage to the frontal lobes, fluency appears to be related to a poor initiation and/or inflexibility in the search and retrieval process. In comparison, poste-rior lesion patients showed difficulty in switching between categories or subcategories. Moreover, there seems to be a contradiction in the outcome of the performance of temporal lobe patients in fluency tasks. Newcombe, and Corcoran and Upton, showed no difference in performance between tem-poral lobe patients and frontal lobe patients in a semantic flu-ency task.24,25 Patients with semantic dementia (temporal lobe
atrophy) were more impaired in semantic fluency tasks. In Chapey, the semantic lexical task is explained in terms of convergent and divergent semantic tasks.26 Convergent
tasks require a single and obvious answer (eg, “the opposite of hot is …”), whereas divergent tasks allow for multiple answers and no single answer can be designated as “correct” (eg, animal naming). Divergent tasks place an additional loading on nonlanguage cognitive skills. In completing a word fluency task similar to the one in this study, one must use search strategies and decide when a strategy is exhausted or when it would be productive to change strategies.
In some studies, patients with right hemisphere damage (RHD) performed as well as nonimpaired subjects,24 whereas
in other studies, differences were found.16,27,28 Patients with
unilateral left-hemisphere lesions performed worse than patients with unilateral right hemisphere lesions on both types of fluency task.18 Patient groups, ranging from most
impaired to least impaired, are bilateral lesions, unilateral left hemisphere damage, and unilateral RHD.18
Psychology Research and Behavior Management downloaded from https://www.dovepress.com/ by 118.70.13.36 on 26-Aug-2020
Dovepress Verbal fluency in taste perception
Performance on fluency tests is also influenced by demographic characteristics, as most studies confirm the contribution of age and education to word production.9,29,30
Moreover, semantic and phonemic fluency appear to be affected differently by these variables. In contrast, perception may differ, depending on stimulus, and may also vary from subject to subject; for example, a high concentration of a bitter substance may not be perceived as very bitter because of individual variability in sex as well as genetic, aging, and/ or pathological conditions.31 For this reason, preference for
perceptual categories can be reflective of VF productions within these categories.
The ability to perceive flavors begins in the early stages of life.32 This early experience serves as the foundation for
the continuing development of food preferences across the lifespan and is shaped by the interplay of biological, social, and environmental factors. Shortly after birth, young infants show characteristic taste preferences: sweet elicits positive responses and bitter and sour elicit negative responses. These taste preferences may reflect a biological drive toward foods that are calorie-dense and an aversion to foods that are poi-sonous or toxic. The evolutionarily sensible preference for sweetness (“safety taste”) can be explained by the fact that the sweet taste indicates a source of energy (carbohydrates) that is nonpoisonous and is thus safe to eat. A bitter taste, in turn, warns us of toxic foods. Similar evolutionary programming is assumed for other tastes: an acidic taste may, for example, warn against spoiled food, whereas a salty taste may hint at the presence of minerals.33
Dysphagia is a swallowing disorder that occurs in all age groups and is a result of a variety of congeni-tal abnormalities, structural damage, and/or medical conditions, such as lesions, neurological impairments, or degenerative diseases. It involves any one of the three swallowing stages: oral, pharyngeal, or esophageal. Signs of swallowing difficulty or dysphagia include but are not limited to the inability to recognize food, to place food in the mouth, and to control food or saliva in the mouth. It may also involve coughing before, during, or after a swallow or after a meal; recurrent pneumonia; weight loss (when no other apparent reason can be defined); change in voice quality after a swallow or a meal; and patient complaints of swallowing difficulties. When conducting a bedside assessment, the first aim is to gather information about the patient’s eating behavior, oral motor function, and presence of possible language or cognition problems.34
Questions about the weight of the patient are also important in determining possible weight loss.
It has been documented that the presence of foods or liquids and the use of sensory inputs (tactile, optical, thermal, and chemical/taste) are key mechanisms in facilitating swallow modulation.35,36 Light pressure,37 heavy pressure,38
water,39 sour solutions,40 and carbonation41 were found to
be potential sensory stimuli that can modulate or evoke swallowing. Other potential swallowing stimuli that were studied are thermal stimuli,42 air puffs,43 volume of bolus,44
and viscosity.45 Many of these findings lay the foundation
for future experiments in which specific sensory inputs may be further analyzed for their potential to elicit and modulate swallowing in dysphagia.
The body mass index (BMI) is a widely used index to assess the individual’s level of body fat. It is defined as the individual’s body weight in kilograms divided by the square of their height in meters, and its value is universally given in units of kilograms per meters squared. BMI is a better predictor for disease risk than weight alone. A high BMI is associated with health problems related to cardiovascular disease, diabetes mellitus type 2, and certain types of cancer.46
In contrast, low BMI is a good predictor of mortality, espe-cially in the elderly population.47
The main aim of our study is to determine whether there are any qualitative or quantitative differences within the healthy subjects group regarding the VF taste perception related to basic taste categories (sweet, salty, sour, and bitter). In addition, we compared differences in VF results between healthy and a small subgroup of dysphagic subjects. The hypothesis is that the categorical preferences for the four perceptual groups (sweet, salty, sour, and bitter) would be consistent with the number of verbal responses. That is, the most preferred category (sweet, salty, sour, and bitter) will be consistent with the one that subjects generate more in VF. Furthermore, we examined VF in the four taste categories in relation to subjects’ (healthy and dysphagic) variation in BMI. We hypothesize that higher BMI correlates with more responses in some or all four categories.
Methods
Participants
Sixty Greek speaking individuals (43 healthy subjects and 17 dysphagic patients) from the metropolitan area of Thessaloniki participated in this study. Healthy participants (n=43) were selected with a wide range of ages, sex, and education levels and were free of neurological, psychiatric illness, or swal-lowing problems. None of the participants had a history of developmental disorders, substance abuse, or head trauma. They were recruited through specially created advertisements
Psychology Research and Behavior Management downloaded from https://www.dovepress.com/ by 118.70.13.36 on 26-Aug-2020
Dovepress
ghemulet et al
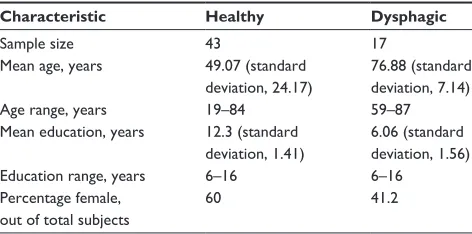
at public areas, such as university campuses and social centers, and through relatives of inpatients by word of mouth. None of the participants received any financial remuneration for participating. Ages ranged from 19 to 84 years (mean age, 49.07 years; standard deviation [SD], 24.17 years), and level of education ranged from 6 to 16 years (primary, middle, high school, and higher education). Of the participants, 60% were women (proportion men/women, 17/26). According to BMI, 9.3% of the healthy subject group were considered to be extreme weight/obese (BMI, $30 kg/m2), 41.8% to be
over-weight (BMI, 25.0–29.99 kg/m2), 32.6% to be normal weight
(BMI, 18.5–24.99 kg/m2), and 16.3% to be underweight
(BMI, #18.49 kg/m2).
All the pathological (dysphagic) participants (n=17) were inpatients of the Anagennisis (Revival) Physical Recovery and Rehabilitation Centre in the region of Thessaloniki. Their ages ranged from 59 to 87 years (mean age, 76.88 years; SD, 7.14 years), and their level of education ranged from 6 to 16 years. Of the participants, 41.2% were women (proportion men/women: 10/7). According to BMI, 5.9% of the dysphagic subject group were considered to be obese/ extreme weight, 35.3% to be overweight, 47.1% to be normal, and 11.7% to be underweight, using the classification given earlier. Table 1 presents the demographic data and Table 2 the BMI analysis of the study population for both healthy and dysphagic subjects.
From the dysphagic participants, 15 subjects had suf-fered stroke (twelve ischemic stroke and three hemorrhagic stroke), 14 subjects were diagnosed with RHD (82.3%), one had brainstem damage (5.9%), one had neuropathy (5.9%), and one had Myasthenia gravis (5.9%). All lesions were documented on computed tomography or magnetic reso-nance imaging scans, and all diagnoses were performed by a neurologist and a rehabilitation physician of the center. The subjects in the clinical group were selected on the basis of the following exclusion criteria: severe dysarthria, inadequate
attention, poor arousal or coma state, old brain lesions, and presence of concomitant left hemisphere lesion, as evident either from the neurological examination or from computed tomography/magnetic resonance imaging findings. Ten (58.8%) of the total dysphagic subjects had restraints for solid food, one had restraints for liquids (5.9%), and six (35.3%) had restraints for both solids and liquids. Of the 17 dysphagic subjects, 14 were eating orally on a no-solid food diet, two were on no-liquid diet, and one had a gastrointestinal feeding tube. All patients were diagnosed with dysphagia after a bedside assessment and, when needed, a video-fluoroscopic examination of swallow (five [29.4%] of the patients needed a video-fluoroscopic examination). Sixteen patients had natural teeth (94.1%); one patient (5.9%) had dentures.
All the participants gave their written consent to partici-pate in the study with the exception of some of the pathologi-cal participants, for whom, because of movement disabilities, written consent was obtained from their first-grade relatives. The ethics approval form was signed by the participant and by the institutional review board of the rehabilitation facility.
In an attempt to minimize differences between the two populations (healthy and dysphagic subjects), a second analysis was conducted. Seventeen dysphagic subjects were matched with 17 healthy subjects according to age and sex; these results are presented later in a separate statistical analysis.
Procedure and scoring
The scheme of administration of the test battery was identical for healthy and dysphagic subjects. The participants were asked to sit comfortably on a chair in a quiet environment. They were provided with general instructions about the tasks and the expected responses. All participants completed the task in a single sitting.
All participants were tested by the same clinician, and the testing took place in a quiet environment without external
Table 1 Demographic data of healthy (n=43) and dysphagic (n=17) subjects
Characteristic Healthy Dysphagic
sample size 43 17
Mean age, years 49.07 (standard deviation, 24.17)
76.88 (standard deviation, 7.14)
age range, years 19–84 59–87
Mean education, years 12.3 (standard deviation, 1.41)
6.06 (standard deviation, 1.56)
education range, years 6–16 6–16
Percentage female, out of total subjects
60 41.2
Table 2 Body mass index data for healthy (n=43) and dysphagic (n=17) subjects
Body mass
index, kg/m2
Frequency Percentage
Healthy Dysphagic Healthy Dysphagic
low (#18.49)
7 2 16.3 11.7
normal (18.5–24.99)
14 8 32.6 47.1
Overweight (25–29.99)
18 6 41.8 35.3
Obese ($30)
4 1 9.3 5.9
Total 43 17 100.0 100.0
Psychology Research and Behavior Management downloaded from https://www.dovepress.com/ by 118.70.13.36 on 26-Aug-2020
Dovepress Verbal fluency in taste perception
noise or any other kind of distraction. Screening consisted of a brief interview to exclude from the sample those with neurological or developmental disorders, psychiatric illness, substance abuse, or swallowing problems. Data were col-lected on height and weight to calculate BMI; data provided regarding height and weight were self-reported.
VF tasks were used in each trial. The four perceptual taste categories were randomly administrated to eliminate the order effect. Non-taste-related distractor categories (eg, sports, colors, or body parts) were used randomly between the fluency tasks for the four taste-related categories (sweet, sour, salty, and bitter), and subjects were required to name a few items from each distractor category. For example, they were presented with the category “furniture,” and the investigator gave some examples of members from this category; in so doing, the investigator demonstrated strategy-guided recall. The participants were then asked to generate in 1 minute (60 seconds) as many items as possible from each category. Because of the nature of the brain damage (RHD in most cases), patients were often producing information unrelated to the task. In such cases, time counting and recording were stopped and patients were asked to respond to the required task. Participants who stopped at the first 10–15 seconds were encouraged to produce more outcomes, whereas participants who continued to produce outputs after the 60 second limit were stopped by the examiner.
The general instructions were provided orally (in Greek) as follows: “I am going to tell you the names of some catego-ries of words. You are required to name as many items as you can from these categories. You will be given 1 minute for each category. For example, when I say ‘furniture,’ you must name furniture like ‘chair, table, bed.’ Now, please name animals.” After ensuring the subjects had a full comprehension of the way to perform the task, they were asked to generate as many items as possible from each taste category: “Now please tell me as many sweet foods as you can think of.”
The responses were analyzed using guidelines proposed by Troyer and colleagues.5 Included in the analysis were the
mean number of clusters produced as well as a qualitative error analysis (ie, egocentric errors, miscellaneous errors, and repetitions). Clusters were defined as groups of successively generated words belonging to the same semantic subcategory, such as homemade sweets, sweet fruits, sweet vegetables, Christmas sweets, and so on. The determination of potential subcategories was determined from actual patterns of words generated by the participants during the VF task, rather than based on an a priori organizational scheme. For example, the “fruit” cluster (subcategory) within the sweet category consists
of “apple, pear, peach, strawberry, grape, orange, tangerine, banana, watermelon, fig, melon, apricot,” whereas the “cheese” cluster (subcategory) within the salty category consists of “cheddar, parmesan, ricotta, cream cheese, gruyere, feta cheese, fried cheese, yellow cheese.” The produced responses were first categorized by the experimenter and then confirmed by a certified dietitian. Switches were defined as transitions between clusters, including single words (ie, cluster size =0). Errors and repetitions were included because they are thought to provide information about the underlying cognitive process regardless of whether or not they were included in the total number of the words generated.5
After completion of the VF task, an additional task was requested to be performed by each subject. All subjects were presented with four randomly arranged cards, each of which was labeled with the name of one of the four taste categories (ie, sweet, sour, salty, and bitter). They were requested to put one card on top of the other (ie, to make a deck of cards) such that the first card on top would represent their most preferred taste category and the last card would represent their least-preferred taste category. In that way, we could investigate any possible relationship between taste preferences and VF production in each taste category. The analysis included only the two “top” card choices from the four perceptual taste cat-egories to compare with verbal responses from the VF task.
statistical analysis
The statistical analyses used for the healthy subject group (N=43) were repeated measures one-way analysis of variance (ANOVA) for the comparison of the number of responses, number of clusters, cluster size, number of switches, and number of errors in the four different taste categories. In addition, for the matched group (n=34, 17 healthy and 17 dysphagic), between-groups one-way ANOVA was used for the same variables. Chi-square analysis was performed for all categorical variables, such as BMI and education, as well as for the comparison of the healthy and dysphagic subgroups in the card-sorting task. Finally, between-groups one-way ANOVA was used to compare the number of responses in the combined group of 60 subjects (43 healthy and 17 dys-phagic) in terms of VF and BMI. All the statistical analyses were performed using SPSS software version 20 for Windows (IBM Corporation, Armonk, NY, USA) and Microsoft Excel (Microsoft Corporation, Redmond, WA, USA).
Results
Scores of the following five variables were obtained and analyzed for each fluency task: mean number of responses
Psychology Research and Behavior Management downloaded from https://www.dovepress.com/ by 118.70.13.36 on 26-Aug-2020
Dovepress
ghemulet et al
or words generated (including errors and repetitions), mean number of clusters produced, mean cluster size (counted starting with the second word in a cluster; ie, a single word was given a cluster size of 0, two words a cluster size of 1, three words a cluster size of 2, and so forth), mean number of switches, and VF consistency with taste preferences.
healthy subject group
The highest mean number of responses produced by the healthy participants was 10.30 (SD, 3.99 for the “sweet” cat-egory), followed by 7.19 (SD, 3.06) for the “salty” category, and then 5.37 (SD, 2.29 for the “sour” category), and last, 2.93 (SD, 2.09) for the “bitter” category. The differences among the mean number of responses for the four taste cat-egories were found to be statistically significant by a repeated measures ANOVA [Wilks’ Lambda, 0.216; F(3,40), 48.523;
P,0.05; η2, 0.784]. Post hoc comparisons indicated that each
pairwise difference was significant (P,0.05).
Analysis of the mean number of clusters produced by the healthy participants also showed statistically significant differences [Wilks’ Lambda, 0.623; F(3,40), 8.064; P,0.05;
η2=0.377]. The mean number of produced clusters for the
sweet category was 0.93 (SD, 0.83), for the salty category it was 0.93 (SD, 0.88), for the sour category it was 1.05 (SD, 0.84), and for the bitter category it was 0.4 (SD, 0.66). Post hoc comparisons indicated that pairwise differences in the mean number of clusters were statistically significant only for the bitter category compared with the other three categories (P,0.05). Investigation of mean cluster size by the healthy subjects revealed no statistically significant differences among taste groups [Wilks’ Lambda, 0.806; F(3,40), 0.241;
η2, 0.194]. The mean cluster size for the sweet category was
1.00 (SD, 1.67), for the salty category it was 1.33 (SD, 1.36), for the sour category it was 1.67 (SD, 1.63), and for the bit-ter category it was 1.17 (SD, 0.75). Inspection of the mean number of switches produced by the healthy subjects showed statistically significant differences among taste groups [Wilks’ Lambda, 0.216; F(3,40); 48.43; P,0.05; η2, 0.784].
Post hoc comparisons indicated that each pairwise difference was significant. The mean number of switches for the sweet category was 7.67 (SD, 3.66), for the salty category it was 4.49 (SD, 2.47), for the sour category it was 2.26 (SD, 1.51), and for the bitter category it was 1.42 (SD, 1.24). On the basis of the mean number of responses and the mean number of switches produced by the healthy subjects, the results show a persistent ranking of the taste categories, with the sweet category being the most dominant followed by salty, sour, and finally, bitter. The mean number of clusters produced was statistically significantly lower only for the bitter category compared with the other three categories.
analysis of the errors
The errors produced were analyzed in terms of mean num-ber of errors (including repetitions) and error quality. As can be seen in Table 3, the biggest number and percentage of errors were produced in the bitter category (20.63%), followed by the sweet category (1.84%), the sour category (0.94%), and finally the salty category (0.64%). A repeated measures ANOVA revealed a statistically significant dif-ference in the mean number of produced errors [Wilks’ Lambda, 0.7; F(3,40)=5.52; P,0.05; η2, 0.293]; post hoc
comparisons indicated that pairwise differences in the mean number of produced errors were statistically significant only for the bitter category compared with the other three categories (P,0.05). More specifically, the mean number of errors per subject for the bitter category was 0.62 (SD, 0.91), whereas the mean number of errors per subject for the sweet category was 0.19 (SD, 0.45), for the salty cat-egory it was 0.05 (SD, 0.21), and for the sour catcat-egory it was 0.12 (SD, 0.45).
The qualitative analysis of the errors was performed by categorizing them as egocentric, miscellaneous, and repeti-tion errors, as can be seen in Table 4, for all four VF taste categories (sweet, salty, sour, and bitter).
Most of the subjects explained their responses in terms of personal opinion or past taste experience. The errors that
Table 3 Quantitative summary of errors for the four verbal fluency taste categories (sweet, salty, sour, and bitter) for the group of
43 healthy subjects
Taste category Number of errors/total
number of produced responses
Percentage errors out of total number of produced responses
Egocentric (personal opinion)
Miscellaneous Repetitions
sweet 8/443 1.84 5 1 2
salty 2/310 0.64 2 – –
sour 5/231 0.94 3 2 –
Bitter 26/126 20.63 20 6 –
Psychology Research and Behavior Management downloaded from https://www.dovepress.com/ by 118.70.13.36 on 26-Aug-2020
Dovepress Verbal fluency in taste perception
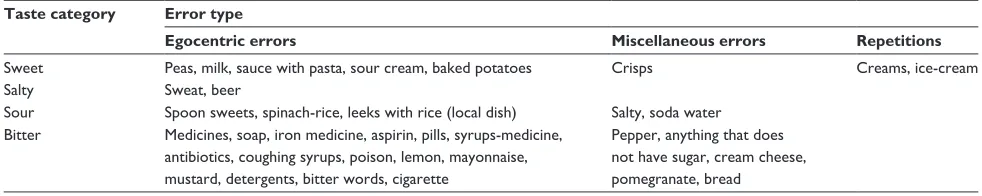
Table 4 Breakdown and list of errors (egocentric, miscellaneous, and repetition error types) for the four verbal fluency taste categories
(sweet, salty, sour, and bitter) for the group of 43 healthy subjects
Taste category Error type
Egocentric errors Miscellaneous errors Repetitions
sweet Peas, milk, sauce with pasta, sour cream, baked potatoes crisps creams, ice-cream
salty sweat, beer
sour Spoon sweets, spinach-rice, leeks with rice (local dish) salty, soda water
Bitter Medicines, soap, iron medicine, aspirin, pills, syrups-medicine, antibiotics, coughing syrups, poison, lemon, mayonnaise, mustard, detergents, bitter words, cigarette
Pepper, anything that does not have sugar, cream cheese, pomegranate, bread
were explained by the subjects but were not consistent with the examiner’s opinion or that of a certified dietician were characterized as egocentric errors. Examples of egocentric errors are when items such as milk or peas were considered sweet, sweat as salty, spinach-rice and spoon-sweets as sour, and medicines, soap, and cigarettes as bitter. In the bitter category, 12 of a total of 20 egocentric errors were related to medicines such as pills or syrups. Outputs that did not match under any of the presented categories were classified as miscellaneous. Examples of miscellaneous errors are when pizza and chips were considered sweet, pepper as salty, ice and soda as sour, or fish, vinegar, and bread as bitter.
The sorting of the four cards, labeled with the name of one of the four taste categories (ie, sweet, sour, salty, or bitter), demonstrated that only 39.5% (17/43) of healthy subjects arranged the cards in a way consistent with their responses in the VF task. For example, subject 3 generated more verbal responses in the sweet and salty categories, and when asked to sort the labeled cards, the subject placed the card labeled sweet on top, followed by the card labeled “salty.”
comparison of matched groups
To facilitate a better comparison between the two subject groups, the healthy subject group was confined to match the demographic characteristics of the dysphagic group in terms of sex, age, level of education, and BMI. This was performed in a way that would eliminate any confounding factors that could influence the validity of our study. With this selec-tion, the demographic characteristics of the two matched groups showed no statistically significant differences to the
P,0.05 level in sex, as both groups had exactly the same numbers of men and women (proportion men/women, 10/7); age [healthy subjects mean age was 75.94 (SD, 7.47); the dysphagic subjects mean age was 76.88 (SD, 7.15), whereas using between-groups one-way ANOVA, F(1,32)=0141]; level of education [where using a chi-square test yields
χ2(5,34)=3.33]; and BMI [where using a chi-square test
yields χ2(3,34)=0.69]. The comparisons of education and
BMI in the matched group were performed using categorical variables (ie, for education, 1 was used for primary education, 2 for middle school, 3 for high school, 4 and 5 for higher education, and 6 for postgraduate education; for BMI, 1 was used for BMI #18.49 kg/m2, 2 for BMI between 18.5 and
24.99 kg/m2, 3 for BMI between 25 and 29.99 kg/m2, and
4 for BMI $30 kg/m2).
Analysis of the results from the matched groups (17 healthy subjects and 17 dysphagic subjects), using one-way between-groups ANOVA, showed no statistically significant differ-ences to P,0.05 in the mean number of responses, with F(1,32)=1.25 for the sweet, F(1,32)=0.74 for the salty, F(1,32)=0.83 for the sour, and F(1,32)=1.4 for the bitter. Moreover, in terms of mean number of responses, in both groups, sweet was the most predominant category, followed by salty, sour, and bitter.
In addition, no statistically significant differences were found in the matched group for the mean number of clus-ters, with F(1,32)=0.38, F(1,32)=0.52, F(1,32)=0.78, and F(1,32)=0.5 for the sweet, salty, sour, and bitter categories, respectively, or for the mean cluster size, with F(1,32)=0.3, F(1,32)=0.84, F(1,32)=0.53, and F(1,32)=0.45 for the sweet, salty, sour, and bitter categories, respectively. For the mean number of switches, no statistically significant differences were observed in three of four categories, with F(1,32)=1.9 for the salty, F(1,32)=2.38 for the sour, and F(1,32)=0.21 for the bitter category; only in the sweet category did the healthy subjects produce a significantly higher mean number of switches than dysphagic subjects, with F(1,32)=7.13; the healthy subjects had a mean of 5.47 (SD, 2.35) and the dysphagic subjects had a mean of 3.18 (SD, 2.65).
A more detailed examination of the errors made by the two matched groups using one-way between-groups ANOVA showed that there were no statistically significant differences
Psychology Research and Behavior Management downloaded from https://www.dovepress.com/ by 118.70.13.36 on 26-Aug-2020
Dovepress
ghemulet et al
between the groups (P,0.05) in the mean number of errors per category, with F(1,32)=0.70 for the sweet, F(1,32)=0 for the salty, F(1,32)=1.0 for the sour, and F(1,32)=0.03 for the bitter. Moreover, no statistically significant differences were found in the number of egocentric errors, with F(1,32)=2.23, or in the number of miscellaneous and repetitive errors, with F(1,32)=3.6.
Regarding the sorting of the four cards, labeled with the name of one of the four taste categories (ie, sweet, sour, salty, or bitter), results demonstrated that only 29.4% (5/17) of healthy participants in the matched group arranged the cards in a way consistent with their responses, whereas 41.2% (7/17) of the dysphagic subjects had the same taste preferences/VF responses matching. However, this difference was not found to be statistically significant to the P,0.05 level, based on a chi-squared test, with χ2(1,34)=0.52.
VF task and BMI
Because no statistically significant differences (P,0.05) were found between the two matched groups, we decided to combine the group of 43 healthy subjects with the group of 17 dysphagic subjects, which resulted in a group with a total of 60 subjects. VF responses of the 60 subjects were then examined and analyzed with relation to their BMI. The hypothesis was that higher BMI correlates to more responses in some or all four categories.
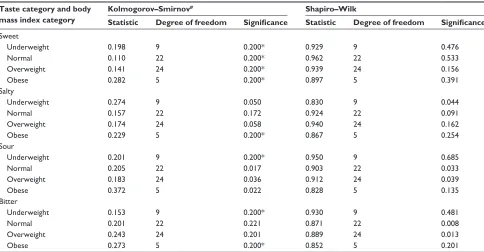
A normality test (Kolmogorov–Smirnov statistic) was first conducted to compare the empirical cumulative dis-tribution functions of the two samples (refer to Table 5). The null hypothesis was that both groups are normally distributed. The empirical findings of the normality test showed that the data follow a normal distribution, and therefore it was possible to use parametric tests. One-way between-groups ANOVA and post hoc analyses were conducted (the mean difference is significant at the 95% confidence interval).
On the basis of the BMI of the group consisting of the total number of subjects, 15% of the subjects (9/60) were underweight (BMI, #18.49 kg/m2), 36.7% (22/60) were of
normal weight (BMI, 18.5–24.99 kg/m2), 40% (24/60) were
overweight (BMI, 25.0–29.99 kg/m2), and 8.3% (5/60) were
obese (BMI, $30 kg/m2).
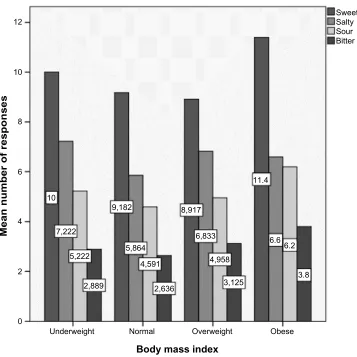
As seen in Figure 1, underweight subjects produced the following mean numbers of responses: in the sweet category, the mean was 10.00 (SD, 5.83); in the salty cat-egory, the mean was 7.22 (SD, 2.86); in the sour catcat-egory, the mean was 5.22 (SD, 3.27); and in the bitter category, the mean was 2.89 (SD, 1.62). The normal weight subjects produced a mean of 9.18 (SD, 4.53), 5.86 (SD, 3.85), 4.59 (SD, 2.4), and 2.64 (SD, 2.01) in each of the four categories, respectively. Overweight subjects produced a mean of 8.92 (SD, 2.83), 6.83 (SD, 2.46), 4.96 (SD, 2.01),
Table 5 comparison of the empirical cumulative distribution functions for the combined group of 60 subjects Taste category and body
mass index category
Kolmogorov–Smirnov# Shapiro–Wilk
Statistic Degree of freedom Significance Statistic Degree of freedom Significance
sweet
Underweight 0.198 9 0.200* 0.929 9 0.476
normal 0.110 22 0.200* 0.962 22 0.533
Overweight 0.141 24 0.200* 0.939 24 0.156
Obese 0.282 5 0.200* 0.897 5 0.391
salty
Underweight 0.274 9 0.050 0.830 9 0.044
normal 0.157 22 0.172 0.924 22 0.091
Overweight 0.174 24 0.058 0.940 24 0.162
Obese 0.229 5 0.200* 0.867 5 0.254
sour
Underweight 0.201 9 0.200* 0.950 9 0.685
normal 0.205 22 0.017 0.903 22 0.033
Overweight 0.183 24 0.036 0.912 24 0.039
Obese 0.372 5 0.022 0.828 5 0.135
Bitter
Underweight 0.153 9 0.200* 0.930 9 0.481
normal 0.201 22 0.221 0.871 22 0.008
Overweight 0.243 24 0.201 0.889 24 0.013
Obese 0.273 5 0.200* 0.852 5 0.201
Notes: Test of normality for four perception category tastes (sweet, salty, sour, and bitter) and four different body mass indexes (underweight, normal, overweight, and
obese). *This is a lower bound of the true significance; #Lilliefors Significance Correction.
Psychology Research and Behavior Management downloaded from https://www.dovepress.com/ by 118.70.13.36 on 26-Aug-2020
Dovepress Verbal fluency in taste perception
12
10
8
6
10
7,222
5,222
2,889
Underweight Normal Overweight
Body mass index
Obese 5,864
9,182
4,591
8,917
6,833
4,958
3,125
6.6 11.4
Sweet Salty Sour Bitter
6.2
3.8 2,636
Mean number of responses
4
2
0
Figure 1 Breakdown of mean number of responses into the four body mass index groups (underweight, normal, overweight, and obese) for each of the four verbal fluency
taste categories (sweet, salty, sour, and bitter) and for the combined group of 60 subjects (healthy, 43; dysphagic, 17).
and 3.13 (SD, 2.13) responses in each of the four catego-ries, respectively. Finally, the group of obese subjects pro-duced a mean number of 11.40 (SD, 2.97), 6.60 (SD, 1.82), 6.20 (SD, 1.1), and 3.80 (SD, 2.68) responses in each of the four categories, respectively. Using one-way between-groups ANOVA, no statistically significant differences to the P,0.05 level were found among the different weight groups (underweight, normal, overweight, and obese) in the mean values of produced responses for all taste cat-egories, with F(3,56)=0.6 for the sweet, F(3,56)=0.58 for the salty, F(3,56)=0.56 for the sour, and F(3,56)=0.68 for the bitter category.
As can be observed in the same figure, when taking into account the BMI status of the subjects, even though the differences are not statistically significant, the obese group reported the biggest mean number of responses in the sweet, sour, and bitter categories, whereas the underweight group reported the biggest mean number of responses in the salty category compared with the other three groups. In contrast, the normal weight group produced the smallest mean number
of outputs in the salty, sour, and bitter categories compared with the other three groups.
Discussion
VF test and taste perception
in healthy subjects
We collected normative data for a VF taste perception task from a sample group of 43 healthy participants and a group of 17 dysphagic participants. One of the objectives of this study was to examine differences regarding VF within the healthy subject group in terms of taste perception. On the basis of the mean number of responses, the mean number of clusters, and mean number of switches produced, our study showed that in the healthy subjects group, the sweet category was predominant, followed by salty, sour, and then bitter. This is in agreement with other research on taste preferences found in the literature,33,48 suggesting there is a
biologi-cal preset for sweet flavors compared with bitter and sour tastes, which are acquired later in life. Acquired taste refers to that fact that a person gets used to and eventually enjoys
Psychology Research and Behavior Management downloaded from https://www.dovepress.com/ by 118.70.13.36 on 26-Aug-2020
Dovepress
ghemulet et al
a particular taste after being exposed to this particular taste. By age 6 months, most infants have developed a preference for the salty taste.49
Our study on VF responses in taste perception found that subjects produced the biggest number of errors when they were asked to name as many bitter items as they can, as the mean number of errors in the bitter category was found to be statistically significantly higher compared with the other perceptual categories. Even though many factors contribute to food preference, bitterness often predicts toxicity and can be the principal cause of food rejection.50 Bitter taste is a
trait that is acquired later in life through exposure,51 and
as stated earlier, bitter is a controversial taste, and thus is more prone to errors. The bitter taste causes an aversive reaction because most toxic compounds are bitter. From an evolutionary perspective, this aversion may confer a protective function. Exposure to bitter food as well as the genetic makeup of an individual influence the level at which a specific bitter food is perceived as bitter or not (eg, coffee), thus making the bitter flavor a controversial taste category.52,53
In a more in-depth qualitative error analysis, when a response was considered erroneous, subjects were asked to explain their choice. Most erroneous responses were pro-duced by elderly healthy subjects (60–85 years of age), who tended to explain their choice of responses based on a bigger life experience in tastes or flavors. Finally, the two repetitions reported were produced by a young healthy participant and an 83-year-old healthy participant.
Food preferences and VF productions
in the different taste categories
in healthy subjects
In the card sorting task, the results demonstrated that healthy subjects did not show consistency between card sorting and their VF productions. This means that although more responses may have been produced by a single subject during the VF task in a certain taste category, this was not necessarily reflected clearly by the order they sorted the labeled cards in the sorting task. This is in agreement with the distinction between taste preference and taste perception, which has been reported in a review by Drewnowski.54 As
Drewnowski suggests, food preferences are associated with a number of factors, including attitudes, and this in turn may lead to greater production of words within certain perceptual taste categories.54 The question of whether there is a selective
memory store for taste-related categories that does not reflect taste preferences warrants further investigation and could
provide important information for taste-related research and cognitive science.
healthy versus dysphagic subjects and VF
test in the different taste categories
Matched groups of dysphagic and healthy subjects were selected so that there were no statistically significant dif-ferences in sex, age, education, and BMI between the two groups. No statistically significant differences were found in the mean number of responses, mean cluster size, or mean number of clusters for all four taste categories. This is in contrast to previous findings, in which lexical-semantic impairments were found in RHD patients.28,55 Still, the
evi-dence for a RHD lexical deficit of unambiguous linguistic origin is equivocal. Such apparent linguistic deficits are more likely to be the result of other cognitive processing failures associated with right-hemisphere injury. Murray found that there is a negative correlation between attention impairments and word retrieval abilities of RHD patients.56 Our findings
show that there may not be a retrieval difficulty for lexical semantic information in RHD; however, the relatively small number of subjects in the dysphagic group does not allow for more concrete conclusions, and further investigation and larger samples are required.
Statistically significant difference was only found (P,0.05) in the mean number of switches; specifically, the healthy participants produced more switches in the sweet category than those produced by dysphagic subjects. It is known that sweet foods are more frequently used for emo-tional reasons as “comfort foods,” and as noted earlier, sweets are the first innate tastes. In addition, the sweet category is semantically broader than the other three (salty, sour, bitter) taste categories, and there may be a predisposition to produce more switches than any other category because of the number of sweet items that exist.
Further examination of the errors made by the two subgroups (N=17 healthy subjects and N=17 dysphagic subjects) in the matched group identified that again, the category with the biggest number of errors is the bitter category for both matched subgroups. This finding is in agreement with bitter being a controversial and rarely preferred taste.
The results regarding taste preferences in the two matched groups, as measured with the sorting of the four cards labeled with the name of one of the four taste categories, did not demonstrate significant consistency with the VF productions. This finding is in agreement with what was previously dis-cussed in the analysis of the healthy group (N=43), and no
Psychology Research and Behavior Management downloaded from https://www.dovepress.com/ by 118.70.13.36 on 26-Aug-2020
Dovepress Verbal fluency in taste perception
significant differences were found between the two matched subgroups.
effect of BMi on VF test responds
in the different taste categories
From the VF results with respect to BMI, it was found that obese subjects (BMI, .30 kg/m2) produced the
high-est number of responses in the VF task in all categories except for salty. Although the results were not statistically significantly different, they identify a trend. According to Crow, an individual’s taste perception and preferences influence their weight status, and subsequently their BMI.57
A high BMI correlates with higher body weight, which in turn suggests more exposure to food, which may explain why obese subjects were able to yield a higher number of responses in the VF test. Our findings agree with the review of Bartoshuk and colleagues, in which it is suggested that people with a high BMI have a preference for the sweet taste, especially when combined with fat.58 Other studies are
also in agreement with our finding that there is no clear rela-tionship between the salty taste and obesity.57 In contrast,
more responses in the salty taste category by underweight subjects (BMI, ,18.5 kg/m2) could be explained by
patho-logical attitudes about their body weight and preference for foods viewed as nutritious (eg, cheese and fish that belong to the salty taste).59
Disclosure
The authors report no conflicts of interest in this work.
References
1. Zhao Q, Guo Q, Hong Z. Clustering and switching during a semantic verbal fluency test contribute to differential diagnosis of cognitive impairment. Neurosci Bull. 2013;29(1):75–82.
2. Takács Á, Kóbor A, Tárnok Z, Csépe V. Verbal fluency in children with ADHD: strategy using and temporal properties. Child Neuropsychol. 2014;20(4):415–429.
3. Radanovic M, Diniz BS, Mirandez RM, et al. Verbal fluency in the detection of mild cognitive impairment and Alzheimer’s disease among Brazilian Portuguese speakers: the influence of education. Int
Psychogeriatr. 2009;21(6):1081–1087.
4. Troyer AK. Normative data for clustering and switching on verbal fluency tasks. J Clin Exp Neuropsychol. 2000;22(3):370–378.
5. Troyer AK, Moscovitch M, Winocur G. Clustering and switching as two components of verbal fluency: evidence from younger and older healthy adults. Neuropsychology. 1997;11(1):138–146.
6. Reitan RM, Wolfson D. A selective and critical review of neuropsychological deficits and the frontal lobes. Neuropsychol Rev. 1994;4(3):161–198.
7. Henry JD, Crawford JR. A meta-analytic review of verbal fluency performance following focal cortical lesions. Neuropsychology. 2004;18(2):284–295.
8. Leggio MG, Silveri MC, Petrosini L, Molinari M. Phonological group-ing is specifically affected in cerebellar patients: a verbal fluency study.
J Neurol Neurosurg Psychiatry. 2000;69(1):102–106.
9. Tombaugh TN, Kozak J, Rees L. Normative data stratified by age and education for two measures of verbal fluency: FAS and animal naming.
Arch Clin Neuropsychol. 1999;14(2):167–177.
10. Acevedo A, Loewenstein DA, Barker WW, et al. Category fluency test: normative data for English- and Spanish-speaking elderly. J Int
Neuropsychol Soc. 2000;6(7):760–769.
11. Simkins-Bullock J, Brown GG, Greiffenstein M, Malik GM, McGillicuddy J. Neuropsychological correlates of short-term memory distractor tasks among patients with surgical repair of anterior com-municating artery aneurysms. Neuropsychology. 1994;8:246–254. 12. Weingartner H, Burns S, Diebel R, LeWitt PA. Cognitive impairments
in Parkinson’s disease: distinguishing between effort-demanding and automatic cognitive processes. Psychiatry Res. 1984;11(3): 223–235.
13. Arroyo-Anllo EM, Lorber M, Rigaleau F, Gil R. Verbal fluency in Alzheimer’s disease and aphasia. Dementia. 2012;11(1):5–18. 14. Huff FJ, Corkin S, Growdon JH. Semantic impairment and anomia in
Alzheimer’s disease. Brain Lang. 1986;28(2):235–249.
15. Fama R, Sullivan EV, Shear PK, et al. Structural brain corre-lates of verbal and nonverbal fluency measures in Alzheimer’s disease. Neuropsychology. 2000;14(1):29–40.
16. Joanette Y, Goulet P. Criterion-specific reduction of verbal fluency in right brain-damaged right-handers. Neuropsychologia. 1986;24(6): 875–879.
17. Tröster AI, Fields JA, Testa JA, et al. Cortical and subcortical influ-ences on clustering and switching in the performance of verbal fluency tasks. Neuropsychologia. 1998;36(4):295–304.
18. Troyer AK, Moscovitch M, Winocur G, Alexander MP, Stuss D. Clustering and switching on verbal fluency: the effects of focal frontal- and temporal-lobe lesions. Neuropsychologia. 1998;36(6):499–504. 19. Troyer AK, Moscovitch M, Winocur G, Leach L, Freedman M.
Clustering and switching on verbal fluency tests in Alzheimer’s and Parkinson’s disease. J Int Neuropsychol Soc. 1998;4(2):137–143. 20. Ho AK, Sahakian BJ, Robbins TW, Barker RA, Rosser AE, Hodges JR.
Verbal fluency in Huntington’s disease: a longitudinal analysis of phonemic and semantic clustering and switching. Neuropsychologia. 2002;40(8):1277–1284.
21. Rich JB, Troyer AK, Bylsma FW, Brandt J. Longitudinal analysis of phonemic clustering and switching during word-list generation in Huntington’s disease. Neuropsychology. 1999;13(4):525–531. 22. Robert PH, Lafont V, Medecin I, et al. Clustering and switching
strate-gies in verbal fluency tasks: comparison between schizophrenics and healthy adults. J Int Neuropsychol Soc. 1998;4(6):539–546.
23. Henry JD, Crawford JR. A meta-analytic review of verbal fluency performance in patients with traumatic brain injury. Neuropsychology. 2004;18(4):621–628.
24. Newcombe F. Missile Wounds in the Brain. A Study of Psychological
Deficits. London: Oxford University Press; 1969.
25. Corcoran R, Upton D. A role for the hippocampus in card sorting?
Cortex. 1993;29(2):293–304.
26. Chapey R. Cognitive intervention: stimulation of cognition, memory, convergent thinking, divergent thinking, and evaluative thinking. In: Chapey R, editor. Language Intervention Strategies in
Adult Aphasia. 3rd ed. Baltimore, MD: Williams & Wilkins; 1994:
220–245.
27. Martin RC, Loring DW, Meador KJ, Lee GP. The effects of lat-eralized temporal lobe dysfunction on formal and semantic word fluency. Neuropsychologia. 1990;28(8):823–829.
28. Gagnon L, Goulet P, Giroux F, Joanette Y. Processing of metaphoric and non-metaphoric alternative meanings of words after right- and left-hemispheric lesion. Brain Lang. 2003;87(2):217–226.
29. Cohen MJ, Stanczak DE. On the reliability, validity, and cognitive structure of the Thurstone Word Fluency Test. Arch Clin Neuropsychol. 2000;15(3):267–279.
30. Kempler D, Teng EL, Dick M, Taussig IM, Davis DS. The effects of age, education, and ethnicity on verbal fluency. J Int Neuropsychol Soc. 1998;4(6):531–538.
Psychology Research and Behavior Management downloaded from https://www.dovepress.com/ by 118.70.13.36 on 26-Aug-2020
Psychology Research and Behavior Management
Publish your work in this journal
Submit your manuscript here: http://www.dovepress.com/psychology-research-and-behavior-management-journal Psychology Research and Behavior Management is an international,
peer-reviewed, open access journal focusing on the science of psychology and its application in behavior management to develop improved outcomes in the clinical, educational, sports and business arenas. Specific topics covered include: Neuroscience, memory & decision making; Behavior
modification & management; Clinical applications; Business & sports performance management; Social and developmental studies; Animal studies. The manuscript management system is completely online and includes a quick and fair peer-review system. Visit http://www.dovepress. com/testimonials.php to read real quotes from published authors.
Dovepress
Dove
press
ghemulet et al
31. Bartoshuk LM. Comparing sensory experiences across individuals: recent psychophysical advances illuminate genetic variation in taste perception. Chem Senses. 2000;25(4):447–460.
32. Ventura AK, Worobey J. Early influences on the development of food preferences. Curr Biol. 2013;23(9):R401–R408.
33. Logue AW. Die Psychologie des Essens und Trinkens. [The Psychol-ogy of eating and drinking]. Heidelberg, Berlin, Oxford: Spektrum Akademischer Verlag; 1994. German.
34. Logemann JA. Dysphagia: evaluation and treatment. Folia Phoniatr
Logop. 1995;47(3):140–164.
35. Steele CM, Miller AJ. Sensory input pathways and mechanisms in swallowing: a review. Dysphagia. 2010;25(4):323–333.
36. Maeda K, Ono T, Otsuka R, Ishiwata Y, Kuroda T, Ohyama K. Modulation of voluntary swallowing by visual inputs in humans. Dysphagia. 2004;19(1):1–6.
37. Rosenbek JC, Robbins J, Willford WO, et al. Comparing treatment intensities of tactile-thermal application. Dysphagia. 1998;13(1):1–9. 38. Pommerenke W. A study of the sensory area eliciting the swallowing
reflex. Am J Physiol. 1928;84:36–41.
39. Shaker R, Ren J, Bardan E, et al. Pharyngoglottal closure reflex: characterization in healthy young, elderly and dysphagic patients with predeglutitive aspiration. Gerontology. 2003;49(1):12–20.
40. Pelletier CA, Lawless HT. Effect of citric acid and citric acid-sucrose mixtures on swallowing in neurogenic oropharyngeal dysphagia. Dysphagia. 2003;18(4):231–241.
41. Bülow M, Olsson R, Ekberg O. Videoradiographic analysis of how carbonated thin liquids and thickened liquids affect the physiology of swallowing in subjects with aspiration on thin liquids. Acta Radiol. 2003;44(4):366–372.
42. Sciortino K, Liss JM, Case JL, Gerritsen KG, Katz RC. Effects of mechanical, cold, gustatory, and combined stimulation to the human anterior faucial pillars. Dysphagia. 2003;18(1):16–26.
43. Aviv JE, Martin JH, Keen MS, Debell M, Blitzer A. Air pulse quantifi-cation of supraglottic and pharyngeal sensation: a new technique. Ann
Otol Rhinol Laryngol. 1993;102(10):777–780.
44. Kahrilas PJ, Lin S, Logemann JA, Ergun GA, Facchini F. Deglutitive tongue action: volume accommodation and bolus propulsion. Gastroenterology. 1993;104(1):152–162.
45. Lazarus CL, Logemann JA, Rademaker AW, et al. Effects of bolus volume, viscosity, and repeated swallows in nonstroke subjects and stroke patients. Arch Phys Med Rehabil. 1993;74(10):1066–1070.
46. National Institutes of Health. Clinical guidelines on the identification, evaluation, and treatment of overweight and obesity in adults. Bethesda, MD: National Heart, Lung, and Blood Institute; 1998.
47. Seidell JC, Visscher TL. Body weight and weight change and their health implications for the elderly. Eur J Clin Nutr. 2000;54(3)(Suppl 3): S33–S39.
48. Mela DJ. Development and acquisition of food likes. In: Frewer LJ, Risvik E, Schiffersteinz H, editors. Food, People and Society.
A European Perspective of Consumer’s Food Choices. Berlin,
Heidelberg, New York: Springer Verlag; 2001.
49. Stein LJ, Cowart BJ, Beauchamp GK. The development of salty taste acceptance is related to dietary experience in human infants: a prospec-tive study. Am J Clin Nutr. 2012;95(1):123–129.
50. Rozin P, Vollmecke TA. Food likes and dislikes. Annu Rev Nutr. 1986;6(1):433–456.
51. Menella JA, Beauchamp GK. The early development of human flavor preferences. In: Capaldi ED, editor. Why We Eat What We Eat. The
Psychology of Eating. Washington, DC: American Psychological
Association; 1996:83–112.
52. Logue AW. The Psychology of Eating and Drinking. New York: WH Freeman and Co; 1986.
53. Glendinning JI. Is the bitter rejection response always adaptive? Physiol
Behav. 1994;56(6):1217–1227.
54. Drewnowski A. Taste preferences and food intake. Annu Rev Nutr. 19917:237–253.
55. Joanette Y, Goulet P, Hannequin D. Right Hemisphere and Verbal
Communication. New York: Springer-Verlag; 1989.
56. Murray LL. The effects of varying attentional demands on the word retrieval skills of adults with aphasia, right hemisphere brain damage, or no brain damage. Brain Lang. 2000;72(1):40–72.
57. Crow JM. Obesity: insensitive issue. Nature. 2012;486(7403): S12–S13.
58. Bartoshuk LM, Duffy VB, Hayes JE, Moskowitz HR, Snyder DJ. Psychophysics of sweet and fat perception in obesity: problems, solutions and new perspectives. Philos Trans R Soc Lond B Biol Sci. 2006;361(1471):1137–1148.
59. Drewnowski A. Taste responsiveness in eating disorders. Ann N Y Acad
Sci. 1989;575:399–408.
Psychology Research and Behavior Management downloaded from https://www.dovepress.com/ by 118.70.13.36 on 26-Aug-2020