INTERNATIONAL RESEARCH JOURNAL OF PHARMACY
www.irjponline.com
ISSN 2230 – 8407
Research Article
DEVELOPMENT AND VALIDATION OF METHAMPHETAMINE ANALYSIS METHODS IN
DRIED BLOOD SPOT SAMPLE USING GAS CHROMATOGRAPHY – MASS SPECTROMETRY
Yahdiana Harahap *
1,
Reno Saputra
1,
Kuswardani
21
Faculty of Pharmacy, University of Indonesia, Depok, West Java 16424, Indonesia
2National Narcotics Agency Laboratory
*Corresponding Author Email: [email protected]
Article Received on: 27/05/19 Approved for publication: 02/07/19
DOI: 10.7897/2230-8407.1008240
ABSTRACT
Methamphetamine or known as sabu is one of the amphetamine groups that give a very strong central nervous system stimulant effect. Nowadays, the method used to test the specimens to prove a person who had methamphetamine, for example is urine and blood. This research was aimed to develop methamphetamine analysis method in Dried Blood Spot (DBS). This research used non-invasive bio sampling method namely DBS using Gas Chromatography - Mass Spectrometry (GC-MS) because it is suitable for compounds that are stable to high temperatures and present in small levels in the body. This research started from optimization of gas chromatography condition - optimization mass spectrometry, optimization of sample preparation method from DBS, until validation of bio analysis method. The optimum chromatographic conditions were MS-5 capillary DB columns with a length of 30 m; 0.25 mm inner diameter; Helium gas phase 99.999%; 1.0 mL / min flow rate; detection of MS at m / z value 58.00; 91.00; and 77,00 with ephedrine HCl as an internal standard. Sample preparation using liquid-liquid micro-extraction method (LLM) using methanol solvent then residue dried under the flow of N2 gas and reconstituted with 50 μL ethyl acetate. The method obtained was linear in the concentration range 1.750 – 35.000 ng / mL with r > 0.9800. (y = -0.0001 + 0.0004x withr = 0.9987).The validation results of the methamphetamine analysis method performed met the validation requirements based on the EMEA Bio analytical Guideline of 2011. This method can be applied in the detection and analysis of amphetamine in drug abuse.
Keywords: methamphetamine, GC-MS, optimization, validation, Dried Blood Spot, ephedrine HCl, Bioanalysis
INTRODUCTION
Based on data collection from UNODC in 2015, the prevalence of methamphetamines in the world from 2006 to 2013 after increasing its curve included sloping but the total amount was quite high1. In the last five years, the use of amphetamines has been stable, but some have increased dramatically by about 158% of the type of methamphetamine. Based on data that has been successfully recorded by the National Narcotics Agency for the past five years (2012-2016), data on cases of the use of methamphetamine (methamphetamine) were obtained, as many as 1867 cases, marijuana 128 cases and ecstasy 98 cases (National Survey on Narcotics Equal Development, 2016). According to this study it can be concluded that methamphetamine is one of the most abundant sources in society, not the least in Indonesia.
The use of narcotics apart from the provisions of the applicable law in Indonesia, which is a criminal act, must be proven legally. Various tests such as urine tests, blood tests, and other tests were conducted to provide information. To date, businesses related to methamphetamine are using urine or blood specimens. Urine is one the specimens that is often used in drugs or metabolites in the body. However, using urine specimens sometimes has weaknesses such as manipulation; drug levels in the sample are better in urine samples as metabolites and cannot explain the pharmacological effects of analytes in the body2.
Methamphetamine is an air-soluble colorless essential oil. A common form of methamphetamine hydrochloride salt is a form of white crystalline powder that dissolves in air. Illegal products
are mostly powdered, but methamphetamine hydrochloride is pure crystalline solid form3.
At present, one of the specimens that can be used in the analysis of methamphetamine is blood. However, taking blood samples from methamphetamine users is invasive because generally sampling using venipuncture is intravenous so subject discomfort appears. Along with the development of technology, one of the latest bio sampling methods that can be used to identify is Dried Blood Spot (DBS), which is one of the bio sampling methods that has many advantages including a much smaller volume of blood samples taken, easier storage room temperature4.
Based on the research conducted, it is known that the maximum concentration of methamphetamine in saliva reaches 300 ng / mL after 4 hours of use and the maximum concentration of methamphetamine in plasma reaches 35 ng / mL after 4 hours of us5 While the maximum concentration of methamphetamine in urine reaches 4500 ng / mL after 16 hours of use6. Therefore, it is necessary to develop selective and sensitive methods when using blood as a biological matrix.
Based on the explanation above, it is necessary to conduct research on the development and validation of the method of analysis of methamphetamine in DBS used Gas Chromatography - Mass Spectrometry (GC / MS). The method is expected to be applied to the latest forensic laboratory tests on methamphetamine abuse.
MATERIALS AND METHOD
This research was performed at Indonesian National Narcotics Agency starting from February 2018 until June 2018.
The instruments used are Gas Chromatograph - Mass Spectrometer (Agilent GC7890A, MS 5975C (USA) 1.0 μL injection volume, split less injection method), which is equipped with a DB-5 MS Capillary Column with a length of 30 m, an inner diameter of 0.25 mm and film thickness 0.25 μm, spittle, weighing scale, glass tools, syringe, micropipette and tip, GC vial, sonicator, and vortex. The materials used are methamphetamine (Cerrilent) as standard, ephedrine hydrochloride (Indonesian Pharmacopoeia) as the raw material, methanol (Merck, Germany), ethyl acetate (Merck, Germany), Hydrochloric Acid (Merck, Germany), water, blood samples (Indonesian Red Cross), mobile phase of 99.99% Helium gas, and DBS paper (Perkin Elmer, USA).
Optimization of GC-MS conditions
Optimization of GC-MS conditions included optimization of flow rate, column temperature and m / z value. Optimization of flow rate, column temperature and m / z value was performed by making a mixture of methamphetamine and ephedrine HCl with a concentration of 1000 ng / mL for methamphetamine and 10 ppm for 1 μL of ephedrine HCl to the GC-MS system with a temperature variation of column 270 ° C, 280 ° C, and 290 ° C (initial temperature 100 ° C with a temperature increase of 20 ° C / minute); flow rate variations of 0.8 mL / minute, 1.0 mL / minute, and 1.2 mL / minute; and variation of m / z value with two variations of m / z value (58.00 m / z and 91.00 m / z for methamphetamine and ephedrine HCl) and three variations of m / z values (58.00 m / z and 91, 00 m / z for methamphetamine and 58.00 m / z, and 77.00 m / z for ephedrine HCl). Then the system suitability test was performed using the optimum method of each GC-MS parameter that had been carried out. If the CV value is < 2.0% with respect to the peak area obtained, then the requirement is met.
Optimization of Sample Preparation
The sample preparation optimization was then carried out with the parameters using blood volume, hematocrit type and sonication time. The variations in blood volume used were 10, 20, 30 and 40 μL; hematocrit variations were33, 36, 38, 40, 43, and 47%; and variation of sonication time were 5, 10, 15 and 20 minutes. The analysis was carried out by spotting blood as much as 40 μL into DBS paper (Whatman BFC 180) which was dried for 3 hours at room temperature (250C). During the analysis, DBS was placed in a tube and added with 700 μL of methanol and 100 μL internal standard 10 μg / mL and sonicated for 15 minutes. Extraction results were transferred to glass tubes and dried under nitrogen flow. The residue was reconstituted with 50 μL of ethyl acetate. Furthermore, the results of the reconstitution were put into insert glass and as much as 1 μL were injected into a gas chromatograph - mass spectrometer (GC-MS) one by one.
Validation of Bio analysis Methods
After obtaining GC-MS conditions and optimization results of DBS preparation were validated in accordance to EMEA bio analytical guideline in 2011. Validation parameters performed were lower limit of quantification measurement (LLOQ), calibration curve, accuracy, precision, selectivity and carry over, matrix effect, and stability of stock solution and DBS samples.
RESULT AND DISCUSSION
The result of bio analytical method validation after the optimization of the developed method met the criteria of EMA Bio analytical Guideline 2011.
Optimization of Analysis Parameters
Optimization of Flow Rate and Column Temperature
Three types of flow rates 0.8; 1.0; 1.2 mL/minute and three types of column temperature of 270; 280 and 290oC with gradient of
20oC/minute were used. The optimum condition was1.0
mL/minute as flow rate and 280oC as column temperature
because it had the highest area and best peak shape. The higher flow rate will make retention time become shorter. If the flow rate is lower, it will be possible to make the separation not going well8
If the flow rate is too high, it will be possible to make column pressure higher which can damage the column. High column temperature will result in a faster retention time but the separation can be less effective because the analyte and the mobile phase are both in the gas phase and separation will occur if the component can interact with the stationary phase8 If the compound does not interact with the stationary phase, the retention time will decrease. This is what happens at high column temperatures. Good separation is usually obtained by setting a temperature gradient, because of differences in polarity and boiling point of solvents and analytes.
Optimization of m/z value on Mass Spectrometry
The optimization of m / z value was conducted for detection of compounds in the mass spectrometer is more specific and does not interfere with interference of other substances in the blood matrix. The type of MS analysis used is the type of Selective Ion Monitoring (SIM) which is usually used to analyze specific compounds, in this case methamphetamine and ephedrine HCl. Analysis of methamphetamine and ephedrine HCl as internal standard used negative ionization. The ionization parameters being used, among others, were SIM mode and scanning with two ion variations at 58 and 91 m / z for methamphetamine and ephedrine HCl with three ion variations namely scanning at 58 m / z and 91 m / z for methamphetamine, 58 m / z and 77 m / z for ephedrine HCl. The temperature of the ion source used was 2800C, the value of MS Quadruopole was 150°C and the solvent cut time was 2.00 minutes. The peak response showed that the breakdown of ion fragmentation at scanning is 58 m / z; 91 m / z and 77 m / z showed the optimum response in terms of the shape of the chromatogram and a larger area.
System suitability Test
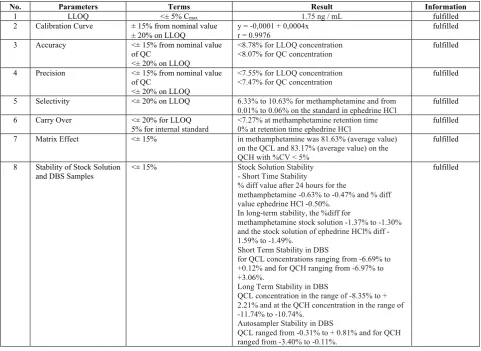
Table 1: Results of Bio analytical Method Validation
No. Parameters Terms Result Information
1 LLOQ <± 5% Cmax 1.75 ng / mL fulfilled
2 Calibration Curve ± 15% from nominal value ± 20% on LLOQ
y = -0,0001 + 0,0004x r = 0.9976
fulfilled
3 Accuracy <± 15% from nominal value of QC
<± 20% on LLOQ
<8.78% for LLOQ concentration
<8.07% for QC concentration fulfilled
4 Precision <± 15% from nominal value of QC
<± 20% on LLOQ
<7.55% for LLOQ concentration
<7.47% for QC concentration fulfilled
5 Selectivity <± 20% on LLOQ 6.33% to 10.63% for methamphetamine and from 0.01% to 0.06% on the standard in ephedrine HCl
fulfilled
6 Carry Over <± 20% for LLOQ 5% for internal standard
<7.27% at methamphetamine retention time 0% at retention time ephedrine HCl
fulfilled
7 Matrix Effect <± 15% in methamphetamine was 81.63% (average value) on the QCL and 83.17% (average value) on the QCH with %CV < 5%
fulfilled
8 Stability of Stock Solution
and DBS Samples <± 15% Stock Solution Stability - Short Time Stability % diff value after 24 hours for the
methamphetamine -0.63% to -0.47% and % diff value ephedrine HCl -0.50%.
In long-term stability, the %diff for
methamphetamine stock solution -1.37% to -1.30% and the stock solution of ephedrine HCl% diff - 1.59% to -1.49%.
Short Term Stability in DBS
for QCL concentrations ranging from -6.69% to +0.12% and for QCH ranging from -6.97% to +3.06%.
Long Term Stability in DBS
QCL concentration in the range of -8.35% to + 2.21% and at the QCH concentration in the range of -11.74% to -10.74%.
Autosampler Stability in DBS
QCL ranged from -0.31% to + 0.81% and for QCH ranged from -3.40% to -0.11%.
fulfilled
Table 2: System Suitability Test Using GC-MS
Data Retention Time (minute) Area (µV/s)
Meth IS Meth IS PAR
1 6.006 7.924 248143.78 596209.40 0.416202
2 6.006 7.924 247037.65 595112.42 0.415111
3 6.006 7.924 249350.00 591348.19 0.421664
4 6.005 7.924 244817.74 590470.86 0.414614
5 6.006 7.924 246368.42 590185.15 0.417442
Mean 6.0058 7.9240 247143.52 592665.20 0.417007
SD 0.00 0.00 1724.12 2796.11 0.00
CV (%) 0.01 0.00 0.70 0.47 0.68
Table 3: Calibration Curve Data
Cons. (ng/mL)
0 1.75 3.50 7.00 14.00 21.00 28.00 35.00 r Slope (b)
Intercept (a) Nu. Measured Area (µV/s)
1 0.00 291.90 581.83 1123.19 2398.77 3539.04 5309.65 5908.23 0.9969 0.0003 -0.0001
2 0.00 312.76 588.90 1121.89 2387.60 3512.77 4803.42 5912.99 0.9972 0.0003 -0.0002
3 0.00 300.88 592.90 1087.44 2308.65 3367.21 4275.49 5744.07 0.9986 0.0003 -0.0001
Mean 0.00 301.85 587.88 1110.84 2365.01 3473.01 4796.19 5855.10 0.9976 0.0003 -0.0001
SD 0.00 10.6 5.61 20.28 49.12 92.56 517.12 96.18
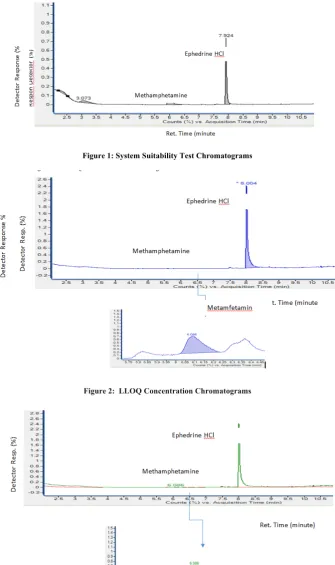
Figure 1: System Suitability Test Chromatograms
Figure 2: LLOQ Concentration Chromatograms
Optimization of Spot Volume and Hematocrit Type (%)
The spotting volume in the analysis using DBS will have an impact on the number of analytes obtained. The greater volume means the spread of blood does not cross the limit of the filling circle9. Optimization of spotting volume was done by first preparing the sample. Preparation was carried out by adding methamphetamine with a concentration of 1000 ng / mL as much as 40 μL into the blood with a 43% hematocrit of 360 μL so that the concentration of analyte was 100 ng / mL. Then the blood containing analytes in the Perkin Elmer DBS paper was analyzed using four variations in the amount of the filling volume of 10, 20, 30 and 40 μL. From the analysis results, it is known that the most optimum spotting volume is 40 μL because it provided results with good peak shape and larger area. In the other hand, hematocrit type was performed because of some factors affecting micro extraction for example the distribution of blood on the DBS paper, blood viscosity and recovery of analytes10. Based on the related research, lower hematocrit will result higher recovery than the higher hematocrit. The variation of hematocrit used were 33, 36, 38, 40, 43 and 47% and the best analyte response was found at 43% hematocrit value because it had better peak shape and had greater area than the other hematocrit value.
Optimization of Sonication Duration
Sonication duration was performed to obtain optimal extraction results. Basically, the sonication duration affected the obtained analytes. The longer the sonication duration was the greater possibility of decomposing and breaking of analytes. This resulted in an unfavorable response to the chromatogram11. Based on previous research, the sonication time was 15 minutes. Therefore, in this research the sonification time was optimized at four time variations of 5, 10, 15 and 20 minutes. Sonication duration which gave the best chromatogram response was at 15 minutes sonication time. At 5 and 10 minutes, the shape of peak analyte was good but the peak of ephedrine HCl was not good. Whereas the area indicated by the 20 minutes sonication time was too small so in this case, 15-minute sonication duration was used.
Validation of Bio analytical Methods
Validation results were conducted in term of LLOQ measurements, linearity calibration curve, selectivity, accuracy, precision, carry over, matrix effect, and stability. All parameters met the requirements based on EMEA bio analytical guideline in 201112
LLOQ (Lower Limit of Quantification)
Based on the theory, smaller LLOQ value will give more sensitivity. The method was able to measure the concentration of analytes in the matrix. The LLOQ value requirement, according to bio analysis, must include a minimum of 1/20 of maximum concentration (Cmax). Based on previous research, the Cmax of methamphetamine in plasma after 4 hours of use was 35 ng / mL so the LLOQ value was determined at 1.75 ng / mL based on the calculation. The first step that needed to be done in measuring the LLOQ value was by creating a range of calibration curves. The range of calibration curves was 1.75 ng / mL to 35 ng / mL, so the value of 1.75 ng / mL became the limit of the temporary LLOQ value. The concentration was made in a blood matrix and five replicas were carried out. LLOQ value fulfilled the requirement if the % diff and CV values meet the accuracy and precision criteria of < ± 20%. The results showed that 1.75 ng / mL concentration met the criteria with % diff and CV values < ± 20%. Then the determination of the LLOQ value was still continued to a half dilution of 1.75 ng / mL which is 0.875 ng / mL and the
value was made as many as five replicas. The results showed that at a concentration of 0.875 ng / mL did not meet the criteria with a value of % diff and CV > ± 20%.
Calibration Curve
Analysis of the calibration curve in DBS was performed by making a sample with a range of 1.75 ng / mL to 35 ng / mL. The calibration curves consisted of blank samples (blood matrix without analytes and internal standards), zero samples (blood matrix with the addition of internal standards) and non-zero samples (blood matrix with the addition of analytes and internal standards). In the non-zero sample 7 concentrations were made, namely 1.75; 3.50; 7.00; 14.00; 21.00; 28.00; and 35.00 ng / mL. The calibration curve meets the requirements if the parameters of linearity (r > 0.9800) and accuracy (% diff) should not be more than > ± 15%, except for LLOQ concentration, which should not be more than 20%. The calibration curve was linear with linear regression equation; y = -0.0001 + 0.0004x with r = 0.9987; where x is the concentration of methamphetamine (ng / mL) and y is PAR (Peak Area Ratio) between methamphetamine and ephedrine HCl. Based on these data, value of not more than ± 15% for all concentrations including LLOQ with an average correlation coefficient (r) of 0.9976 was obtained.
Accuracy, Precision and Recovery
Accuracy and precision were carried out in within-run and between-run. The accuracy and precision parameters were carried out using 4 levels of concentration, namely Lower Limit of Quantification (LLOQ) concentration, Quality Control - Low (QCL), Quality Control - Medium (QCM) and Quality Control - High (QCH) concentration for each within-run analysis. This test was carried out in three runs at least in two days. In the measurement of within run accuracy was obtained at LLOQ concentration % diff values of < 8.78% and < 8.07% for QC concentration. Then for within run precision measurement obtained CV < 7.55% for LLOQ concentration and CV < 7.47% for QC concentration. In the between run measurement accuracy for LLOQ concentration was obtained with CV value of < 1.83%, while at QC the CV concentration was < 2.01%. The % diff and CV values met the requirements of accuracy and precision of both within run and between run.
Relative recovery was obtained by comparing the concentration of analytes measured by actual concentration. While absolute recovery was obtained by comparing the area of the analyte that was not extracted and the area of the analyte extracted at the same concentration. Meanwhile the values obtained in the relative recovery, in all concentration ranges, was ranged from 93.77% to 108.07%, while for the absolute recovery in all concentrations was ranged from 71, 80% to 87.14%. Based on EMEA in 2012, the recovery value was not included in the bio analysis method validation parameter so the value did not have to reach 100% but must fulfill precision, reproducible and consistent requirements.
Selectivity
In the selectivity test, six different blood sources were used by observing the % interference on the blood blank matrix at LLOQ concentration. The results obtained were ranged from 6.33% to 10.63% for methamphetamine and from 0.01% to 0.06% on the standard in ephedrine HCl. Based on the requirements, this method was selective because the results were < ± 20%.
Carry Over
injections each and then were analyzed sequentially. The measurement of carry over value is based on the observation of peak / area at the analyte retention time and the standard in the area was compared to the LLOQ value. Based on the obtained results the requirement was met because the peak area in blood blanks at methamphetamine retention time was < 7.27%, which was below < 20%; whereas for the percentage of peak area in blood form at retention time of ephedrine HCl was 0% with an average of 0%, which met the requirement of below 5%.
Matrix Effect
One important parameter according to EMEA that must be done for the analytical method using mass spectrometry detection is the matrix effect test. The matrix factor in methamphetamine was 81.63% (average value) on the QCL and 83.17% (average value) on the QCH. The CV value of the analyte met the requirements stated in EMEA, namely the CV obtained from 6 different blood sources does not exceed 15%.
Stability
Stock Solution Stability
The stock solution used was methamphetamine stock solution at a concentration of 100 ppm and the internal standard of ephedrine HCl at a concentration of 100 ppm which was carried out at a certain time. Analysts can make one stock solution that can be used within a predetermined time span based on the stability test of stock solution. Stability requirements for stock solutions are % diff and CV < ± 2.0%. Tests were carried out for a short period of time for 24 hours at room temperature and long term stored at 40C for 21 days. The results obtained at the % diff value after 24 hours for the stability of the methamphetamine stock were 0.63% to -0.47% and % diff for the stock stability of ephedrine HCl in the short term was -0.50%. The results showed that the methamphetamine stock solution and stable ephedrine HCl were stored at room temperature. In long-term stability, the % diff for methamphetamine stock solution was -1.37% to -1.30% and the stock solution of ephedrine HCl % diff - 1.59% to -1.49% during 21days storage at 40C. Thus methamphetamine stock solution and ephedrine HCl can be used for 21 days.
Short Term Stability in DBS
The short-term stability test was carried out by storing the spot containing the concentration of QCH and QCL at room temperature for 24 hours and then their stability were observed at 0, 6 and 24 hours. The results showed % diff after 24 hours for QCL concentrations ranging from -6.69% to +0.12% and for QCH ranging from -6.97% to + 3.06%. This showed that methamphetamine in Dried Blood Spot was stable to be stored at room temperature for at least 24 hours because it met the requirements of the % diff value.
Long Term Stability in DBS
The long-term stability test was carried out by storing QCL and QCH at room temperature for 21 days and then analyzed on the 0 and 21st days. The results showed the % diff value obtained on day 21 of the QCL concentration in the range of -8.35% to + 2.21% and at the QCH concentration in the range of 11.74% to -10.74%. This showed that methamphetamine in DBS was still stable and can be stored at room temperature for at least 21 days because it met the requirements.
Auto sampler Stability in DBS
Tests were carried out using QCL and QCH concentrations which had been extracted and then injected and analyzed at the 0 and 24th hours. Based on this data the %diff after 24 hours for QCL ranged from -0.31% to + 0.81% and for QCH ranged from -3.40% to -0.11%. Thus, the extracted DBS can be stored in auto sampler for at least 24 hours before automatically injected because it met the % diff requirements of < ± 15%.
Limit of Detection (LOD)
In the LOD measurements by using calibration curve statistics, it was found that LOD was 0.5 ng/mL.
Comparison to Previous Study
Based on the obtained results, and comparison with previous studies, this study has several advantages including the LLOQ value obtained which was much smaller compared to LLOQ in the related research that was 1.75 ng/ml. In the previous study the LLOQ value of saliva was obtained at a value of 15 ng/ml. This proves that analysis of DBS using GC-MS has better sensitivity than saliva on the side of LLOQ and sensitivity.
CONCLUSION
The results of the validation of the methamphetamine analysis method in Dried Blood Spot fulfilled the validation requirements based on EMEA bio analytical guideline in 2011. The method obtained was linear in the concentration range 1.75 - 35.0 ng / mL with r > 0.9800 with a LLOQ value of 1.75 ng / mL. This method can be applied in amphetamine drug abuse.
ACKNOWLEDGEMENT
This study was supported by Indonesian National Narcotic Agency.
REFERENCES
1. United Nations Office on Drugs and Crime (UNODC). World Drug Report. Vienna: United Nations; 2017.
2. Ministry of Health Republic of Indonesia. Republic of Indonesia Law No. 35 Year 2009 regarding Narcotics, Jakarta; 2009.
3. Advisory Council on the Misuse of
Drugs. Methylamphetamine Review (report), Advisory Council on the Misuse of Drugs, London; 2005.
4. GmbH N. What is Dried Blood Spot Sampling | CAMAG.
[online] Camag.com.
https://www.camag.com/en/dbs/what_is_dried_blood_spot_ sampling.cfm [Accessed 21 Apr. 2018]; 2017.
5. Schepers R. Methamphetamine and Amphetamine Pharmacokinetics in Oral Fluid and Plasma after Controlled Oral Methamphetamine Administration to Human Volunteers. Clinical Chemistry 2003; 49(1): 121-132. 6. Huestis M and Cone E. Methamphetamine Disposition in
Oral Fluid, Plasma, and Urine. Annals of the New York Academy of Sciences 2007; 1098(1): 104-121.
7. Miller J. Chromatography. Hoboken, New Jersey: John Wiley; 2009. p. 309-329
8. Chem.ucla.edu. Gas Chromatography Theory. [online]: http://www.chem.ucla.edu/~bacher/General/30BL/gc/theory [Accessed 8 Jun. 2018]; 2018.
10.European Medicines Agency. EMEA, Guideline on Bio analytical Method Validation, Science Medicines Health. London: An Agency of the European Union; 2011.
11.Semnani A, Haddadi H, Rezaee M and Khalilian F. Application of ultrasound-assisted emulsification micro extraction followed by gas chromatography for determination of oxadiazon in water and soil samples. South African Journal of Chemistry 2015; 68.
12.European Medicines Agency. Guideline on bioanalytical method validation. United Kingdom: Committee for Medicinal Product for Human Use; 2011.
Cite this article as:
Yahdiana Harahap et al. Development and Validation of Methamphetamine analysis methods in dried blood spot sample using gas chromatography – Mass Spectrometry. Int. Res. J. Pharm. 2019;10(8):18-24
http://dx.doi.org/10.7897/2230-8407.1008240
Source of support: Indonesian National Narcotic Agency, Conflict of interest: None Declared