Identification of qPCR reference genes
suitable for normalizing gene expression in
the mdx mouse model of Duchenne muscular
dystrophy
John C. W. HildyardID*, Amber M. Finch, Dominic J. Wells
Department of Comparative Biomedical Sciences, Royal Veterinary College, London, United Kingdom
Abstract
The mdx mouse is the most widely-used animal model of the human disease Duchenne muscular dystrophy, and quantitative PCR analysis of gene expression in the muscles of this animal plays a key role in the study of pathogenesis and disease progression and in evaluation of potential therapeutic interventions. Normalization to appropriate stably-expressed reference genes is essential for accurate quantitative measurement, but determi-nation of such genes is challenging: healthy and dystrophic muscles present very different transcriptional environments, further altering with disease progression and muscle use, rais-ing the possibility that no srais-ingle gene or combination of genes may be stable under all exper-imental comparative scenarios. Despite the pedigree of this animal model, this problem remains unaddressed. The aim of this work was therefore to comprehensively assess refer-ence gene suitability in the muscles of healthy and dystrophic mice, identifying referrefer-ence genes appropriate for specific experimental comparisons, and determining whether an essentially universally-applicable set of genes exists. Using a large sample collection com-prising multiple muscles (including the tibialis anterior, diaphragm and heart muscles) taken from healthy and mdx mice at three disease-relevant ages, and a panel of sixteen candidate reference genes (FBXO38, FBXW2, MON2, ZFP91, HTATSF1, GAPDH, ACTB, 18S,
CDC40, SDHA, RPL13a, CSNK2A2, AP3D1, PAK1IP1, B2M and HPRT1), we used the
geNorm, BestKeeper and Normfinder algorithms to identify genes that were stable under multiple possible comparative scenarios. We reveal that no single gene is stable under all conditions, but a normalization factor derived from multiple genes (RPL13a, CSNK2A2,
AP3D1 and the widely-used ACTB) appears suitable for normalizing gene expression in
both healthy and dystrophic mouse muscle regardless of muscle type or animal age. We fur-ther show that ofur-ther popular reference genes, including GAPDH, are markedly disease- or muscle-type correlated. This study demonstrates the importance of empirical reference gene identification, and should serve as a valuable resource for investigators wishing to study gene expression in mdx mice.
a1111111111 a1111111111 a1111111111 a1111111111 a1111111111
OPEN ACCESS
Citation: Hildyard JCW, Finch AM, Wells DJ (2019)
Identification of qPCR reference genes suitable for normalizing gene expression in the mdx mouse model of Duchenne muscular dystrophy. PLoS ONE 14(1): e0211384.https://doi.org/10.1371/ journal.pone.0211384
Editor: Atsushi Asakura, University of Minnesota
Medical Center, UNITED STATES
Received: September 19, 2018
Accepted: January 11, 2019
Published: January 30, 2019
Copyright:©2019 Hildyard et al. This is an open access article distributed under the terms of the Creative Commons Attribution License, which permits unrestricted use, distribution, and reproduction in any medium, provided the original author and source are credited.
Data Availability Statement: All raw qPCR data
used for this study can be found at the following figshare address (embargoed until manuscript acceptance)10.6084/m9.figshare.7098353. A private link for editors/reviewers only:https:// figshare.com/s/dafbdecb74ed0c19e366. All other relevant data are within the manuscript and its Supporting Information files.
Funding: The work presented here was funded by
Background
The X-linked muscle-wasting disease Duchenne muscular dystrophy (DMD) affects roughly 1 in 5000 new born boys [1], and is the most common fatal genetic condition diagnosed in child-hood. Caused by absence or insufficiency of the muscle membrane-associated protein dystro-phin, muscle fibres lacking this protein sustain damage under even normal use [2]. Repeated cycles of muscle degeneration and compensatory regeneration, alongside a steady accumula-tion of fibrotic scarring and fatty replacement, lead to muscle atrophy, loss of funcaccumula-tion and ultimately death. While the condition is presently incurable, DMD remains a field of active research: several different approaches aimed at dystrophin restoration are currently under investigation or entering therapeutic trials [3,4]. Such research is aided by animal models, and multiple models of this disease exist, including mouse [5], rat [6,7], rabbit [8], dog [9–11] and pig [12,13]. While mouse models (particularly themdxmouse) are the most frequently stud-ied, each model offers discrete benefits and caveats in terms of disease severity, disease pro-gression, cost and therapeutic tractability [14]. Regardless of species, assessment of the consequences of insufficient dystrophin -and more critically, the extent of therapeutic dystro-phin restoration- utilises multiple investigative avenues, from whole animal and whole muscle physiological studies, to gross histology and immunostaining, to quantitative measures of gene expression at the protein and mRNA level.
Quantitative analysis of mRNA via reverse-transcription and subsequent qPCR (SYBR green, Taqman, and more recently digital droplet) is a powerful approach, allowing determina-tion of the extent and significance of changes in transcripdetermina-tion (or degradadetermina-tion), often needing only minimal starting material. Processing of tissue to RNA and then onward to cDNA involves multiple manipulation steps, however, all of which may vary in efficiency: normaliza-tion of data via internal reference genes (genes known to be stably-expressed under the condi-tions studied) is essential before meaningful conclusions can be drawn. Identification of such reference genes is thus critical, but it is now well-recognised that no single gene is suitable under all circumstances, and many putative reference genes show prominent changes between tissues and -of particular relevance to DMD research- with disease. Different muscles within even the same model organism may necessitate different reference genes, hampering compara-bility of experiments. An ideal panel of reference genes would be appropriate regardless of muscle group studied, animal age, or whether the muscle in question was healthy or dystro-phic, but identifying such a panel presents considerable challenges. Healthy skeletal muscle is essentially static, and consequently exhibits remarkable transcriptional stability. In contrast, the cellular environment present within damaged, regenerating muscle is more diverse, com-prising necrotic/apoptotic myofibres, proliferating myoblasts, fusing myotubes and immature myofibres committing to fibre-type fate choices [15]. Add to this the presence of adipocyte, fibroblast, infiltrating macrophage and lymphocyte components characteristic of dystrophic disease progression and it is clear that the transcriptional milieu of dystrophic muscle is likely to be highly plastic. Furthermore, the relative proportions and transcriptional states of all these diverse elements will vary with disease progression, severity and muscle type: finding even a single gene expressed stably under such mixed conditions seems ambitious, and it would not be unreasonable to surmise no such genes exist.
Assessment of potential reference genes is not a straightforward process: RNA is an inher-ently labile, short-lived molecule, and even within highly-expressed near-ubiquitous mRNAs, transcript levels can alter far more rapidly than the corresponding proteins they encode.
GAPDHmay serve for normalizing protein expression under many conditions, but this gene
may conversely be wholly inappropriate as an RNA standard (even under the same conditions) and worse: may be inappropriate in a manner not immediately obvious to the researcher. Poor
(musculardystrophyuk.org, project grant 17GRO-PG12-0204). The funders had no role in study design, data collection and analysis, decision to publish, or preparation of the manuscript.
Competing interests: The authors have declared
normalization may mask genuine biological effects, or even suggest such effects where none exist. The importance of reference gene selection in qPCR (and the pitfalls of inappropriate choices) is illustrated in the MIQE guidelines [16]: all qPCR data should be normalized to ref-erence genes shown to be appropriate for the conditions studied, and moreover multiple refer-ence genes should be used (two at a bare minimum). Empirical determination of appropriate genes is by necessity rather tortuous: a simple approach to identify appropriate candidate ref-erence genes would be direct comparison with established good candidates, however such an approach presupposes such candidates exist, and indeed raises questions as to the validation of those established candidates. Identifying suitable reference gene candidatesde novothus typi-cally involves generation of a dataset of gene expression values for multiple candidate reference genes, in multiple representative cDNAs covering the expected range of sample variability: this dataset can then be analysed to determine the most stable candidates according to specific comparative metrics. Three commonly-used algorithms are geNorm [17], Bestkeeper [18] and Normfinder [19]: each runs under a Windows/Excel environment (as an executable macro, a write-protected spreadsheet and an Add-In, respectively), rendering them highly accessible to the researcher, and all three can utilise the same essential dataset. Each assesses suitability via subtly different criteria, thus each possesses unique strengths and weaknesses: both geNorm and BestKeeper use pairwise, correlation-based approaches within the dataset, while Normfin-der assesses expression stability of individual candidates (download locations and more detailed summaries are provided inS1 Appendixand previously [20]). Strong performance under any single method is commonly adjudged to be sufficient, but strong performance under all three algorithms constitutes firm support for the suitability of any given reference genes. Indeed, combinations of these approaches have been used to determine appropriate ref-erence genes in multiple tissues, disease states and model organisms ranging across the biolog-ical spectrum (see [21–32] for a small selection of recent examples). We also note that
RefFinder, a software package incorporating all three plus a comparativeΔΔCt method is now available [33], however given the strengths and weaknesses of each method, we prefer to assess outputs individually.
We have previously used the three algorithms described above to identify the genes
CSNK2A2andAP3D1as suitable reference genes throughout the transcriptionally-plastic
pro-cess of myogenic differentiation in both healthy and dystrophic murine myoblast cell cultures [34], suggesting that such diverse transcriptional environments are tractable to some extent. More recently, we made the remarkable finding that the genesHPRT1,SDHAandRPL13aare appropriate for normalizing gene expression in a canine model of DMD (the DeltaE50-MD dog), regardless of animal age, presence/progression of disease, or even muscle type [20]. A similar panel of genes might thus exist for human patients, or as we investigate here, themdx
mouse.
Themdxmouse is the canonical animal model of DMD: first reported in 1984 [5], this mouse model carries a natural mutation in exon 23 of the dystrophin gene (dmd) which results in a premature stop codon and consequent loss of dystrophin expression [35]. While the dis-ease severity in this animal is mild and remarkably well-tolerated (mdxmice live near-normal lifespans, and predominantly display compensatory muscle hypertrophy rather than atrophy and fibrosis) [36], the model still exhibits continual muscle degeneration/regeneration, and has proven to be a valuable resource for scientific research into this devastating human disease.
muscle only [37], or at gastrocnemius muscle during denervation atrophy [38], but systematic analysis of candidate reference genes in healthy and dystrophic mice is lacking. A number of different genes have been used in themdxliterature, includingB2M[39], cyclophilin [40] and
HPRT1[41,42], but the most widely-employed references appear to be eitherGAPDH[43–
47],18S[48–50] orACTB[47,51–53]. In the majority of cases only a single gene is used, with little effort to standardise between studies, and the justification for the reference gene chosen is rarely provided. These shortcomings are perhaps understandable, as identifying and verifying a universally-applicable set of genes is not trivial: assessing the suitability of a given reference gene under multiple criteria necessitates a large and well-structured dataset, one from which statistically-valid criterion-specific subsets can readily be prepared and analysed.
For the study described here, we were able to take advantage of the higher sample numbers mouse models potentially offer, and thus endeavoured to prepare a broad and comprehensive sample set of healthy andmdxmouse muscle tissues. Our final sample set comprised muscle RNA collected from dystrophic mice and healthy strain-matched controls at three different disease-relevant ages: 6 weeks, corresponding to the early stage of disease and characterised by profound focal degeneration; 10 weeks, corresponding to progressing disease, with widespread degeneration and compensatory regeneration; and 24 weeks, corresponding to established dis-ease with a comparatively stable level of degeneration/regeneration and fibrotic accumulation in some muscles (Fig 1). We used multiple mice per age (N = 3 per genotype) and a broad panel of muscles covering multiple functional roles, oxidative capacities and dystrophic pro-gression: the highly-studied tibialis anterior (TA) muscle; the gastrocnemius (GC) and quadri-ceps (Q) hind-limb muscles; the triquadri-ceps muscle (TRI); musculature of the body wall (BW); the diaphragm (one of the few muscles in themdxmouse to show pronounced fibrotic accumula-tion); and finally the heart. This substantial panel of samples (126 unique cDNA preparations, seeS2 Appendixfor a summary) permits empirical assessment of gene stability under a multi-tude of different criteria or subdivisions. Similarly, we used sixteen candidate reference genes
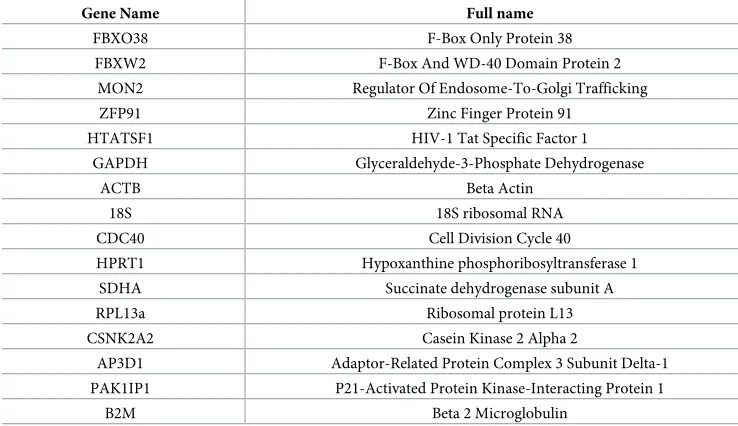
(FBXO38,FBXW2,MON2,ZFP91,HTATSF1,GAPDH,ACTB,18S,CDC40,HPRT1,SDHA,
RPL13a,CSNK2A2,AP3D1,PAK1IP1andB2M–seeTable 1), an extensive panel that included
the three most prevalent ‘housekeeping genes’ in themdxfield (18S,GAPDHandACTB), those that scored highly in our murine cell-culture myogenesis work (CSNK2A2,AP3D1) [34], and those that performed well in our recent dystrophic dog study (HPRT1,SDHA,RPL13a) [20].
We reasoned that use of such a large panel of candidates would maximise potential for iden-tifying reference genes suited for specific comparative scenarios and increase likelihood of identifying a unified set that score highly under all scenarios. As shown below, we were able to determine just such a unified set, while also revealing stark transcriptional differences between model systems of DMD and identifying several widely-used reference genes as being actively muscle- or disease-associated.
Methods
Animals and tissue collection
dislocation. Three healthy and three dystrophic animals were used for each time point. Muscle tissues -TA, GC, Q, TRI, BW, hemidiaphragm- were collected rapidly, flash frozen under liq-uid nitrogen and stored at -80˚C. Hearts, contralateral muscles and the remaining hemidiaph-ragm were mounted in cryoMbed (Bright Instruments Ltd.) on cork blocks and frozen in liquid-nitrogen-cooled isopentane for cryosectioning and histological analysis.
RNA isolation
Frozen tissues were pulverised under liquid nitrogen while cork-mounted hearts were sub-jected to cryosectioning. Interleaving unmounted heart sections (~50 sections at 8um thick-ness) and pulverised muscle tissue (~100mg per sample) were used to prepare RNA via TRIzol reagent (Invitrogen) according to the manufacturer’s instructions (with the addition of a 1:1 chloroform extraction step after phase separation, and inclusion of 10ug glycogen in the isopropanol precipitation). RNA purity was assessed via spectrometry (Nanodrop ND1000), and samples with 260/230 ratios lower than 1.7 were cleaned via a further isopro-panol precipitation. RNA integrity was confirmed for a representative panel of samples via gel electrophoresis.
Fig 1. Disease progression in themdxmouse. Representative Haematoxylin and Eosin stains of tissues used in this study. Top row (A): WTTibialis anterior(TA) muscle; Second row (B):mdxTA muscle; Third row (C): WT diaphragm muscle; Bottom row (D):mdxdiaphragm muscle. Left column: 6 week samples; Centre column: 10 week samples, Right column: 24 week samples. Note the prominent necrosis and oedema characteristic of the 6-week acute phase, the steady accumulation of centrally-nucleated fibres with age and the marked fibrosis and calcium deposition in dystrophic diaphragms. Scale bar: 200um.
cDNA synthesis
cDNA was prepared using the RTnanoscript2 kit (Primerdesign), using 1.6ug total RNA per reaction, with oligodT and random nonamer priming. cDNAs were subsequently diluted 1/20 in nuclease-free H2O to give a final cDNA concentration of ~4ng.ul-1 (assuming 1:1 conver-sion). Samples were stored at -20˚C.
qPCR
Reactions were carried out using PrecisionPLUS SYBR green mastermix (Primerdesign) in duplicate or triplicate, using 2ul diluted cDNA per well (approx. 8ng). Cycling used a CFX384 thermal cycler (BioRad) in three-step PCR (95˚C, 15sec; 60˚C, 20sec; 72˚C, 20sec for 40 cycles) with subsequent melt curves performed for all reactions. Quantification cycle (Cq) values were determined by regression, and (where necessary) converted to relative quantities (RQ). Prim-ers toFBXO38,FBXW2,MON2,ZFP91,HTATSF1,GAPDH,ACTB,18S,CDC40,SDHA,
RPL13a,CSNK2A2,AP3D1,PAK1IP1andB2Mwere taken from the geNorm and
geNorm-PLUS primer sets (Primerdesign) and sequences are thus proprietary. In accordance with the amended MIQE guidelines for proprietary primer sequences [54] we have included anchor nucleotide and context lengths for the amplicons used (seeS2 Appendix). Primers toHPRT1
were the well-validated pan-species set taken from [55], and have the following sequence: HPSF F5’-GGACTAATTATGGACAGGACTG-3’
HPSF R5’-GCTCTTCAGTCTGATAAAATCTAC-3’
All primer sets produced single amplicons and all reactions were of comparable efficiency (95–105%). Additional detail regarding primer validation can be found inS2 Appendix.
Analyses
geNorm, Bestkeeper and ungrouped Normfinder analyses were conducted on our entire data-set, and also on subsets of our data (number of samples indicated in brackets) as follows: • Healthy samples only (N = 63)
Table 1. Candidate reference gene names/full names.
Gene Name Full name
FBXO38 F-Box Only Protein 38
FBXW2 F-Box And WD-40 Domain Protein 2
MON2 Regulator Of Endosome-To-Golgi Trafficking
ZFP91 Zinc Finger Protein 91
HTATSF1 HIV-1 Tat Specific Factor 1
GAPDH Glyceraldehyde-3-Phosphate Dehydrogenase
ACTB Beta Actin
18S 18S ribosomal RNA
CDC40 Cell Division Cycle 40
HPRT1 Hypoxanthine phosphoribosyltransferase 1
SDHA Succinate dehydrogenase subunit A
RPL13a Ribosomal protein L13
CSNK2A2 Casein Kinase 2 Alpha 2
AP3D1 Adaptor-Related Protein Complex 3 Subunit Delta-1
PAK1IP1 P21-Activated Protein Kinase-Interacting Protein 1
B2M Beta 2 Microglobulin
• Dystrophic samples only (N = 63) • 6 week samples only (N = 42)
� 6 week healthy only (N = 21)
� 6 week dystrophic only (N = 21) • 10 week samples only (N = 42)
� 10 week healthy only (N = 21)
� 10 week dystrophic only (N = 21) • 24 week samples only (N = 42)
� 24 week healthy only (N = 21)
� 24 week dystrophic only (N = 21)
Given the research interest in specific muscle groups, and the distinct metabolic and dis-ease-specific responses of particular muscles to dystrophic progression, we also used several more focussed subsets. These subsets reduced our dataset to the level of individual muscles of particular research value (diaphragm, heart, TA), or excluded muscles with unique properties (i.e. a dataset containing non-respiratory skeletal muscles: all muscles except the fibrosis-prone slow, oxidative diaphragm and the non-skeletal heart muscle). We did not further divide these subsets by healthy/dystrophic, as such an approach would in most cases provide datasets of only nine samples, greatly increasing susceptibility to noise. The datasets were thus as follows:
• Non-respiratory skeletal muscle only (TA/GC/Q/Tri/BW: N = 90) • Diaphragm only (N = 18)
• Heart only (N = 18) • TA only (N = 18)
For grouped Normfinder analysis, grouping criteria were applied to the whole dataset (or, where applicable to allow at least two members per group, to subsets as described above). Grouping criteria used were as follows:
• Individual animal (18 groups) • Healthy/dystrophic (2 groups) • Muscle type (7 groups) • Age (3 groups)
Bestkeeper analysis used raw Cq values, while both geNorm and Normfinder used linear-ised relative quantity (RQ) values.
Statistics
Results
Cq distributions
Cq values for our panel of candidate genes (S1A Fig) covered a broad range of expression lev-els, from the very highly expressed (18S,GAPDH) to the more modestly expressed (FBXW2,
CSNK2A2). Expression levels were also highly comparable with those reported for these genes
in the Human BodyMap 2.0 data [56] (S1B Fig). Unexpectedly however, three of our candidate genes (FBXO38,MON2,ZFP91) showed very high variation in expression, and moreover failed to provide quantitative amplicons in several of our samples, with near limit-of-detection levels in others (in both cases, invariably those taken from 24 week old dystrophic mice). While of academic interest (and clearly a finding that highlights the stark differences between healthy and dystrophic muscle), missing data combined with innately high variability immediately rendered these genes unsuitable for use in our study. These genes were thus omitted from sub-sequent analysis. Distribution of within-gene Cq values for our remaining thirteen candidates were lowest inAP3D1andCSNK2A2, and highest inFBXW2(S1 Table).
geNorm analysis
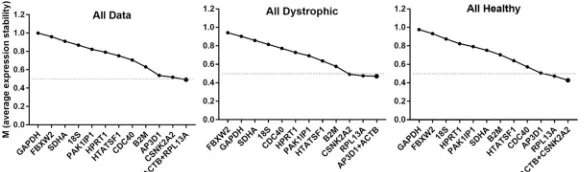
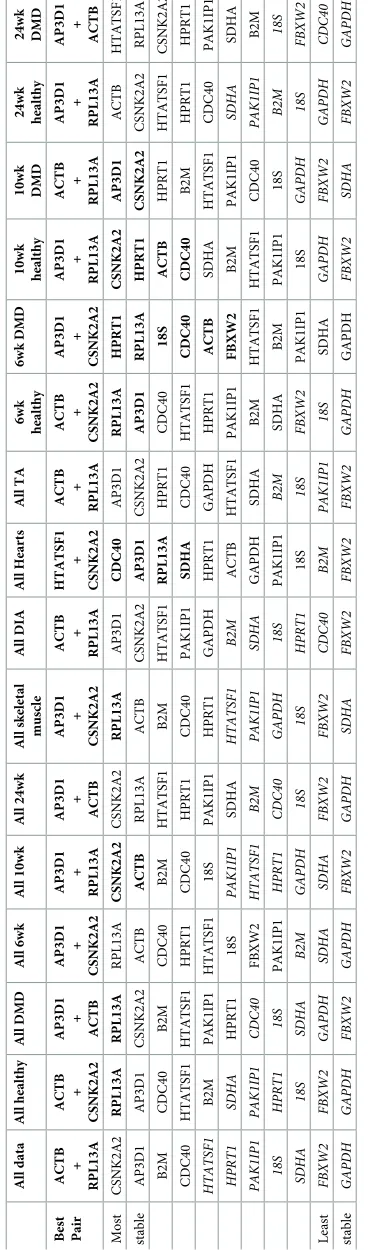
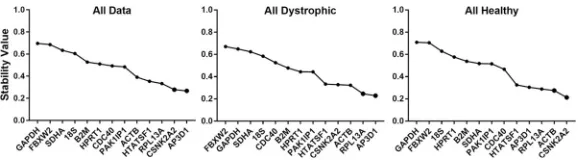
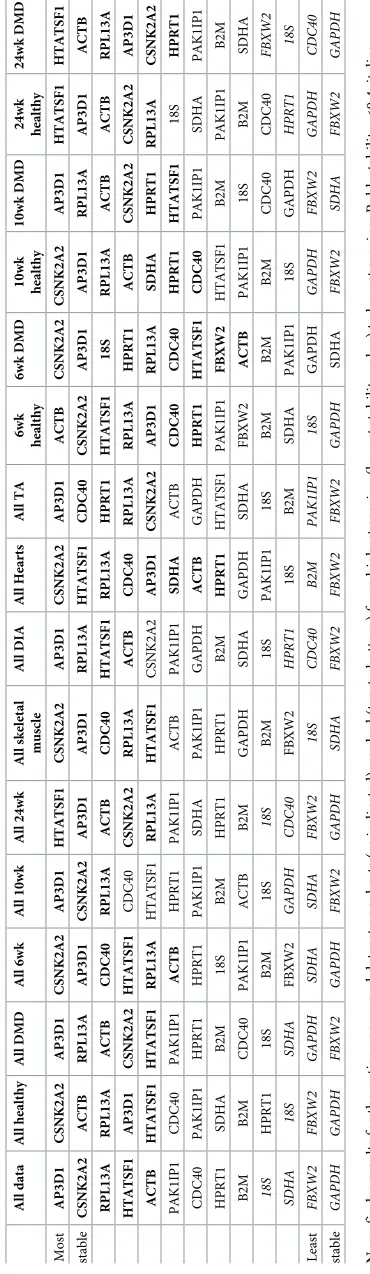
The pairwise approach of the geNorm algorithm [17] calculates a stability factor M for each gene (seeS1 Appendix), a measure of the extent to which expression of that gene correlates with other genes in the dataset. Iterative removal of the gene exhibiting the least correlation (highest M), followed by recalculation of M values allows the dataset to be reduced until only a single pair of highly-correlated genes remain: the ‘best pair’. The M value of this final pair, and the values of each discarded gene allow candidate genes to be ranked from least to most stable (lowest M). By convention, candidates with M values<0.5 are generally consid-ered to be appropriate reference genes, though for samples expected to exhibit high tran-scriptional variability (such as comparison of multiple cell types, or samples derived from tumours) values<1.0 are adjudged acceptable [57]. Analysis of our dataset as a whole, or assessed as healthy or dystrophic samples alone (Fig 2,Table 2), revealed thatACTB,
CSNK2A2,RPL13aandAP3D1consistently ranked highly (indeed,ACTBrepresented one
member of the best pair in all cases). Stability as a whole was however modest, as might be expected for such varied samples: for the analysis of our entire dataset, only the pairing of
ACTBandRPL13afell below the 0.5 threshold (though healthy/dystrophic only datasets
showed marginally higher stability, with several genes achieving this benchmark). When analysed by sub-category (Table 2andS2 Fig) a similar pattern was observed, withACTB,
CSNK2A2,RPL13aandAP3D1near-universally appearing within the top five highest
scor-ing candidates, suggestscor-ing these genes are suitable both for broad panels of muscles and for individual muscle groups (such as diaphragm).
Fig 2. geNorm analysis. Representative outputs of the geNorm algorithm. geNorm ranking by average expression stability M (left to right: least stable to most stable) for the entire dataset, or dystrophic or healthy samples alone (as indicated). Dashed line: M = 0.5 (threshold of stability for strong candidates).
Interestingly, assessment of heart samples alone revealed thatHTATSF1appears uniquely stable in this tissue, here forming one half of the best pair despite scoring comparatively poorly under all other conditions. Conversely,ACTBfared less well in this specific tissue. Heart sam-ples also exhibited higher stability as a whole, possibly reflecting the relatively mild cardiac phenotype inmdxmice of the ages studied. In marked contrast, overall sub-category stability values for skeletal muscle clearly illustrate the transcriptional differences between dystrophic and healthy tissue: when categorised by age alone (thus comparing age-matched healthy and dystrophic tissue) even the best scoring candidates exhibited M values close to 0.5, but further sub-division into separate healthy/diseased categories enhanced stability values considerably.
Analysis also reveals thatFBXW2,SDHA,GAPDHand18Sare exceptionally poor candi-dates, with M values>0.75 under essentially all dataset combinations.
geNorm analysis additionally indicates the change in pairwise variation elicited by increas-ing the number of reference genes beyond the best pair (S2 Table): while increasing from two to three (or four) lowered variation, the threshold for acceptable variation is<0.2, and the best pair was sufficient in all cases.
Bestkeeper analysis
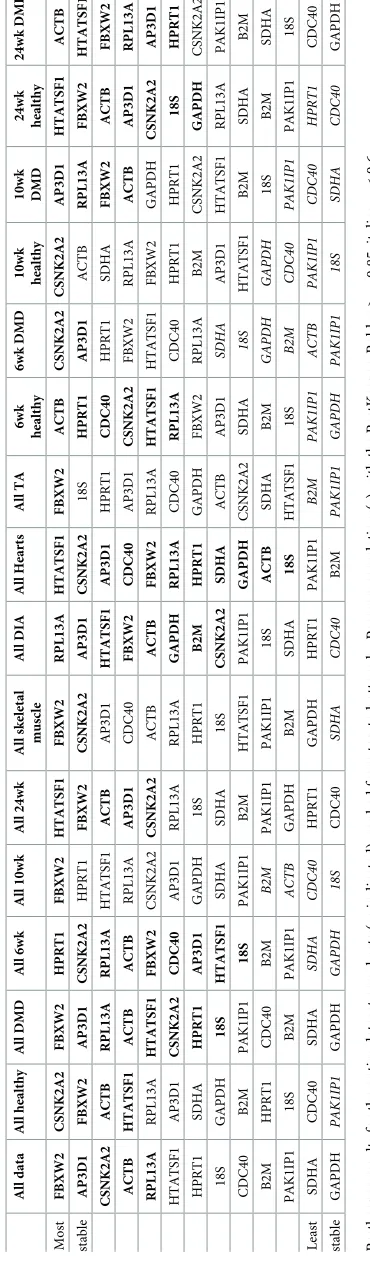
This algorithm substitutes the iterative pairwise method of geNorm with a pairwise compari-son of each gene individually against the geometric average ofallgenes, essentially determin-ing which gene best reflects the behaviour of the dataset as a whole [18]. Genes can thus be ranked by their Pearson correlation coefficient (r), where r = 1 represents perfect correlation. As shown (Fig 3,Table 3andS3 Fig), and in agreement with geNorm analysis,ACTB,
CSNK2A2,RPL13aandAP3D1consistently score highly, whileSDHA,GAPDHand18S
tended to show lower correlation values. Similarly,HTATSF1was revealed to be particularly suited to normalization of heart expression data. In marked contrast to geNorm, however,
FBXW2(the gene exhibiting the most variable expression in our dataset, and one of lowest
scoring under geNorm analysis) here unexpectedly represented one of the highest scoring can-didates, often with r>0.9.
Normfinder
Unlike the pairwise approaches of other two algorithms, the Normfinder algorithm assesses absolute expression stability, either within the dataset as a whole, or within and between sub-groups specified by the user [19]. Each gene is thus effectively evaluated individually, rather than by comparison with other candidates: Normfinder can identify single highly-stable gene candidates that geNorm and Bestkeeper may not. As shown (Fig 4,Table 4andS4 Fig) even under this alternative assessment methodology,CSNK2A2,RPL13aandAP3D1again were consistently ranked highly, withACTBalso rated as highly stable under most dataset combina-tions.HTATSF1again scored highly in heart samples alone, though here this gene was also ranked comparatively highly overall (especially in 24 week-old samples).
In agreement with both other algorithms,SDHA,18SandGAPDHwere assigned poor sta-bility values, and in support of geNorm (but in dramatic contrast with BestKeeper),FBXW2
comparisons asCSNK2A2andAP3D1. As with ungrouped analysis,FBXW2,SDHA,GAPDH
and18Swere rated as low stability candidates near-universally, withSDHAandGAPDHbeing particularly sensitive to grouping by muscle type.
Grouped analysis further suggests a ‘best pair’: two genes that may be of low individual sta-bility, but in opposing senses, such that when combined they outperform any single candidate within the dataset analysed. Of the 41 dataset groupings analysed (Table 5andS6 Table),
AP3D1formed one part of the best pair in 30 cases, whileCSNK2A2appeared 17 times.
Inter-estingly,ACTBandRPL13awere rarely nominated (2 and 3 times respectively) while
HTATSF1earned 21 nominations.
Taking all three algorithm outputs together, our data suggests thatCSNK2A2,AP3D1,
RPL13aandACTBare suitable for normalizing gene expression in healthy and dystrophic
mice regardless of animal age or muscle studied.RPL13aandACTBmay be less optimal for specific healthy/dystrophic comparisons if used individually, however as shown by geNorm these genes remain very strong if used as part of a set.
Validation of gene candidates
To assess the validity of the four high-scoring gene candidates (CSNK2A2,AP3D1,RPL13a
andACTB), we employed a within-dataset strategy we have used previously: using a normali-zation factor generated from our highest-scoring genes (NF: geometric mean of the four candi-dates above) to normalize low-scoring genes from our panel. In addition, asGAPDHis often employed as a reference in the literature, this gene (here scoring poorly) was also used to nor-malize other low-scoring genes for comparative purposes. We first addressedSDHA: in canine muscle this gene is a high-scoring and universally-suitable candidate [20]; conversely, our work here suggests this gene is highly unstable in mouse muscle under all algorithms and essentially all dataset comparisons. Normalization ofSDHAexpression via our NF data reveals this gene to not only exhibit a highly muscle-specific transcriptional program, but also to be markedly reduced in dystrophic tissue (with the exception of the mildly-affected heart muscle) (Fig 5A & 5B). In contrast, following normalization withGAPDHalone this muscle-specificity appears grossly simplified, and disease-associated changes are no longer apparent at individual muscle or even entire dataset level (Fig 5A & 5C). The coefficient of variation (CoV, a measure of the spread of data) is also substantially reduced by normalization with our four-gene NF, but increases following normalization withGAPDH.
Our second candidate wasB2M: this gene (beta-2-microglobulin) is actively disease-associ-ated in dogs [20], showing an up-regulation of approximately 2-fold in dystrophic canine mus-cle (likely reflecting elevated numbers of immune cells in damaged tissue). Though this gene has been used in the literature [39], performance of this gene in our mouse panel was medio-cre, and as shown inFig 6A, the raw (non-normalized) data forB2Min our mouse muscle dataset does appear to suggest a highly significant (P = 0.0002) increase inB2Mexpression in
Fig 3. BestKeeper analysis. Representative outputs of the BestKeeper algorithm. Coefficient of correlation values for the reference gene candidates are shown for the entire dataset, or dystrophic or healthy samples alone (as indicated), ranked (left to right) from least stable to most stable.
dystrophic tissue. Crucially, however: after normalization to the geometric mean ofCSNK2A2,
AP3D1,RPL13aandACTBthis difference disappears entirely (P = 0.72). This unexpected
finding appears to be genuine: as shown, the coefficients of variation are markedly reduced by normalization, exactly as would be expected if such normalization is effective. Conversely, nor-malization toGAPDHexaggerates this apparently aberrant difference (P<0.0001), and again also increases CoV values.
Given these findings, it seemed prudent to use our NF to normalizeGAPDHdata: as shown (Fig 6B), rawGAPDHdata shows no overt disease-associated expression pattern, though does display some muscle-group specificity. Following normalization (Fig 6C),GAPDHexhibits marked muscle-specific variation in expression, and is further revealed to be sharply downre-gulated (~2-fold) in all dystrophic skeletal muscle (but not heart).
GAPDHis a widely-used reference gene in themdxmouse, and one could rightly posit that
these disease-associated decreases in expression might instead be an artefact generated by a poorly-chosen normalization factor composed of genes that all show increased expression in diseased tissue. We thus subjected each of our high-scoring genes to normalization with our NF (a slightly unorthodox approach that means each gene is effectively normalized–in part- to itself, but which allows each gene’s individual bias with respect to the NF to be assessed, and moreover allows all four normalized genes to be directly compared). Raw data suggests a dys-trophy-associated increase in all cases (S5A Fig) however following normalization (Fig 7and
S5B Fig) all four genes show marked reduction in CoV, and none of the genes exhibit any sig-nificant muscle specificity. Nevertheless, our data suggests each gene is indeed disease-associ-ated to a biologically mild (~20% change) but statistically highly-valid (P = 0.002 forRPL13a, P<0.0001 otherwise) extent. Crucially, however, the genes differ in the direction of change:
ACTBandRPL13aboth show a ~20% increase in dystrophic tissue, whileCSNK2A2and
AP3D1both show a ~20% decrease in dystrophic tissue. Our data thus suggest that (much as
for selection of the best pair in grouped Normfinder analysis) while no single gene is wholly stable between healthy and dystrophic muscle, a highly stable normalization factor can be gen-erated by geometric averaging of two (or four) genes that exhibit small disease-specific changes in equal but opposite directions.
Discussion
A panel of reference genes suitable for normalizing gene expression in both healthy and dys-trophic tissue (regardless of age or muscle group) would represent a valuable tool in the DMD research tool-kit, ostensibly permitting otherwise quite disparate samples (such as aged dia-phragm and youngtibialis anterior) to be empirically compared and evaluated, both within and between research groups. Dystrophic muscle is however host to a complex mixture of cell types, and moreover a mixture that changes with age, frequency of use and muscle type: it is by no means guaranteed that any set of genes might be appropriate for normalizing expression
Fig 4. Normfinder analysis (ungrouped). Representative outputs of the Normfinder algorithm. Stability values (left to right: least stable to most stable) for the reference gene candidates are shown for the entire dataset or dystrophic or healthy samples alone (as indicated).
between dystrophic muscles, let alone between such muscles and matched healthy tissue. The study presented here attempts to address this question in a rigorous and comprehensive fash-ion, with a dataset using 13 genes and fully 126 samples, allowing assessment of gene suitability in multiple muscles, including the TA, diaphragm and heart, taken frommdxand strain-matched healthy mice at three disease- and research-relevant ages (6 week early disease, 10 week disease progression and 24 week established disease, with all three being commonly employed time-points for therapeutic trials). As shown, our data reveal thatCSNK2A2,
AP3D1,RPL13aandACTBappear to represent a universal mouse panel (albeit not without
caveats). These four genes score highly under geNorm, Normfinder and BestKeeper analysis, both within the dataset as a whole and when assessed as subsets of the data, suggesting a high level of stability. Further investigation clarified this stability: all four genes exhibit no age or muscle-group specific changes, however all four genes do show moderate (but statistically-sig-nificant) disease-associated changes (Fig 7). The changes are small and indeed below the threshold of significance when considered on an individual muscle level: only with the greater statistical power afforded by more systematic analysis do these changes reveal themselves (illustrating a major strength of our large and comprehensive dataset). Such a result might be considered problematic: use of any one of these genes as a reference would introduce a small (~20%) but nevertheless consistent disease-specific bias. The significance of our findings is that this bias can be effectively (and easily) eliminated, as the differences exhibited are almost perfect mirror images of each other: the extent to whichACTBandRPL13aare increased in dystrophic tissue is near-exactly matched by the extent to whichCSNK2A2andAP3D1are decreased. A normalization factor prepared by geometric average of all four (or indeed one of each sign) should exhibit no net disease-associated behaviour, and would thus be entirely appropriate for normalizing gene expression data taken from both healthy and dystrophic tis-sue, regardless of animal age or muscle type studied.
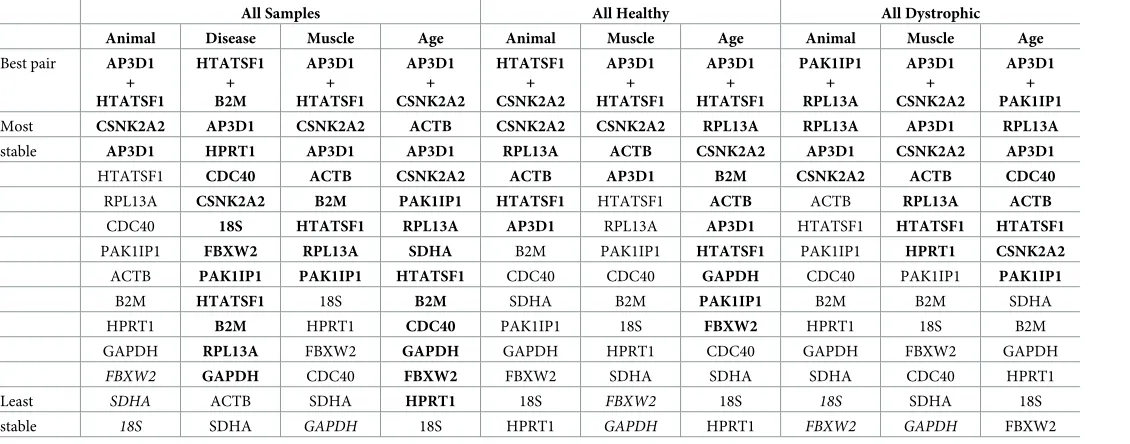
Table 5. Normfinder rankings (grouped).
All Samples All Healthy All Dystrophic
Animal Disease Muscle Age Animal Muscle Age Animal Muscle Age
Best pair AP3D1 + HTATSF1
HTATSF1 + B2M
AP3D1 + HTATSF1
AP3D1 + CSNK2A2
HTATSF1 + CSNK2A2
AP3D1 + HTATSF1
AP3D1 + HTATSF1
PAK1IP1 + RPL13A
AP3D1 + CSNK2A2
AP3D1 + PAK1IP1
Most CSNK2A2 AP3D1 CSNK2A2 ACTB CSNK2A2 CSNK2A2 RPL13A RPL13A AP3D1 RPL13A
stable AP3D1 HPRT1 AP3D1 AP3D1 RPL13A ACTB CSNK2A2 AP3D1 CSNK2A2 AP3D1
HTATSF1 CDC40 ACTB CSNK2A2 ACTB AP3D1 B2M CSNK2A2 ACTB CDC40
RPL13A CSNK2A2 B2M PAK1IP1 HTATSF1 HTATSF1 ACTB ACTB RPL13A ACTB CDC40 18S HTATSF1 RPL13A AP3D1 RPL13A AP3D1 HTATSF1 HTATSF1 HTATSF1
PAK1IP1 FBXW2 RPL13A SDHA B2M PAK1IP1 HTATSF1 PAK1IP1 HPRT1 CSNK2A2
ACTB PAK1IP1 PAK1IP1 HTATSF1 CDC40 CDC40 GAPDH CDC40 PAK1IP1 PAK1IP1
B2M HTATSF1 18S B2M SDHA B2M PAK1IP1 B2M B2M SDHA
HPRT1 B2M HPRT1 CDC40 PAK1IP1 18S FBXW2 HPRT1 18S B2M
GAPDH RPL13A FBXW2 GAPDH GAPDH HPRT1 CDC40 GAPDH FBXW2 GAPDH
FBXW2 GAPDH CDC40 FBXW2 FBXW2 SDHA SDHA SDHA CDC40 HPRT1
Least SDHA ACTB SDHA HPRT1 18S FBXW2 18S 18S SDHA 18S
stable 18S SDHA GAPDH 18S HPRT1 GAPDH HPRT1 FBXW2 GAPDH FBXW2
Normfinder results for the entire dataset or healthy/diseased subsets grouped by different criteria (as indicated: top row; datasets, second row; criterion), ranked from highest scoring (lowest stability value) to lowest scoring (see supplementary data for extended grouped analysis). Grouped analysis also suggests the best pair of genes for normalization (third row), (not necessarily the highest scoring individually). Bold: stability<0.25; italics: stability>0.4
Fig 5. Succinate dehydrogenase subunit A expression. (A) Expression data forSDHAin all healthy and dystrophic samples, either raw relative quantity (RQ) values (left); normalized to the geometric mean ofACTB,RPL13a,
CSNK2A2andAP3D1(centre); or toGAPDH(right). (B) and (C) expression data for SDHA in healthy and dystrophic samples sorted by muscle group (as indicated) normalized to the geometric mean ofACTB,RPL13a,CSNK2A2and
AP3D1(B) or toGAPDH(C). Data shown either as individual sample RQ values (•) and means +/- SEM, or means + SEM alone.�:P<0.05;��:P<0.01,����:P<0.0001 (Mann-Whitney U test (healthy/dystrophic) or one-way ANOVA with Sidak’s multiple comparisons test (healthy/dystrophic by muscle)). Boxes: Coefficient of Variation.
Fig 6. Beta 2 microglobulin and Glyceraldehyde 3-phosphate dehydrogenase expression. (A) Expression data for
B2Min all healthy and dystrophic samples, either raw relative quantity (RQ) values (left); normalized to the geometric mean ofACTB,RPL13a,CSNK2A2andAP3D1(centre); or toGAPDH(right). (B) and (C) Expression data for
GAPDHin all healthy and dystrophic samples (left), or healthy and dystrophic samples sorted by muscle group (as indicated, right), either raw (B) or normalized to the geometric mean ofACTB,RPL13a,CSNK2A2andAP3D1(C). All data shown either as means +/- SEM plus individual sample RQ values (•) or as means + SEM alone.��:P<0.01,���: P<0.001,�� ��:P<0.0001 (Mann-Whitney U test (healthy/dystrophic) or one-way ANOVA with Sidak’s multiple comparisons test (healthy/dystrophic by muscle)). Boxes: Coefficient of Variation.
For studies concerned exclusively with heart tissue, our data further reveal that while these four genes also tend to score highly in this tissue, the geneHTATSF1exhibits marked stability specifically in cardiac samples (outperforming many of the other four genes under all three algorithms). Of the muscles studied here, the heart is certainly the most unique, thus it is not surprising (and indeed, arguably encouraging) that such tissue-specific differences exist.
CSNK2A2andAP3D1both score highly in murine cell culture models of myogenesis
(healthy or dystrophic) [34], remaining stable from proliferating myoblasts all the way to con-tractile myotubes. Given the relatively mild pathology of themdxmouse (with minimal inflammation or fibrosis), the bulk of any given skeletal muscle is likely either mature muscle or muscle at various stages of regeneration: genes that remain stable through this process might well be expected to rank highly. As noted, both genes nevertheless exhibit a mild but consistent reduction in dystrophic muscle (perhaps reflecting the greater percentages of non-muscle cells within these tissues) but encouragingly these genes remain strong candidates regardless of whether 6, 10 or 24 week old samples are considered in isolation: as shown inFig 1, each stage exhibits distinct pathological characteristics that correspond to marked changes in cellular composition. These two genes also score highly in the diaphragm, suggesting that the progressive accumulation of fibrotic scarring does not affect their suitability as references (at least up to 24 weeks of age). The performance of these genes in dogs is unknown, however we note these genes are absent from theCanis familiarisgeNorm primer set (suggesting their stability may be mediocre).
The strong performance ofACTBis a surprise: we have previously shown this gene to be an exceptionally poor candidate in both myogenic cell cultures and healthy/dystrophic dogs [20,
34], and the expectation was that this gene would similarly fare poorly here. It is not immedi-ately clear why this gene should be such a strong candidate in mouse muscle: expression of this cytoskeletal beta isoform falls during myogenesis (presumably as the increase in filamentous alpha-actin and other contractile proteins presses cytoskeletal requirements to the periphery) thus one would expect levels in healthy muscle to be low, while levels in dystrophic muscle -with its diverse cellular composition- to be elevated. As shown, expression of beta actin is indeed elevated in diseased muscle, and consistently so, but to only a comparatively minor extent.
Fig 7. Expression of the four high scoring genes. Expression data forACTB,RPL13a,CSNK2A2andAP3D1(as indicated) in all healthy and dystrophic samples, individually normalized to the geometric mean ofACTB,RPL13a,
CSNK2A2andAP3D1. Data shown as individual sample relative quantity values (•) and means +/- SEM.��:P<0.01,����: P<0.0001 (Mann-Whitney U test). Boxes: Coefficient of Variation.
RPL13a(which codes for a protein component of the large ribosomal subunit) is similarly identified as highly stable, but as withACTB, also shows a small, but significant and consistent increase in expression within dystrophic muscle. A parsimonious interpretation of this increase might be that, courtesy of infiltrating inflammatory cells and proliferating myoblasts, dystrophic tissue simply contains a greater number of cells per unit mass. We note that
RPL13aalso scored highly in our canine panel, and indeed a number of studies have suggested
that genes directly associated with the translational machinery tend to score highly as candi-date reference genes [23,28,31,32] under a variety of conditions, implying that translational components are highly stable. Such findings suggest that translation may not be limiting under most conditions, with even dramatic changes in cellular translational demand being readily accommodated by existing ribosomal content. A puzzling corollary, therefore, is the observation that18Sribosomal RNA performs so poorly under similar comparisons (both in dogs and mice). As the core RNA components of the ribosome, rRNAs must achieve stoichi-ometry with ribosomal proteins, and do so without the advantage of the amplification step inherent to translation (one mRNA ->many proteins): ribosomal RNA is thus incredibly abundant (as shown by low Cq values), and such abundance may explain this discrepancy. rRNAs are estimated to make up ~80% of total RNA, with tRNAs contributing a further 15% [58], thus measured RNA concentrations are primarily a reflection of ribosomal RNA concen-tration: small changes in rRNA fraction of a sample (say, 85% to 82%) would likely fall within the range of tolerable biological noise and thus have little effect on the total translational capac-ity of a cell, or the measured RNA concentration. The concomitant mRNA content of the two samples would however vary by 60% (an increase from 5% to 8% of total RNA), rendering18S
a misleading metric of mRNA content. Use of extremely abundant RNAs as references already carries caveats with respect to efficiency and accuracy of measurement, thus it would seem ribosomal RNAs, despite the advantages in signal robustness their abundance ensures (and their widespread historical use), are poor references for study of gene expression.
In addition to18Sas discussed above, our data also suggest thatGAPDH-another fre-quently-employed reference gene- here performs remarkably poorly, as doesSDHA(which conversely scored very highly in a canine model of DMD): indeed, bothGAPDHandSDHA
display prominent muscle-specific expression patterns, and both also show marked disease-specific changes. The fact thatSDHA(succinate dehydrogenase subunit A) does not exhibit the same universal suitability as shown previously in dogs most likely stems from the inherent differences in skeletal muscle mitochondria between small and large mammals. In the muscle of dogs (and similarly, humans), fast glycolytic 2B fibres are essentially absent: even the fastest fibres present (2X) retain significant oxidative capacity, and the muscles of larger mammals consequently exhibit more metabolic homogeneity. In contrast, while all fibres of the mouse display proportionately higher mitochondrial volumes than larger mammal counterparts, they also exhibit marked metabolic compartmentalization: the fast, glycolytic muscles of mice are very fast, and very glycolytic (and vice versa for the slow, oxidative muscles) [59]. This compartmentalization is clearly reflected in the (normalized) expression of the mitochondrial markerSDHA, even between the comparatively fast skeletal muscles chosen for this study.
Our finding thatGAPDHalso shows muscle-specific expression is not wholly surprising: several multiple-tissue transcriptomics studies have reported markedly higher expression of this gene in skeletal muscle than in heart [56,60,61].GAPDHalso exhibits a two-fold decrease in dystrophic tissue, however: a discovery that has potentially serious implications for studies using this gene as a reference for comparisons between healthy and diseased animals (or indeed treated vs untreated dystrophic tissues).
A final gene that performed exceptionally poorly was the Fbox/WD40 proteinFBXW2, ranked as last or second-last by geNorm and Normfinder under most datasets, with the dra-matic exception of BestKeeper analysis, where it was near-unanimously ranked highest. This was wholly unexpected: rawFBXW2Cq values show only moderate correlation with other candidate genes (S7 Table), and indeed exhibit the greatest sample-to-sample variation within our dataset; even before analysis the expectation was that this gene would fare poorly. One pos-sible explanation for this discrepancy was that such high variability allowed this gene to exert a potent influence over the average generated by the BestKeeper algorithm, artificially enhancing its own correlation with that average. However, after removal ofFBXW2from our dataset, the resultant (FBXW2-deleted) BestKeeper still correlates highly withFBXW2(Pearson correlation of 0.91 drops to 0.89,S6 Fig). We note however that this method ranks only by correlation with the BestKeeper, the average expression of all genes: comparisons between individual genes play no role in the final ranking. There is thus noa priorireason (beyond improbability) that a given gene might correlate only modestly with other individual candidates while still ser-endipitously correlating spectacularly well with the average of those candidates. Regardless of the underlying mechanism, such a finding illustrates the advantages of our approach: use of three different algorithms allows unexpected occurrences exactly like this to be readily identi-fied and rightly dismissed as aberrant. We do not considerFBXW2to be a suitable reference gene here.
Taken as a whole, the above results are encouraging: our dataset is substantial, and we have endeavoured to cover a wide range of potential comparative scenarios so as to truly support our conclusions of universal suitability. We must nevertheless accept certain limitations: only three time-points were chosen, and while these were chosen to maximise utility to themdx
research field, our data is ostensibly only applicable to mice up to 24 weeks of age. In a similar vein, only 3 healthy and 3 dystrophic mice were taken for each time-point, limiting the levels of subdivision we could realistically achieve: while this is unlikely to affect the robustness of our dataset as a whole or under the subsets presented here, comparison (for example) of ‘dys-trophic TA muscles alone’ would be a dataset of 9 samples, while ‘6 week dys‘dys-trophic TA mus-cles alone’ would consist of 3, neither dataset large enough to confer confidence in the conclusions obtained. Five or six mice of each genotype might plausibly permit such analyses, but the numbers (210 or 252 samples respectively) render such studies impractical in terms of resources, time and sample-handling practicality. We also limited our investigations to only seven muscles (the TA, gastrocnemius, quadriceps, triceps, body wall, diaphragm and heart). Inclusion of the very fast EDL and slow, postural soleus muscle would be a welcome addition, but again for reasons of time and practicality (these muscles are also very small, limiting avail-able tissue for RNA extraction) these were omitted. As a final caveat, this work addresses the
mdxmouse (and non-dystrophic C57/Bl10 mice) alone: our final high-scoring candidate genes are well-supported, but we cannot claim these findings necessarily extend to other dys-trophic mice such as themdxCVlines [62,63] or the humanisedmdx Cmah-/-mouse [64].
group. It would however be remiss not to address the pertinent observation that the contrast-ing behaviour of our high scorcontrast-ing genes (CSNK2A2,AP3D1,RPL13aandACTB) andGAPDH
could well be viewed from the opposite perspective.GAPDH(following normalization with our high-scoring candidates) is revealed to show marked muscle and disease-specific changes in expression, thus by extension our high-scoring candidates (following normalization with
GAPDH) would show similar muscle and disease-specific changes in expression, but simply of
the opposite sign. BothACTBandGAPDHhave been widely used as references in themdx
mouse (though almost never together), thus our findings may engender controversy regardless of interpretation. We have previously shownGAPDHto be a poor candidate both in canine muscle and murine cell cultures (healthy and dystrophic), though we note the very same analy-ses revealedACTBto be a similarly poor choice. In themdxmouse as shown here,GAPDH
remains poor whileACTBappears to be a very strong candidate. Given the further observation thatB2Mis strongly associated in a dog model of DMD, and appears similarly disease-associated in mouse ifGAPDHis used as a reference but crucially not if our normalization fac-tor (includingACTB) is used, our conclusions here warrant additional attention. The three algorithms employed here are unbiased, and the scoring obtained is an empirical measure of gene suitability under the constraints stipulated by the method in question, but each method has limitations. geNorm will select unstable but pairwise-matched candidates over highly sta-ble candidates without an appropriate matching partner, while Normfinder will do the reverse; as illustrated byFBXW2here, BestKeeper may even produce aberrant results purely through chance. The fact that our four high-scoring candidates perform well under all three methods, both by pairwise comparisons (geNorm and BestKeeper) and by individual measure of stabil-ity (Normfinder: both within and between a wide range of possible sub-groupings) is however strong support, as is the concomitant observation thatGAPDHnear-uniformly performs poorly under the exact same comparisons. Furthermore, all four of our high-scoring candi-dates show remarkable sample-to-sample RQ agreement (Spearman’s rho values ~0.8), while all four show poor correlation withGAPDH(~0.3–0.4) (S8 Table). Given the diverse biochem-ical roles played by these four genes, a coordinated muscle and disease-associated expression program for all four seems unlikely. ConverselySDHA, another key metabolic gene used in our panel, exhibits muscle and disease-specific expression in a manner similar toGAPDH, while critically not demonstrating overt sample-to-sample correlation with this gene (Spear-man’s rho 0.39). Finally, normalization of data with our four genes resulted in a marked decrease in data spread (lower CoV) in almost all cases, while normalization withGAPDH
achieved the opposite effect. If one makes the assumption that biological replicates for expres-sion of a given gene should be relatively consistent, one would be forced to conclude our nor-malization factor serves better in this respect than doesGAPDH.
Conclusions
extrapolation between species is not straightforward. RPL13a performs well in both mouse and dogs (and thus may similarly excel in humans), but our other candidate genes show clear species-specificity. Humans are genetically closer to mice than dogs, but more similar to dogs with respect to muscle metabolism and disease presentation/severity. A human equivalent of the study presented here would be markedly more ambitious, but our data suggests such an effort might yield success.
A secondary goal of this work was to assess the validity of the three most commonly used reference genes in the literature (GAPDH,18SandACTB), as these three genes have previously been shown to be remarkably poor choices in myogenic cell cultures and dystrophic canine muscle. Unexpectedly, whileGAPDHand18Sremain poor candidates in this study,ACTBis revealed to be a strong choice in mouse, a finding we hope is of considerable reassurance to many investigators in themdxfield. The small dystrophy-associated increase we identify here argues against using this gene alone however, and we would further stress that reliance on any single gene is a risky, error-prone normalization strategy regardless of suitability: in alignment with the MIQE guidelines [16] investigators should always strive to employ two if not three reference genes, especially if attempting to measure subtle changes in expression. We accept that use of all four reference genes suggested here might be considered excessive (though such an approach would be highly rigorous), and our geNorm analysis suggests there is little advan-tage to be gained in increasing the number of reference genes from three to four (S2 Table). All four genes show very closely-matched expression profiles (S7andS8Tables), and while all are high-scoring, no consistent ranking of the four emerges. All four offer advantages with respect to wider comparisons:CSNK2A2andAP3D1also perform well in myogenic cell cul-tures,RPL13aperforms well in dogs, andACTBalready enjoys widespread use inmdxmice. Given the observations regarding disease-specificity however, we do not recommend pairing
CSNK2A2andAP3D1alone, norACTBandRPL13a, and we thus conclude by suggesting
(given the wealth of established literature usingACTBas a reference) the most prudent and economical approach for investigators seeking empirically-identified and validated reference genes would be to selectACTBfirst and foremost, and combine it with eitherAP3D1or
CSNK2A2.
Supporting information
S1 Appendix. Reference gene selection algorithms: Detailed summary.
(DOCX)
S2 Appendix. Sample summary, Primer and qPCR validation.
(DOCX)
S1 Fig. Raw Cq data. (A) Individual Cq values (•) for all 126 samples for each candidate
refer-ence gene (as indicated). Genes for which some samples provided no amplicons are indicated, along with number of missing datapoints. (B) Relative expression levels for each candidate ref-erence gene in human tissues as reported by the Illumina bodymap project (expression data converted to log(1/expression level) to allow scale-matching with raw Cq data). No bodymap data for 18S exists (mRNA only).
(TIF)
S2 Fig. geNorm outputs for all dataset combinations. geNorm ranking by average expression
stability M (left to right: least stable to most stable) for the entire dataset, or specific subsets (as indicated). Dashed line: M = 0.5 (threshold of stability for strong candidates).
S3 Fig. BestKeeper analysis for all dataset combinations. Coefficient of correlation values
for the reference gene candidates are shown for the entire dataset, or specific subsets (as indi-cated), ranked (left to right) from least stable to most stable.
(TIF)
S4 Fig. Normfinder analysis (ungrouped) for all dataset combinations. Stability values (left
to right: least stable to most stable) for the reference gene candidates are shown for the entire dataset or specific subsets (as indicated).
(TIF)
S5 Fig. Muscle and disease-specific expression patterns of high-scoring candidates. (A)
Raw RQ values (•) for ACTB, RPL13a, CSNK2A2 and AP3D1 for the entire dataset, separated by healthy/dystrophic. (B) Normalized expression data (means + SEM) for ACTB, RPL13a, CSNK2A2 and AP3D1 separated by muscle type and healthy (green) vs dystrophic (red).�: P<0.05,��:P<0.01,����:P<0.0001, Mann-Whitney U test (healthy/dystrophic). Boxes: Coeffi-cient of Variation.
(TIF)
S6 Fig. FBXW2 vs BestKeeper. Raw Cq values for FBXW2 plotted against a BestKeeper
derived from the entire dataset (upper panel), or against a BestKeeper derived from the dataset after removal of FBXW2 (lower panel). Boxes: Pearson correlation (r) and significance of cor-relation.
(TIF)
S1 Table. Dataset averages. Arithmetic mean and standard deviations of the Cq values for
each candidate gene: of the genes used, FBXW2 shows the greatest sample-to-sample variation, while AP3D1 and CSNK2A2 show the least. Shaded boxes: genes omitted from analysis. (DOCX)
S2 Table. geNorm pairwise variation. Output of the geNorm algorithm for the entire dataset
(or subcategory as indicated) showing reduction in pairwise variation with additional refer-ence genes (e.g. V2/3: increasing from 2 -the best pair- to three). Values of 0.2 or lower are considered acceptable, thus three or four reference genes reduce variability but two (the best pair) suffice in all instances.
(DOCX)
S3 Table. Age-specific Normfinder rankings (grouped). Normfinder results for age-specific
subsets grouped by different criteria (as indicated: top row; datasets, second row; criterion), ranked from highest scoring (lowest stability value) to lowest scoring. Grouped analysis also suggests the best pair of genes for normalization (third row), (not necessarily the highest scor-ing individually). Bold: stability<0.25; italics: stability>0.4
(DOCX)
S4 Table. Muscle-specific Normfinder rankings (grouped). Normfinder results for
muscle-specific subsets grouped by different criteria (as indicated: top row; datasets, second row; crite-rion), ranked from highest scoring (lowest stability value) to lowest scoring. Grouped analysis also suggests the best pair of genes for normalization (third row), (not necessarily the highest scoring individually). Bold: stability<0.25; italics: stability>0.4
(DOCX)
S5 Table. Age and disease-specific Normfinder rankings (grouped). Normfinder results for
stability value) to lowest scoring. Grouped analysis also suggests the best pair of genes for nor-malization (third row), (not necessarily the highest scoring individually). Bold: stability<0.25; italics: stability>0.4
(DOCX)
S6 Table. Normfinder ‘best pair’ combinations for all dataset/grouping combinations.
(DOCX)
S7 Table. Correlation matrix of Cq values. Pearson correlations (r) for raw Cq values (all
genes). Bold: correlations between high scoring candidates (ACTB, RPL13a, CSNK2A2, AP3D1). Italics: correlations with P values greater than 0.0001 (all other correlations P<0.0001); CDC40 vs GAPDH = 0.0026; 18S vs SDHA = 0.0001
(DOCX)
S8 Table. Correlation matrix of RQ values. Spearman’s Rho values for RQ correlations (all
genes). Bold: correlations between high scoring candidates (ACTB, RPL13a, CSNK2A2, AP3D1). Italics: correlations with P values greater than 0.0001 (all other correlations P<0.0001); CDC40 vs GAPDH = 0.0046; 18S vs SDHA = 0.0002; GAPDH vs B2M = 0.0003. (DOCX)
Acknowledgments
The manuscript was approved by the RVC research office and assigned the following number: CBS_01860
Author Contributions
Conceptualization: John C. W. Hildyard, Dominic J. Wells.
Funding acquisition: John C. W. Hildyard, Dominic J. Wells.
Investigation: John C. W. Hildyard, Amber M. Finch.
Supervision: Dominic J. Wells.
Writing – original draft: John C. W. Hildyard.
Writing – review & editing: John C. W. Hildyard, Amber M. Finch, Dominic J. Wells.
References
1. Mah JK, Korngut L, Dykeman J, Day L, Pringsheim T, Jette N. A systematic review and meta-analysis on the epidemiology of Duchenne and Becker muscular dystrophy. Neuromuscular disorders: NMD. 2014; 24(6):482–91. Epub 2014/05/02.https://doi.org/10.1016/j.nmd.2014.03.008PMID:24780148.
2. Cohn RD, Campbell KP. Molecular basis of muscular dystrophies. Muscle & nerve. 2000; 23(10):1456– 71. Epub 2000/09/26. PMID:11003781.
3. Mendell JR, Rodino-Klapac LR, Sahenk Z, Roush K, Bird L, Lowes LP, et al. Eteplirsen for the treatment of Duchenne muscular dystrophy. Annals of neurology. 2013; 74(5):637–47. Epub 2013/08/03.https:// doi.org/10.1002/ana.23982PMID:23907995.
4. Shin JH, Pan X, Hakim CH, Yang HT, Yue Y, Zhang K, et al. Microdystrophin ameliorates muscular dys-trophy in the canine model of duchenne muscular dysdys-trophy. Molecular therapy: the journal of the Amer-ican Society of Gene Therapy. 2013; 21(4):750–7. Epub 2013/01/16.https://doi.org/10.1038/mt.2012. 283PMID:23319056; PubMed Central PMCID: PMCPMC3616540.
5. Bulfield G, Siller WG, Wight PA, Moore KJ. X chromosome-linked muscular dystrophy (mdx) in the mouse. PNAS. 1984; 81(4)(0027–8424 (Print)):1189–92. PubMed Central PMCID: PMCPMC344791. PMID:6583703
2014/10/14.https://doi.org/10.1371/journal.pone.0110371PMID:25310701; PubMed Central PMCID: PMCPMC4195719.
7. Nakamura K, Fujii W, Tsuboi M, Tanihata J, Teramoto N, Takeuchi S, et al. Generation of muscular dys-trophy model rats with a CRISPR/Cas system. Sci Rep. 2014; 4(2045–2322 (Electronic)):5635. Epub 2014/07/10.https://doi.org/10.1038/srep05635PMID:25005781; PubMed Central PMCID:
PMCPMC4088098.
8. Sui T, Lau YS, Liu D, Liu T, Xu L, Gao Y, et al. A novel rabbit model of Duchenne muscular dystrophy generated by CRISPR/Cas9. Disease models & mechanisms. 2018; 11(6). Epub 2018/06/07.https:// doi.org/10.1242/dmm.032201PMID:29871865; PubMed Central PMCID: PMCPMC6031364.
9. Hildyard J, Rawson F, Harron R, Riddell D, Massey C, Taylor-Brown F, et al. Characterising the skeletal muscle histological phenotype of the DeltaE50-MD dog, a preclinical model of Duchenne muscular dys-trophy. Neuromuscular Disorders. 2018; 28:S18.https://doi.org/10.1016/S0960-8966(18)30342-0 10. Kornegay JN. The golden retriever model of Duchenne muscular dystrophy. Skeletal muscle. 2017; 7
(1):9. Epub 2017/05/21.https://doi.org/10.1186/s13395-017-0124-zPMID:28526070; PubMed Central PMCID: PMCPMC5438519.
11. Walmsley GL, Arechavala-Gomeza V, Fernandez-Fuente M, Burke MM, Nagel N, Holder A, et al. A duchenne muscular dystrophy gene hot spot mutation in dystrophin-deficient cavalier king charles spaniels is amenable to exon 51 skipping. PLoS One. 2010; 5(1):e8647. Epub 2010/01/15.https://doi. org/10.1371/journal.pone.0008647PMID:20072625; PubMed Central PMCID: PMCPmc2800183.
12. Selsby JT, Ross JW, Nonneman D, Hollinger K. Porcine models of muscular dystrophy. ILAR J. 2015; 56(1):116–26. Epub 2015/05/21.https://doi.org/10.1093/ilar/ilv015PMID:25991703; PubMed Central PMCID: PMCPMC4542708.
13. Klymiuk N, Blutke A, Graf A, Krause S, Burkhardt K, Wuensch A, et al. Dystrophin-deficient pigs provide new insights into the hierarchy of physiological derangements of dystrophic muscle. Human molecular genetics. 2013; 22(21):4368–82. Epub 2013/06/21.https://doi.org/10.1093/hmg/ddt287PMID:
23784375.
14. Wells DJ. Tracking progress: an update on animal models for Duchenne muscular dystrophy. Disease models & mechanisms. 2018; 11(6). Epub 2018/06/20.https://doi.org/10.1242/dmm.035774PMID:
29914884; PubMed Central PMCID: PMCPMC6031358.
15. Tanabe Y, Esaki K, Nomura T. Skeletal muscle pathology in X chromosome-linked muscular dystrophy (mdx) mouse. Acta Neuropathologica. 1986; 69(1–2):91–5.https://doi.org/10.1007/bf00687043PMID:
3962599
16. Bustin SA, Benes V, Garson JA, Hellemans J, Huggett J, Kubista M, et al. The MIQE guidelines: mini-mum information for publication of quantitative real-time PCR experiments. Clinical chemistry. 2009; 55 (4):611–22. Epub 2009/02/28.https://doi.org/10.1373/clinchem.2008.112797PMID:19246619.
17. Vandesompele J, De Preter K, Pattyn F, Poppe B, Van Roy N, De Paepe A, et al. Accurate normaliza-tion of real-time quantitative RT-PCR data by geometric averaging of multiple internal control genes. Genome Biology. 2002; 3(7):research0034.1—research.11. https://doi.org/10.1186/gb-2002-3-7-research0034
18. Pfaffl M, Tichopad A, Prgomet C, Neuvians T. Determination of stable housekeeping genes, differen-tially regulated target genes and sample integrity: BestKeeper–Excel-based tool using pair-wise corre-lations. Biotechnology Letters. 2004; 26(6):509–15.https://doi.org/10.1023/b:bile.0000019559.84305. 47PMID:15127793
19. Andersen CL, Jensen JL,Ørntoft TF. Normalization of Real-Time Quantitative Reverse Transcription-PCR Data: A Model-Based Variance Estimation Approach to Identify Genes Suited for Normalization, Applied to Bladder and Colon Cancer Data Sets. Cancer Research. 2004; 64(15):5245–50.https://doi. org/10.1158/0008-5472.CAN-04-0496PMID:15289330
20. Hildyard JCW, Taylor-Brown F, Massey C, Wells DJ, Piercy RJ. Determination of qPCR Reference Genes Suitable for Normalizing Gene Expression in a Canine Model of Duchenne Muscular Dystrophy. J Neuromuscul Dis. 2018; 5(2):177–91. Epub 2018/04/05.https://doi.org/10.3233/JND-170267PMID:
29614692.
21. Chen ZS, Han NN, Li JH, Huang GH, Wan H. Selection of reference genes for expression analysis using RT-qPCR in the dissemination system of Heliothis virescens ascovirus 3 h (HvAV-3h). Sci Rep. 2017; 7(1):7045. Epub 2017/08/03.https://doi.org/10.1038/s41598-017-07684-wPMID:28765578; PubMed Central PMCID: PMCPMC5539149.