1
Assessing the Impact of Climate Variability on Food Security in Kenya: A Case Study of Kisii County
Moranga P. Samwel1*Beatrice A. Abutto2andVincent O. Otieno3
1Department of Environmental Studies, Agric. and Forestry; Maasai Mara University, Kenya. 2Royal Veterinary College, University of London, UK.
3School of Spatial Planning and Natural Resource Management, Jaramogi Oginga Odinga University of Science and
Technology, Kenya.
*Correspondence author: Vincent O. Otieno, School of Spatial Planning and Environment, Jaramogi Oginga Odinga University of Science and Technology, Kenya
Email: [email protected]
Abstract
Climate variability and change has been found to be one of the factors that affect economies leading to food insecurity in various parts of the world. Kenya is no exception. This study looks at how climate variability has contributed to food insecurity in Kisii County, Kenya. The objectives of this study is therefore to, (i) to examine the rainfall and temperature trends in Kisii County for a period of 30 years, (ii) to examine the effect of climate variability on food production and (iii) to assess the perception of local farmers on weather and climate information, (iv) to evaluate the coping strategies adopted at household level to bridge the gap on food deficit and (v) to assess the nutritional status of children and the elderly in Kisii County. The study was conducted in the larger Kisii County. The data used was mainly rainfall and temperature data from meteorological stations and sample data gathered from selected groups. The study population comprised of children between 6 months and 59 months, household heads, elderly people and agricultural officers. Purposive sampling was used to select agricultural officers while multistage sampling was used to select respondents at household level. Primary data was collected by use of a pre-tested questionnaire. The MUAC tape was used to collect nutritional status of children while BMI data was obtained from elderly people. Mann Kendall statistic was used to determine whether the trend of rainfall and temperature observed is significant while Chi-square test was used to determine whether the coping strategies observed varied significantly at household level. From the analysis, rainfall has not shown any significant change in Kisii County while temperature trend has been significantly increasing over the years at 95% confidence level. This could explain the observed reduction in river levels. Analysis of crop production and price trends of major food crops in Kisii County showed a decreasing trend of food production leading to increase in price over the years. This meant that farmers could not produce enough to take them to the next harvesting season making farmers to adopt different coping strategies at household level which differed significantly according to Chi-Square test. Malnutrition status of both elderly people above 59 years and children between 6-59 months were similar with 23% of both children/elderly being severely malnourished/malnourished.
This study has only looked at climatic factors such as rainfall and temperature. Other aspects such as depth of underground water, ph level of soil and the effects of land fragmentation also need to be looked at. This study is important to both farmers in choosing the right crop to plant, and policy makers and planners in formulating the best mitigation and intervention strategies for Kisii County food insecurity problem. This will further contribute to national efforts towards achievement of vision 2030.
Key Words: Climate Variability; Food Security; Climate Change Adaptation; Malnutrition
2 1.0Introduction
The Horn of Africa region has been attracting the attention of many researchers and donors as well
due to the food crisis that led to famine conditions and severe food shortage in most parts of
Somali, Ethiopia and eastern parts of Kenya during 2011 and 2012 boreal summer [16, 17, 19, 29,
30, 42]. While many parts of the world also faced different weather challenges during 2011 and
2012; for instance, July-September Thailand floods in 2011 [41], March-August Texas USA
drought [49], high temperatures over western Europe [7], February 2012 European cold spell [55]
and the record winter drought of 2011–12 in the Iberian Peninsula [53] among others, the Horn of
Africa situation was exuberated mostly by non-climatic factors such as high global food prices,
political instability, chronic poverty, and poor infrastructure among others. Nonetheless, climatic
stresses associated with back-to-back failures in both the boreal winter and the boreal spring of
2007, 2008, 2009, 2011 and 2012 played a critical role [19].
Having recognized that climate variability and change is a major driving factor in most economic
activities in the region, most government such as the Kenyan government [23] integrates climate
information in her policies. Climate change is quite noticeable and it is intensifying at an alarming
rate in terms of temperature increase and rainfall irregularity in Kenya [58]. For instance, Anyah
and Qiu [4] analyzing precipitation and temperature over the Greater Horn of Africa during the
20th and 21st century based on a sample of Coupled Model Intercomparison Project version 3
(CMIP3) models output found that the equatorial eastern Africa region (including the entire
Greater Horn of Africa (GHA)) have been experiencing a significant increase in temperature
beginning in the early 1980s, in both A1B and A2 scenarios. They further showed that minimum
temperatures were projected to increase by more than 2°C above the Long Term Mean (LTM) by
3
that temperatures were projected to increase at a rate of 0.3/0.4 0C/decade under RCP4.5/8.5
scenarios in both equatorial GHA region leading to an approximate temperature increase of 2/2.5
0C by the middle of twenty first century.
Apart from the weather effect, food insecurity and famine can be caused by a number of factors
such as low harvest, post-harvest losses, under nutrition [5, 11], increase in food prices and
population increase. While global population is set to grow to approximately 9 billion people by
2050 from the present 7 billion, which would require increased volume of food production, it is
estimated that by 2080 the agricultural output in developing countries would decrease by 20% due
to climate change [5, 13]. In Africa; for instance, about 250 million people are likely to face food
insecurity due to crop failure, loss of livestock and lack of water as result of climate change by
2020. It is also estimated that by 2040 drought is likely to reduce the area under cultivation of
maize, millet or sorghum by 40-80% in sub-Saharan Africa [12, 60].
In Kenya more than 500,000 farmers of tea have experienced erratic rainfall, greater frost and high
temperatures that have threatened their livelihood [14, 37], forcing most of them to device ways
of coping with the shortages. In Bungoma County; for example, residents have devised many ways
of reducing the impact of food insecurity by reducing the number of meals taken per day, working
for cash or food, borrow money to buy food, sell assets and some resorted to borrowing from
sellers which makes them more poorer [56].
Post-harvest food losses, the measurable quantitative and qualitative food loss in the post-harvest
system [59], have also been a major factor contributing to the net harvest. Controlling post-harvest
food loss is very vital component in ensuring food security. Losses in post-harvest stage can occur
4
Africa post-harvest losses are approximately at 40% of the total harvested cereals [59]. Once crops
have been harvested, the unusual rains can dampen the crop yields and result in mould growth, a
common phenomenon in developing countries due to reliance on weather (sun) for drying farm
produce. If unfavorable weather condition prevents the crops from drying, the post-harvest losses
become high and at times mycotoxin producing moulds such as Aspersillus flavus may produce
aflatoxin which can lead to health related problems if consumed [26]. Nonetheless, in Kenya
post-harvest loss is approximated to be at 50% mainly due to weather impact [59].
A number of studies have been carried out in Kisii County to find out the cause of food insecurity
in the County. For instance, Kumba and Francis [27] analyzed the influence of agricultural land
use on house hold food security situation in Kisii central. From their study, natural grass or napier
grass had a significant influence on house hold food security while crops and fruits were not.
Nyariki et al. [36] looking at the effect of land fragmentation index, quantity of planting fertilizer
and the type of seed used found out that all these factors influence technical efficiency in food
production. Ogechi and Huja [38] also looking at the implication of land use/cover changes on
food production and insecurity in Kisii County found out that the reduction of forest land due to
rising demand for more agricultural land and settlement had impacted negatively on soil fertility
leading to a decline in food production. While these studies have looked at the aspect of land
use/cover change and type of agricultural land use, they dint consider the aspects of climate and
its effects on food insecurity in Kisii county. Characterizing precipitation and temperature and
further assessment of climate variability/change is a fundamental step in providing a baseline for
understanding the effects of climate variables on food insecurity in Kenya, especially in Kisii
County. This will be important for future climate change impact assessment and for the
5
759 -1009 per square kilometer (figure 1) and being one of the bread basket regions in Kenya is
of utmost interest. Hence in this work we look at (i) the trend of precipitation and temperature in
Kisii County for the past 30yrs, (ii) the effect of the changes in temperature and precipitation on
food production in Kisii County, (iii) The perception of farmers on climate and weather
information (iv) coping strategies adopted at different household level in Kisii County and (v)
nutritional status of the elderly above 59 years and children between 6 to 59 months.
Figure 1: Map of Kisii County Showing Constituencies in Kisii County Kenya. The coloring shows the population density per constituency. (Map adopted from softkenya.com)
The paper is outlined as follows. In the next section the different data types used and their
acquisition method and a discussion of the overall methodological approach is provided. Section
3 provides a discussion of the overall results. A summary of the overall findings and the main
6 2.0 Data and Methodology
2.1 Data
Data used in this study were categorized into two; secondary and primary data. Secondary data
which consisted of rainfall and temperature data for the past 30 years (1983-2013) was obtained
from Kenya meteorological stations in Kisii County and agricultural production details were
obtained from sub-county agricultural offices of Marani and Bomachoge chache. Primary data
consisting of Body Mass Index (BMI), nutritional status and trend in river levels were collected
through pretested questionnaires. The study population consisted of household heads, children
between 6-59 months, Adults over 60 years, County and sub-county agricultural officers involved
in food production in Kisii County. The children below 60 months and adults over 60yrs were
chosen since they are more likely to suffer malnutrition [39].
2.1.1 Sample Size and Sampling Technique
Purposive sampling method was used to select agricultural officers at the County and sub County
level. This method allows a researcher to use cases that have the required information [9, 35]. At
household level, multistage cluster sampling was used [34]. This method gives a researcher room
to divide the study area into various levels. In our case, we divided the area into two sub-counties,
two divisions, four locations and eight sub-locations due to the demography of the region (figure
1) and the spatial climatic pattern. The number of household respondents was determined
according to Godden’s [22] formula. For children between 6 months and 59 months, the MUAC
tape (non-stretching measuring tape used to measure the upper arm circumference; [52]) was used
to collect data on nutritional status. The arm circumference is measured in centimeters and the
7
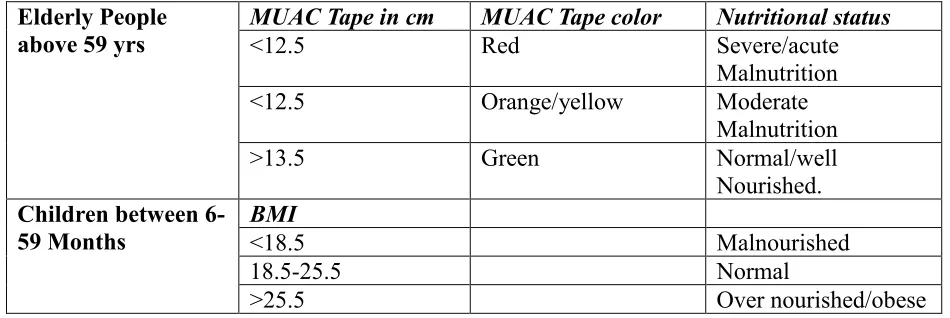
Table 1: table showing indicator of nutritional status of the elderly and children between 6-59 months
Elderly People above 59 yrs
MUAC Tape in cm MUAC Tape color Nutritional status
˂12.5 Red Severe/acute
Malnutrition
˂12.5 Orange/yellow Moderate
Malnutrition
˃13.5 Green Normal/well
Nourished. Children between
6-59 Months
BMI
˂18.5 Malnourished
18.5-25.5 Normal
˃25.5 Over nourished/obese
2.1.2 Interview Schedule/Questionnaire
Questionnaire was designed to gather information about peoples understanding and feeling of
climate variability/change and food security. The study used structured, well-thought-out
questions designed to get particular information from a respondent. The questionnaires were
pre-tested for validity and reliability before the actual data collection. The questionnaire was also used
to collect personal and specific information from respondents.
2.2Methodology
2.2.1 Computation of Body Mass Index (BMI)
Then BMI was computed by dividing the body weight in kiligram (kg) and height in meters
squared (m2). Height was measured using a perpendicular bar graduated in centimeters while
weight was measured in kilograms by use of a weight scale. The computed BMI’s were then
categorized into three groups, severe malnutrition, moderate malnutrition and normal as shown in
table 1. Malnutrition in elderly people can be significant if a respondent has a BMI index of less
8
three groups; underweight, normal and overweight was calculated and gauged against 18.5-25-30
scale. Below 18.5 indicates Underweight, 18.5-24.9 indicates Normal; 25-29.9 indicates
overweight while 30.0 and above indicates obese [8, 48].
2.2.2 Statistical test
We computed the trend of both temperature and rainfall data from 1983 to 2015. The data was
then subjected to a Mann Kendall test to test the trend since it takes into account the seasonality
of the data. The Pearson product moment formula was then used to examine the relationship
between climate variability and food production trend in the two sub-counties of Kisii County.
Chi-square (χ2) test was used to determine whether observed variation in coping strategies at house
hold levels were statistically significant at 95% confidence level. Computed p-value less than 0.5%
would indicate that the difference is significant.
3.0 Results
3.1 Socio–Demographic Information of the Respondents.
It was better to find out the background information of the respondents, in terms of their gender,
age and education attained in order to be able to extract and analyze and judge their response
objectively.
3.1.1 Gender Distribution of the Respondents.
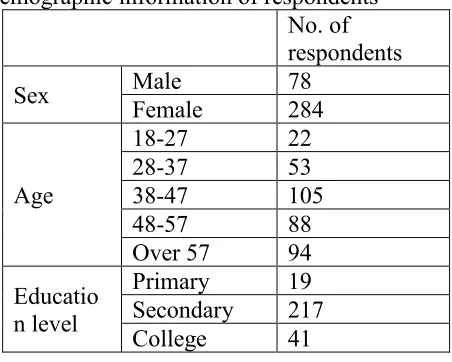
Table 2 gives a summary of the gender of the respondents interviewed. From the table, most
respondents were female at 78.5%. Traditionally men are out of the homes to go and work for the
family or are employed in towns. This corroborates with Wamue and Njoroge [57] and Giuliano
[21] findings that most African men are out of their homesteads either to fend for their families or
9
informal activities. The computed chi square value was 117.22 at 1 degree of freedom which shows
a significant difference between the number of female and male respondents. The respondents
were further grouped into age sets as shown in table 2. Most farmers were between age brackets
of 38-47. This might be because at that age most of them have family responsibility and have to
fend for their families either through farm activities or manual jobs. This corroborates the finding
of Echebiri and Mbanasor [10] that the active members of the society who can supply labor to
agricultural farms are usually in their 30 and 40 years therefore food security programmes should
target this group of people.
Table 2: Table showing demographic information of respondents No. of respondents
Sex Male 78
Female 284
Age
18-27 22
28-37 53
38-47 105
48-57 88
Over 57 94
Educatio n level
Primary 19 Secondary 217 College 41
In terms of education, majority of the farmers at 67% had secondary education level, while 22%
only attained primary education level and a paltry 11% acquired college education (table 2). Most
of these farmers could not acquire white color jobs and were already having families. This explains
why majority went into farming [31, 33].
.
3.2 Precipitation and Temperature trends in Kisii County
10
plotted to examine their interannual variability and subjected to Mann Kendall test for significance.
Figure 2a shows rainfall variation and trend for Kisii weather station from 1983 to 2013. From the
figure, the highest positive rainfall anomalies were recorded in 1987, 1997, 2005 and 2006 while
the year 1985, 1989 and 2000 saw a deep in rainfall amount. The highest amount of rainfall
recorded in 1987 can be attributed to the local factors such as the presence of lake Victoria around
Kisii county, that enhances convectional rainfall in the surrounding areas [3], while the lowest
amount of rainfall recorded in 1984, can be attributed to drought conditions that was experienced
in many parts of Africa in 1983 to 1984 [32]. Notably, the year 1997 experienced positive ENSO
event while the year 2000 experienced negative ENSO event [24]. The computed p value of Mann
Kendall test of 0.119 was greater than the critical value which showed that there has not been
significant change in rainfall amount over the years. We compared our findings with the data from
Kisii coffee substation which similarly showed that there has not been a significant change in
rainfall amount in Kisii County according to the computed p value of 0.0522. However, the amount
of rainfall recorded indicated a decreasing trend over the years, with the highest amount of
2420.1mm recorded in 1994 and the lowest of 1710.6mm recorded in 1984. The highest amount
of rainfall that was recorded in 1994 can be associated with Indian Ocean Dipole Mode [6, 50]
while the lowest amount that was recorded in 1984 can be attributed to the La Niña conditions that
were evolving that year [51]. On average, there has not been any significant change in rainfall
amount over Kisii County for the period 1983-2013 as evinced by the p-value of 0.59 computed
from Mann Kendall test, though the average trend is upward (figure 2a). This agrees with the
findings of Indeje et al. [24] that some parts of Kenya have no defined patterns of rainfall indices
11
Figure 2: Figure showing temperature and rainfall anomalies over Kisii County since 1983. The standardized anomalies were calculated from the mean of the entire period.
Consistent temperature data was only available from Kisii Karlo meteorological station. Figure 2b
shows standardized anomalies of the mean annual minimum temperature from 1983 to 2013. The
anomalies of minimum temperatures are on the rise over the region. From figure 2a, the year 1998
and 2005 recorded the highest minimum temperature anomaly while the year 1999 recorded the
12
later evolved into a La Niña which led to drought conditions at the end of the year. This coupled
with land cover degradation might have contributed to the high minimum temperature anomaly
recorded in 2005 [32]. The year 1999 was a post El Niño year that saw high amount of rainfall
received in 1988 extending to January-February-March-May season [24]. This could have led to
lower minimum temperature anomaly in the hottest months of January and February. In addition,
the year 1999 evolved into La Niña condition which might have led to cold ocean currents blowing
over land further cooling the land. Similarly, maximum temperatures are also increasing over Kisii
County (figure 2c). The highest maximum temperature anomaly was also recorded in 2005 while
the lowest maximum temperature anomaly was recorded in 1985. Similar to the minimum
temperature anomaly, the highest temperature recorded in 2005 can be attributed to ENSO
evolution and land cover degradation. The year 1985 could not be linked to any large scale climatic
forcing event. However we suspect that the lowest average maximum temperature recorded that
year could have been as a result of influx of cold Congo air mass [3] and the vegetation cover [44].
On average, temperatures have been on the rise in Kisii County (figure 2d). The computed Mann
Kendall p value of 0.001 (p˂0.05), shows that temperatures are increasing over the region at a
significant rate. This can be attributed to a range of factors that are not limited to global warming
[18, 25, 54], and land use/cover change [44, 46] among others.
3.3 Response on hydro-meteorological questions 3.3.1 Changes in river regimes
We asked the respondents whether they had noticed any changes in river levels over the years and
summarized their responses as shown in table 3. 84% of the respondents agreed that river levels
13
degree freedom (p˂0.05), an indication of the majority of the respondent agreed that the river
regimes had changed significantly. Whereas there is no discernible trend in precipitation,
temperature trends are rising significantly. Therefore, changes in river volumes and wetlands can
be attributed to increased evapotranspiration. Further, when asked in which direction was the river
and wetlands were changing, 70.7 % of the respondents indicated that the river levels and wetlands
have decreased over time while 29% indicated that they have increased (table 3). The computed
chi square value was 62.2 at 1 degree freedom which indicated a significant decrease in river levels
and wetlands. This observation is in line with Mironga [33] who indicated that Kisii wetlands were
under threat as a result of intensified agricultural activities. Further when asked to which extent
were the decrease in river volumes, 78.5% of the respondents indicated that they had decreased to
a large extent while 21.5% pointed that they had decreased to a small extent (table 3). The
computed chi square value was 83.3 at 1 degree of freedom (P˂0.05) which is statistically
significant. This further corroborates Mironga [33] observation that most wetlands were seriously
under threat.
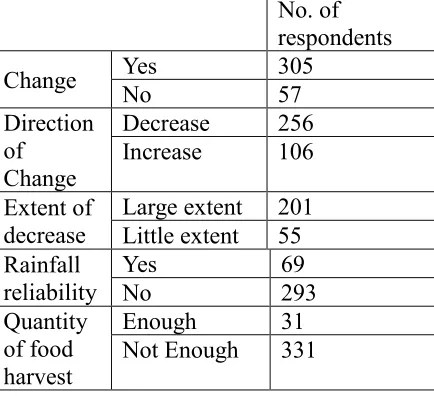
Table 3: Table showing how the local community perceives change in river regime, reliability of rainfall, and satisfaction with quantity of food harvest in Kisii County
No. of respondents
Change Yes 305
No 57
Direction of
Change
Decrease 256 Increase 106
Extent of decrease
Large extent 201 Little extent 55 Rainfall
reliability
Yes 69
No 293
Quantity of food harvest
Enough 31
14 3.3.2 Rainfall Reliability
Respondents were asked to indicate whether the onset of rainfall has been reliable in Kisii County
in the last three years. From table 3, majority of the respondents at 81% indicated that rains have
failed when expected while 19% indicated that it has never fail. The computed chi square value
was 138.6 at 1 degree of freedom (P˂ 0.05) an indication that a statistically significant majority
have lost hope in planting before the onset of rains and resorted to waiting until they see the first
drop to plant.
3. 4 Food Production Trends in Kisii County. 3.4.1 Maize and Beans in Marani sub-County
Figure 3a shows maize and beans production trend from 2009 to 2015 in Marani sub-County. From
the figures the lowest harvest for maize was in 2014 while the highest was in 2013. On the hand,
the highest production of beans was in 2013 while the lowest was in 2012. Good harvest in 2013
for both maize and beans could be attributed to the normal conditions that occurred that year
though the rainfall anomalies were on a downward trend. However, poor performance of maize in
2014 can be attributed to below normal precipitation that year (figure 2). However, poor harvest
of beans in 2012 can be attributed to climatic stresses associated with back-to-back failures in both
15
Figure 3: Figure showing variation in various crop production and price fluctuation of Maize and Beans in Marani (left panel) and Bomachoge (right panel) sub counties of Kisii County
3.4.2. Bananas and Sweet Potatoes in Marani SubCounty.
Figure 3b shows production of bananas between 2009 and 2015.The lowest production was in
2009 while the highest was in 2011. From the annual precipitation amount received in those years,
2009 amount of rainfall was below the Long Term Mean (LTM) while 2011 annual amount of
rainfall received was above the LTM. This can explain the disparity in the yields considering that
16
seemingly this did not affected banana production maybe due to the previous year rainfall
performance (figure 2a). However, the lowest harvest of sweat potatoes in Marani sub county was
in 2013 while the highest was in 2015 (figure 3c). From figure 2a, the year 2013 experienced a
drop in precipitation which can be attributed to the severe drought in 2012 which extended to 2013
[16, 17, 19, 20]. Despite being normal at the beginning of the year, the year 2015 evolved into an
El Niño conditions at the end of the year. This can explain the performance in potato production
in those years.
3.4.3 Maize and Beans Price in Marani sub-County
Figure 3c shows the trend of maize and beans’ prices between 2010 and 2015 in Marani Sub
County. From the figure, the lowest price decrease of both maize and beans were recorded in 2015
while the highest price increase was recorded in 2012. We attributed the highest price increase for
both maize and beans to back-to-back drought in 2011 and 2012 which led to low harvest. This led
to high demand of the little available food stock, hence higher prices. On the other hand, the year
2015 was an El Niño years which means there was plenty of food easing pressure on the demand
of maize and beans lead to reduction of prices of Maize and beans.
3.4.4 Maize and Beans harvest in Bomachoge Chache sub-County
Figure 3d shows maize and beans harvest anomalies in Bomachoge Chache from 2006 to 2015.
From the figure the highest decrease in harvest of maize and beans respectively was recorded in
2012. Similarly, this can be attributed to climatic stresses associated with back-to-back failures in
both the boreal winter and the boreal spring of 2011 and 2012 [16, 17, 19, 20, 30, 43]. The highest
maize production of 103,500 bags was realized in 2006 and 2009. The highest increase in Beans
17
condition that spill over to 2006 upto during the long rain season. The year 2009 was a La Niña
year which can also be evinced with the decrease in annual average rainfall amount recorded in
2009. Explaining the high yield in beans in 2013 would need further investigation, though the year
2013 was normal (figure 2a). Notably, maize yield in Bomachoge is on downward trend while
Beans yield is on an upward trend. This could be due to the fact that rainfall amount in Bomachoge
area is on a downward trend (figure not shown) which affect the yield of maize while Beans take
shorter duration depending on type and require less nutrients as they can fix their own.
3.4.5 Bananas and Sweet Potatoes in Bomachoge Chache sub-County
Figure 3e shows bananas production between 2009 and 2015. The highest decrease in both
Bananas and sweet potatoes yield was recorded in 2012. This can similarly be attributed to
back-to-back drought conditions in 2011 and 2012 [16, 17, 43]. High banana yield was recorded in 2014
and 2015. This can be attributed to positive rainfall anomalies that started in 2013 leading to
positive ENSO event at the end of 2015. On the other hand, the highest increase in the yield of
sweet potato was recorded in 2014 and 2015. The highest yield can similarly be attributed to the
positive ENSO conditions that were evolving. Nonetheless, Banana yield has not been affected so
much despite rise in temperature. Similar findings have been attributed to tea by Ochieng et al.
[37] who found out that climate variability and change affects agricultural production but effects
differ across crops. While temperature has a negative effect on crop and maize revenues, it had a
positive one on tea, while rainfall on the other hand has a negative effect on tea.
3.4.6 Maize and Beans Price Trends in Bomachoge Chache .
18
lowest price per 90 kg bag was recorded in 2009. However, the highest increase in beans price was
in 2015 while the highest drop was recorded in 2009 and 2010. Notably, both prices of maize and
beans have been rising steadily since 2009 despite the fact that beans yield have been increasing
(figure 3d). It is more understandable that the price of maize has been increasing, and this can be
attributed to the decline in maize yield over the years. However, we found out that beans prices
were increasing due to high demand as an alternative to maize since most people replace maize
with other alternatives such as rice.
3.5 Perception of Kisii County farmers on Food security and Weather prediction. 3.5.1 Quantity of Food Harvested in the last 12 Months.
The numbers of residents interviewed in Kisii County were asked whether they harvested enough
food in the last 12 months of the year 2015. Table 3 shows how those interviewed responded. Only
8.6 of the respondents indicated that they harvested enough to take them to another season while
a whopping 91.4% of the respondents stated that their harvest was not enough to take them through
to another season. This is supported by the computed chi square value of 248.6 (P ˂ 0.05) which
indicated that a significant majority of the respondents were facing food crisis in Kisii County in
the year 2015. Similar findings had been indicated by the African women studies center [2] who
stated that Kisii County is a food insecure region due to increasing urban development and high
population density per square km.
3.5.2 Food Security Coping Strategies.
Respondents were asked on how they were bridging the gap on food deficit. Our findings showed
that most of the residents at 89.5% bought food from markets, which are imported from other
19
2% depend on relief food (table 4). Since most of the respondents said that they buy food from the
nearby markets, they were asked on the source of the funds that they use to buy food items.
Majority of the respondents at 24.8% sold some of their farm produce to get money for other food
items while some of the respondents at 23.3% resorted to selling their properties (table 4) which
put them more in a poverty cycle. Similar findings had also been noticed in Bungoma County [56].
Table 4: table showing how residents of Kisii County cope with food insufficiency and their source of income to bridge the gap
No. of respondents
Coping strategy
Buying from
nearby Markets 322 Beg from
relatives 31
Relief food 7
Source of Funding
Selling property 75 From employed
children 53
Cash crops 80 Offering labor 50 Borrow money
to buy food 29
Others 35
3.5.3 Planting Habits.
Table 5 shows the planting habits of the residents who were interviewed. Majority of the
respondents at 94% said that they wait for rainfall before planting. This probably could be due to
the uncertainty in the onset of rains which corroborates the reason for the perception on rainfall
reliability in Kisii County (table 3). However, 17% of the respondents stated that they plant and
wait for rainfall while 5% planted and irrigate. The computed chi square value was 45.45 at 2
20 the onset of rainfall to plant.
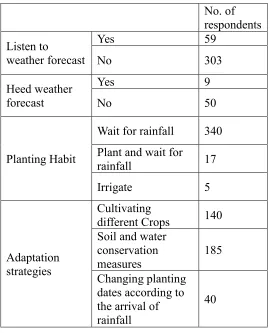
Table 5: How residents respond to weather forecast, their perception to climate variability and their planting habit.
No. of respondents Listen to
weather forecast
Yes 59
No 303
Heed weather forecast
Yes 9
No 50
Planting Habit
Wait for rainfall 340 Plant and wait for
rainfall 17
Irrigate 5
Adaptation strategies
Cultivating
different Crops 140 Soil and water
conservation measures
185
Changing planting dates according to the arrival of rainfall
40
3.5.4 Climate Variability Adaptation Strategies
When asked on how they adopt to climate variability, and the majority of the residents at 51.1%
preferred soil and water conservation measures followed by cultivation of different crops at 33.1%
(table 5). Those who preferred changing planting dates were at 11% while those who preferred
planting different crops were at 5.5%. Similar findings have also been reported in Ethiopia where
farmers in Haraghe adapted soil and water conservation measures to curb the effects of climate
variability [28] and in Ghana among smallholder farmers [1]. The computed chi square value was
21 3.5.5 Weather Forecast response
Residents were asked whether they listen to weather forecast and how they responded to the
forecast. We found out that 84% of the residents never listen to weather forecasts while only 16%
of the residents listened to weather forecasts (table 5). The computed chi square value of 164.4 at
1 degree freedom (p˂0.05) is an indication that majority of Kisii County residents do not care
about weather forecast. On whether those who listen to weather forecast take heed of the forecast,
similarly majority of the respondents at 85% never took heed of weather forecasts compared to
only 15% who considered the forecast. From the computed chi square value of 28.50 at 1 degree
freedom (p˂ 0.05), it is obvious that a statistically significant number of farmers in Kisii County
do not listen to or if they listen to weather forecast they do not take the forecast into consideration
in their agricultural activities (table 5). This was attributed to lack of faith and understanding of
weather forecast.
3.6 Nutritional Status
Elderly members of the household were assessed in terms of their nutritional status using BMI as
shown in table 1. Men were more nourished at 32.30% than women at 24.6%. In addition, men
were more obese at 15% than women at 4.61%. This can be attributed to the fact that rural women
in Africa ingest less fat due to lower household income and engage in more physical activities [40].
The nutritional status of children between 6-59 moths was also assessed using MUAC tape
measure as shown in table 1. Our findings show that 23.3% of children between the ages of 6-59
months in Kisii County suffer severe malnutrition while 43.3% of the children are moderately
malnourished and 33.4% are well nourished. The computed chi square value was 3.6 at 2 degrees
of freedom and (p<0.5), an indication of significant variation in nutritional status of children less
22
Figure 4: Distribution of the nutritional status of a sample of the residents of Kisii County
4. Discussion and Conclusion
The main objective of this study was to find out how climate variability contributes towards food
insecurity/security in Kisii County. Kisii County has two sub counties; Marani and Bomachoge
Chache sub counties. We analyzed how annual precipitation and temperature (minimum and
Maximum) have been changing for the past 30 years in Kisii County and how that has affected
food production in the County. From our analysis, rainfall in Marani sub County has been on an
upward trend over the years while rainfall in Bomachoge Chache sub County has been on a
downward trend. However, Mann Kendall test do no depict any statistical significance in the
trends. On the contrary, both minimum and maximum temperatures over the county are on an
23
trend is statistically significant. This means that with increased atmospheric temperature, the water
holding capacity of the atmosphere increases; hence, increased demand for more atmospheric
moisture. What follows is enhanced evapotranspiration both from water bodies, wetlands and from
the surface. This might explain the observed significant reduction in river regimes.
Following these climatic changes, we noticed that this has affected food crop production more so
maize and sweet potatoes in both sub counties. For instance, the modest positive rainfall trend in
Marani sub County was also reflected in the trend of Maize and Beans production where both also
showed a slight positive trend, though insignificant. Similarly a deep in rainfall in Bomachoge
Chache sub County saw a decrease in maize yield over the years. However, the yield of Beans was
on an upward trend in. This could be due to the fact that maize is a heavy consumer of nutrients
and require more fertilize and moisture. However Beans can thrive with little nutrients since it can
fix its own and can take shorter duration to mature depending on the type. In addition, beans require
less rainfall and stable temperatures.
More noticeable is the trend of sweet potatoes. Sweet potatoes trend is downward over the years
in Kisii County. This is a clear pointer that sweet potatoes cannot do well in limited soil moisture
conditions. Nonetheless, banana production is not affected even during drought periods. More
surprisingly is that banana yield is on an upward trend over the years investigated. This could be
attributed to the fact that banana takes about one and half year to mature, therefore, drought in one
year can be compensated for before the plant mature. In addition banana roots can go a little deeper
into the soil therefore they can still reach water levels in the early days of drying as compared to
potatoes.
24
various products due to forces of demand and supply. For instance, it could be observed that both
prices of maize and beans were on a downward trend in Marani sub County and on an upward
trend in Bomachoge Chache sub County. The prices were more exacerbated by ENSO events
especially during La Niña years. For example, the highest increase in price of maize in Marani Sub
County was recorded in 2012 while the highest deep in price was recorded in 2015. Similarly, the
highest increase in price of beans per 90 kg bag was also recorded in 2012 while the lowest price
was similarly recorded in 2015. Noticeably, the year 2012 was one of the driest years in the recent
past in Kenya and the year 2015 experienced positive ENSO events towards the end of the year.
To understand whether the residents of Kisii County were aware that most of the changes they are
witnessing in agricultural production were as a result of the changing climatic conditions, a sample
of the populations were interviewed to get their opinion on rainfall reliability, weather forecast and
their planting habits. It was distinctively clear that a majority of the respondents at 81% had no
faith in rainfall onset period and had switched to a mode of “wait and see”. This could also explain
their perception on weather forecast. In fact only a handful of the residents bothered to listen to
weather forecast. Of the 16% who listen to weather forecast ~ 59 persons, only 9 persons ~ 15%
considered the forecast in their agricultural activities. This is a clear indication on how farmers in
Kisii County are hopeless of weather and climate information given to them. This tradition is
replicated throughout Kenya due to the fact that majority of the population do not understand
weather and climate information in a format in which it is released to the public. Most weather
forecast are issued in probabilistic terms such as “chance of”, “likelihood”, which is not
understandable to a common man [15, 47]. Nevertheless, residents of Kisii County have resorted
to a number of ways of adapting to weather and climate stresses such as soil and water conservation
25 onset dates.
From the trend of annual yield of farm produce, it is obvious that agricultural production has
declined over the years. A number of residents interviewed confirmed this when they were ask
whether they had harvested enough to last them to the next season in the year 2015. A paltry 8.6%
of the respondents were satisfied with their harvest. This meant that a majority of the population
could not have enough meals in a day leading to malnutrition, more so the elderly and children
who cannot fend for themselves. For instance, from the BMI of the elderly assessed, approximately
23% were malnourished while from the MUAC tape measure, 23.3% of children between the ages
of 6-59 months in Kisii County were severely malnourished. This situation has forced most of the
resident of Kisii County to device ways to bridge the gap of food deficit. While some have money
to buy additional food stuff from the market, others have resorted to selling their properties which
makes them poorer and dependent on their relatives and on relief food/food aids.
In fragile food economies like witnessed in most African countries, repetitive climatic stresses
such as drought and flood events can lower resilience, disrupt development, and require large
infusions of emergency assistance. In this study we focused on the effect of climatic factors on
food security in Kisii County. It is obvious that majority of the population in Kisii County do not
understand what weather and climate forecast mean in the format in which it is issued. We therefore
recommend civic education to educate the public on weather and climate information and how to
incorporate such information in their agricultural decisions. We further recommend establishment
of alternative source of water such as artificial dams and boreholes to provide water during
prolonged drought period. To cushion farmers against prolonged drought, deep rooted crops such
as bananas should always be part of the crops in the farm. While we have only focused on rainfall
26
and alternative crops that can withstand prevailing climate conditions. Better understanding and
accurate prediction of rainfall totals and other factors that affect food production in the country is
of importance in planning, development and management of agricultural activities in order to attain
food security and move towards achieving vision 2030 in Kenya.
5. References
1. Abdul-Razak M, Kruse S (2017) The adaptive capacity of smallholder farmers to climate change in the Northern Region of Ghana.Climate Risk Management 17: 104–122
2. African women studies center (2014) Ensuring food security in Kisii county. University of Nairobi press. ISBN 978-9966-792-61-7. Available online at (uonbpress.uonbi.ac.ke/sites/default/files/centraladmin/uonpress/kisii%county)
3. Anyah RO, Semazzi FH (2007) Climate variability over the Greater Horn of Africa based on NCAR AGCM ensemble. Theoret Appl Climatol 86:39–62
4. Anyah RO, Qiu W (2011) Characteristic 20th and 21st century precipitation and temperature patterns and changes over the Greater Horn of Africa. Int J Climatol 31.
doi:10.1002/joc.2270
5. Beddington RJ, Mohammed A, Megan E, Clark AFB, Marion DG, Molly MJ, Judi W (2012) The Role for Scientist in Tackling Food Insecurity and Climate Change. Agriculture and food security. DOI:https://dx.doi.org/10.1186/2048-7010-1-10..
6. Behera SK, Krishnan R, Yamagata T (1999) Unusual ocean atmosphere conditions in the tropical Indian ocean during 1994. Geophys Res Lett 26: 3001–3004
7. Cattiaux J, Yiou P (2013), Contribution of atmospheric circulation to the wet North European summer of 2012, in Explaining Extreme Events of 2011 from a Climate Perspective, Bulletin of the American Meteorological Society, 94 (9): S39-S41
8. CDC (2010) BMI: Considerations for Practitioners. Department of Health and Human Services. USA.
9. Dolorence C, Tong O (2007) Purposive Sampling as Tool for Informant Selection. A journal of plants, people and Applied ResearchP147.
27
11. Ecker O, Clemens B (2012) Food Security Systems A New Conceptual. Framework Pp 1-24.
12. Enete IC (2014) Impacts of Climate Change on Agricultural Production in Enugu State, Nigeria. J Earth Sci Clim Change 5: 234. doi:10.4172/2157- 7617.1000234
13. FAO (2008) Climate change, Bio-energy and food security, Options for decision makers identified by expert Meetings. World food security .The challenges of climate change and Bio-energy. June 3-5 Rome.
14. FAO (2013) The State of Food Insecurity in the World 2013. The Multiple Dimensions of Food, Security Rome 201.3 Pp 7-17.
15. Feleke HG (2015) Assessing weather forecast needs of smallholder farmers for climate change adaptation in the central rift valley of Ethiopia. J Earth Sci Cli Change. 6:312. Doi:10.4172/2157-7617.1000312
16. FEWS NET, 2012a: East Africa Food Security Alert: Poor forecast suggests that increased food insecurity is likely in the eastern Horn. 6 April 2012. [Available online at http://www.fews.net/docs/Publications/East%20Region_Alert_2012_04_06_final.pdf.]
17. —, 2012b: East Africa Food Security Alert: Crisis levels of food insecurity will persist following below-average March to May rains. 14 June 2012. [Available online at
http://www.fews.net/docs/Publications/East%20Region_Alert_2012_06_final.pdf.]
18. Funk C, Dettinger MD, Michaelsen JC, Verdin JP, Brown ME, Barlow M, Hoell A (2008) Warming of the Indian Ocean threatens eastern and southern African food security but could be mitigated by agricultural development. Proc. Natl. Acad. Sci. USA, 105: 11081– 11086.
19. Funk C, Greg Husak, Joel Michaelsen, Shraddhanand Shukla, Andrew Hoell, Bradfield Lyon, Martin P. Hoerling, Brant Liebmann, Tao Zhang, James Verdin, Gideon Galu, Gary Eilerts, And James Rowland (2013) attribution of 2012 and 2003–12 rainfall deficits in eastern kenya and southern Somalia [in “Explaining Extreme Events of 2012 from a Climate Perspective”]. Bull. Amer. Meteor. Soc., 94 (9): S6–S9
20. Funk C (2013) Exeptional warming in the western Pacific-Indian Ocean warm pool has contributed to more frequent droughts in eastern Africa. in Peterson, T. C., P. A. Stott, S. Herring, eds., Explaining extreme events of 2011 from a climate perspective, Bulletin of the American Meteorological Society (93): 1041-1067, doi: 10.1175/BAMS-D-11-00021.1.
28
22. Godden B (2004) Sample size formulae. Journal of Statistics, Vol 3. No 66.
23. GOK (2010) Short Rains Assessment Report. Kenya food security steering Group Pp 1-42.
24. Indeje M, Semazzi FHM, Ogallo LJ (2000) ENSO signals in East African rainfall seasons. Int J Climatol 20:19–46
25. IPCC (2008) Towards new scenarios for analysis of emissions, climate change, impacts, and response strategies. IPCC Expert Meeting Report on New Scenarios, Noordwijkerhout, Intergovernmental Panel on Climate Change
26. Jospert NK, Robyn M, Xiuyuan X, Simon NN (2012) The significant of postharvest management in farm manahement. Aflatoxin mitigation and food security in sub-sahara Africa. Greener Journal of Agricultural Science. Vol. 2 No. 6
27. Kumba KJ, Francis WJ (2015) The Influence of Agricultural Land Use on Household Food Security Situation in Kisii Central Sub-County. Journal of Economics and sustainable Development. Vol.6. No 6.
28. Lemma Z, Wondimagegn M (2014) Small holder’s vulnerability to food security and coping strategies in the face of climate change in East Hararghe-Ethiopia. Journal of Economics and sustainable development. P93
29. Lott FC, Christidis N, Stott PA (2013) Can the 2011 East African drought be attributed to human-induced climate change? Geophys. Res. Lett, 1-5.
30. Lyon B, DeWitt DG (2012) A recent and abrupt decline in the East African long rains. Geophys Res Lett 39:L02702. doi:10.1029/2011GL050337
31. Masese CO, Ondimu KN, Mironga JM (2016) Identiffication of the weather shocks associated with Rainfall in Kisii central sub-county Kenya. Journal of environmental science, Toxicology and food Technology. Volume 10. Issue 7
32. Masih I, Maskey S, Mussa FEF, Trambauer (2014) A review of Droughts in the African Continent. A Geospatial and long –Term Perspective. Pp 2681.
33. Mironga JM (2005) Effect of farming practices on wetlands of Kisii District. Ecology and Environmental research 3(2): 81-91.
34. Mugenda MO, Mugenda AG (2003) Research Methods; Quantitative and Qualitative Approaches. Acts Press, Nairobi Kenya. Pp 49-50.
29
36. Nyariki IS, Kiprop BK, Hillary PM, Newton N (2015) Analysis of Technical Efficiency among Smallholder Farmers in Kisii County, Kenya. Journal of Agriculture and Veternary science 8(3): 50-56.
37. Ochieng J, Kirimi L, Mathenge (2016) Effects of climate variability and change on agricultural production: The case of small scale farmers in Kenya. NJAS - Wageningen Journal of Life Sciences 77: 71–78
38. Ogechi BA, Huja WE (2012) Land use Land cover Changes and Implications for Food Production. A case study of Keumbu Region Kisii County Kenya. International journal of science and Research (IJSR). ISSN:2319-7064
39. Ogunrinade SA (2014) the incidences of malnutrition in children (Age 0-5 years). Journal of Agriculture and life sciences. 1(2) P.81
40. Olufuke OA Osungbade KO (2013) Trends of Obesity Epidermic and its social cultural Dimension in Africa. Implications for Health systems and Environmental interventions; Emerging issues in medical Diagnosis and Treatment. In concept press. ISSN 2309-3528
41. Oldenborgh GJ, van Urk A, Allen MR (2013) The absence of a role of climate change in the 2011 Thailand floods Bull. Amer. Meteor. Soc 93: 1047-1049, doi:10.1175/BAMS-D-12-00021.1
42. Omondi P, Ogallo LA, Anyah R, Muthama JM, Ininda J (2013) Linkages betweenglobal sea surface temperatures and decadal rainfall variability over Eastern Africa region.Int. J. Climatol 33 (8): 2082-2104
43. Ongoma V, Guirong T, Ogwang BA, Nyarukinyimana JP (2015) Diagnosis of seasonal rainfall variability over East Africa. A case study of 2010-2011 drought over Kenya. Parkistan Journal of Meteorology. Vol. 11, issue 22.
44. Otieno VO, Anyah RO (2012) Effects of land use changes on climate in the Greater Horn of Africa. Climate Research 52: 77-95
45. Otieno VO, Anyah RO (2013) CMIP5 simulated climate conditions of the Greater Horn of Africa (GHA). Part II: contemporary climate. Clim Dyn. doi:10.1007/s00382-013-1694-z
46. Otiso CM, Ondimu KN, Mironga JM (2016) Identification of weather shocks associated with rainfall in Kisii Central sub-county Kenya. Journal of Environmental Science, Toxicology and Food 10(7): 219-299
47. Rao K, Ndegwa W, Kizito K, Oyoo A (2011) Climate variability and change: farmers perception and understanding of intra-seasonal variability in rainfall and associated risk in semi-arid Kenya. Experimental Agriculture 47: 267-291.
30 preventive Medicine 2 (1): 59-66
49. Rupp DE, Mote PW, Massey N, Rye CJ, Jones R, Allen MR (2012) Did human influence on climate make the 2011 Texas drought more probable?, in Peterson, T. C., P. A. Stott, S. Herring, eds., Explaining extreme events of 2011 from a climate perspective, Bulletin of the American Meteorological Society 93: 1041-1067, doi: 10.1175/BAMS-D-11-00021.1.
50. Saji NH, Goswami BN, Vinayachandran PN, Yamagata T (1999) A dipole mode in the tropical Indian Ocean. Nature 401:360–363
51. Schreck C, Semazzi FHM (2004) Variability of recent climate of East Africa. Int J Climatol 24: 681-701
52. Tesfaye A, Jemal H (2014) The sensitivity and specificity of mid upper arm circumference compared to body mass index in screening malnutrition of adult patients taking ART. Science journal of Public Health P20
53. Trigo RM, Añel JA, Barriopedro D, García-Herrera R, Gimeno L, Nieto R, Castillo R, Allen MR, Massey N (2013) The Record Winter Drought of 2011–12 In The Iberian Peninsula [in “Explaining Extreme Events of 2012 from a Climate Perspective”]. Bull. Amer. Meteor. Soc 94 (9): S42–S48
54. Vecchi GA, Soden BJ (2007) Global warming and the weakening of the tropical circulation. J Climate 20 (17): 4316-4340.
55. Vries H, Westrhenen R, Oldenborgh GJ (2013) the February 2012 European cold spell that didn’t bring the dutch another 11-city tour [in “Explaining Extreme Events of 2012 from a Climate Perspective”]. Bull. Amer. Meteor. Soc 94 (9): S26–S28
56. Wabwoba MS, Wakhungu JW, Muterama S (2016) Household food insecurity coping strategies in Bungoma county. Internatinal journal of nutrition and science p715.
57. Wamue NG, Njoroge WL (2011) Gender paradigm shift within the family structure in Kiambu. African journal of social sciences Vol. 1 No. 03 ISSN 2045-8460.
58. Wendel J (2018) Global average temperatures in 2017 continued upward trend, Eos, 99,
https://doi.org/10.1029/2018EO091299
59. World Bank (2011a). Missing Food: The case of postharvest Grain losses in Sub-Saharan Africa. Economic and Social Sector Work. P10.
31
ACKNOWLEDGEMENT
This work was part of my study as a Masters student. To achieve this many people were involved
including my family who funded me through the study and encouraged me emotionally. Special
thanks also go to Agricultural offices and Kenya meteorological department who allowed us access
to their data. Lastly, those who took their time to grant us interview and provide information freely