Anuradha Yadav, Savita Yadav, Sanjay Singh, Nishant Tripathi
Abstract— The Organic thin film transistor has made significant progress in the recent past in achieving high performance in terms of mobility, Ion/Ioff
current ratio, threshold voltage, sub threshold voltage and transconductance, still faces a number of challenges at the fabrication , materials and device physics level. In this paper we are using PTAA with different insular combination and form organic transistor and compare other material in basis of mobility, threshold voltage, and transconductance, on/off ratio, Sub-threshold slope, ID min and ID max.
Index Terms— PTAA, OSC, OTET, P3HT, dielectric, transconductance, sub-threshold voltage.
————————————————————
1
I
NTRODUCTIONRecently there has been remarkable interest on organic electronics because of their unique advantages such as low cost fabrication, light weight and mechanical flexibility. The contemporary portable communication and computing devices need light weight, high image quality, thin and low power flat panel displays. The answer to this need is Organic Thin Film Transistor (OTFT). It is likely to have suitable applications requiring large area coverage, structural flexibility and low cost which was not possible with crystalline silicon [1].However, the innovative human mind soon searched a novel class of TFTs based on organic or polymeric semiconductor as active layer material that shows amazing possibility for integration onto flexible plastic substrates, thus giving the world an idea of futuristic technology of low cost, thin, printable electronics, flexible and light weight displays [2]. Organic thin film transistors (OTFT) have made impressive progress over the last decade. Organic electronics allows us the option of making devices that are cheap, flexible and just smart enough to perform the task in hand. Electronic price tags, chemical sensors, information displays, electronic paper and low cost microelectronics are among potential applications.
2
PTAA
WITH DIFFERENT INSULATOR COMBINATION Here the dimension of device kept same, but the organic semiconductor and dielectric material has been changed. PTAA is used as OSC in place of P3HT. The band gap of PTAA is taken as 3.3eV, density of both valance band (NV) and conduction band (NC) states as 2.88*1021 cm3, mobility of holes and electrons as 0.7 and 5*10-5cm2/V-sec.2.1 PTAA with Al2O3+SAM dielectric
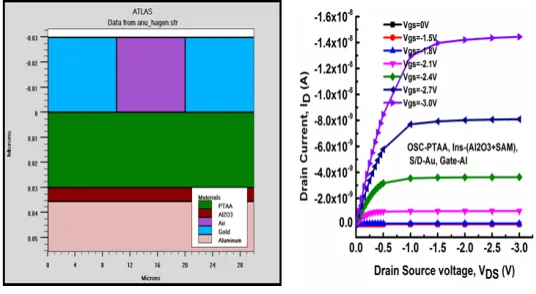
Fig .1(a) Simulated Structure (b) Output characteristics (Id-Vd) for different constant Vgs values
The dimension of device is same as discussed above, only gate dielectric has been changed. In Fig.1 (a) Al2O3+SAM layer has chosen as dielectric, which has dielectric constant of 4.5 and due to which capacitance of dielectric has been also changed i.e. 0 .7 µF/cm2. Fig.1 (b) shows the output characteristics for top contact bottom gate organic thin film transistor with drain voltage varying with step of -0.05V from 0 to -0.5V then vary the step with 0.5 from 0.5 to -3V. Here Vg sis kept constant and curves are drawn for Vgs 0V,1.5V, -1.8V, -2.1V, 2.4V, 2.7V, 3V. The drain source voltage Vds is varied. In this curve, the lowest current is -6.10*10-21 Amp. at constant Vgs 0V and max current is -1.44*10-08Amp. at constant Vgs -3V.
————————————————
• Anuradha Yadav is currently pursuing masters degree program in ED&T in NIELIT Gorakhpur, India
PH-07428683431. E-mail: [email protected]
• Savita Yadav is currently pursuing masters degree program in ED&T in NIELIT Gorakhpur, India
PH-09198853333. E-mail: [email protected]
• Sanjay Singh is currently working as a Assistant Professor in BIT GIDA Gorakhpur, India
PH-09450890613. E-mail: [email protected]
109 IJSTR©2012
Fig .2 (a) Transfer characteristics (Id - Vgs) at Vds= -1.5 V (b) Log 10 Id Vs Vgs curve at Vds = -1.5V
Fig.2 (a) shows the transfer characteristic of top contact bottom gate organic thin film transistor with gate voltage Vgs varying with step 0.5 V from 0V to -3V and Vds is kept constant at -1.5 V. Here It can be seen from fig.2 (b) log 10Id vsVgs curve, that Vgs is varied with a step of -0.5 V from -3V to -0V and Id varies from -4.54*10-24Amp to -1.40*10-08 Amp. This curve is drawn in saturation region, keeping Vds constant at 1.5V.
2.2 PTAA with HfO2 dielectric
Fig.3 (a) Simulated Structure (b) Output characteristics (Id-Vd) for different constant Vgs values
The dimension of device is kept same as discussed above, only gate dielectric has been changed. In Fig.3 (a) HfO2 layer has chosen as dielectric, which has dielectric constant of 22 and due to which capacitance of dielectric has been also changed i.e. 3.4 µF/cm2. Fig.3(b) shows the output characteristics for top contact bottom gate organic thin film transistor with drain voltage varying with step of -0.05V from 0 to -0.5V then vary the step with 0.5 from 0.5 to -3V. Here Vgsis kept constant and curves are drawn for Vgs 0V,1.5V, -1.8V, -2.1V, 2.4V, 2.7V, 3V. The drain source voltage Vds is varied. In this curve, the lowest current is -4.06*10-21 Amp. at constant Vgs 0V and max current is -6.46*10-08Amp. at constant Vgs -3V.
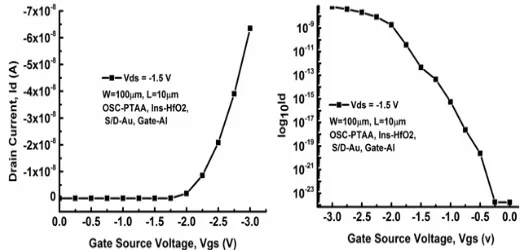
Fig .4 (a) Transfer characteristics (Id - Vgs) at Vds= -1.5 V (b) Log 10 Id Vs Vgs curve at Vds = -1.5V
Fig.4(a) shows the transfer characteristic of top contact bottom gate organic thin film transistor with gate voltage Vgs varying with step 0.5 V from 0V to -3V and Vds is kept constant at -1.5 V. Here It can be seen from fig 4.16.2 (b) log 10Id vsVgs curve, that Vgs is varied with a step of 0.5 V from 3V to 0V and Id varies from -1.67*10-24Amp to -6.35*10-08 Amp.This curve is drawn in saturation region, keeping Vds constant at 1.5V.
2.3 PTAA with Fluor polymer dielectric
The dimension of device is kept same as discussed above, only gate dielectric has been changed. In Fig.5(a) Fluor polymer layer has chosen as dielectric, which has dielectric constant of 2.1 and due to which capacitance of dielectric has been also changed i.e. 0.33 µF/cm2.
Fig.5 (a) Simulated Structure (b) Output characteristics (Id-Vd) for different constant Vgs values
Fig,6 (a) Transfer characteristics (Id Vgs) at Vds= -1.5 V (b) Log 10 Id Vs Vgs curve at Vds = --1.5V
Fig.6(a) shows the transfer characteristic of top contact bottom gate organic thin film transistor with gate voltage Vgs varying with step 0.5 V from 0V to -3V and Vds is kept constant at -1.5 V. Here It can be seen from fig.6(b) log 10Id vsVgs curve, that Vgs is varied with a step of -0.5 V from -3V to -0V and Id varies from -2.21*10-22Amp to -4.03*10-09 Amp.This curve is drawn in saturation region, keeping Vds constant at 1.5V.
2.4 PTAA with PMMA dielectric
Fig.7(a) Simulated Structure (b) Output characteristics (Id-Vd) for different constant Vgs values
The dimension of device is kept same as discussed above, only gate dielectric has been changed. In Fig.7(a) PMMA layer has chosen as dielectric, which has dielectric constant of 3.5 and due to which capacitance of dielectric has been also changed i.e. 0.54 µF/cm2. Fig.7(b) shows the output characteristics for top contact bottom gate organic thin film transistor with drain voltage varying with step of -0.05V from 0 to -0.5V then vary the step with 0.5 from 0.5 to -3V. Here Vgs is kept constant and curves are drawn for Vgs 0V,1.5V, 1.8V, -2.1V, 2.4V, 2.7V, 3V. The drain source voltage Vds is varied. In this curve, the lowest current is -4.59*10-21 Amp. at constant Vgs 0V and max current is -6.11*10 -09
Amp. at constant Vgs -3V.
Fig.8(a) Transfer characteristics (Id - Vgs) at Vds= -1.5 V (b) Log 10 Id Vs Vgs curve at Vds = -1.5V
Fig.8(a) shows the transfer characteristic of top contact bottom gate organic thin film transistor with gate voltage Vgs varying with step 0.5 V from 0V to -3V and Vds is kept constant at -1.5 V. Here It can be seen from fig.8(b) log 10Id vsVgs curve, that Vgs is varied with a step of -0.5 V from -3V to -0V and Id varies from -5.47*10-23Amp to -5.92*10-09 Amp.This curve is drawn in saturation region, keeping Vds constant at 1.5V.
2.5 PTAA with CYTOP dielectric
Fig.9(a) Simulated Structure (b) Output characteristics (I d-Vd) for different constant Vgs values
The dimension of device is kept same as discussed above, only gate dielectric has been changed. In Fig.9(a) CYTOP layer has chosen as dielectric, which has dielectric constant of 2.2 and due to which capacitance of dielectric has been also changed i.e. 0.34 µF/cm2. Fig.9(b) shows the output characteristics for top contact bottom gate organic thin film transistor with drain voltage varying with step of -0.05V from 0 to -0.5V then vary the step with 0.5 from 0.5 to -3V. Here Vgsis kept constant and curves are drawn for Vgs 0V,1.5V, 1.8V, -2.1V, 2.4V, 2.7V, 3V. The drain source voltage Vds is varied. In this curve, the lowest current is -7.37*10-22 Amp. at constant Vgs 0V and max current is -4.31*10 -09
111 IJSTR©2012
Fig.10(a) Transfer characteristics (Id - Vgs) at Vds= -1.5 V (b) Log 10 Id Vs Vgs curve at Vds = -1.5V
Fig.10(a) shows the transfer characteristic of top contact bottom gate organic thin film transistor with gate voltage Vgs varying with step 0.5 V from 0V to -3V and Vds is kept constant at -1.5 V. Here It can be seen from fig 4.19.2 (b) log 10Id vsVgs curve, that Vgs is varied with a step of 0.5 V from -3V to -0V and Id varies from -2.14*10-22Amp to -4.17*10-09 Amp.This curve is drawn in saturation region, keeping Vds constant at 1.5V.
2.6 PTAA with SiO2 dielectric
The dimension of device is kept same as discussed above, only gate dielectric has been changed. In Fig.11 (a) SiO2 layer has chosen as dielectric, which has dielectric constant of 3.9 and due to which capacitance of dielectric has been also changed i.e. 0.61 µF/cm2. Here Si is used as contacts in place of Al, which has work function of 4.6 eV.
Fig.11 (a) Simulated Structure (b) Output characteristics (Id-Vd) for different constant Vgs values
Fig.11 (b) shows the output characteristics for top contact bottom gate organic thin film transistor with drain voltage varying with step of -0.05V from 0 to -0.5V then vary the step with 0.5 from 0.5 to -3V. Here Vgsis kept constant and curves are drawn for Vgs 0V,-1.5V, -1.8V, -2.1V, 2.4V, 2.7V, 3V. The drain source voltage Vds is varied. In this curve, the lowest current is -5.08*10-21 Amp. at constant Vgs 0V and max current is -2.03*10-08Amp. at constant Vgs -3V.
Fig.12 (a) Transfer characteristics (Id - Vgs) at Vds= -1.5 V (b) Log 10 Id Vs Vgs curve at Vds = -1.5V
Fig.12 (a) shows the transfer characteristic of top contact bottom gate organic thin film transistor with gate voltage Vgs varying with step 0.5 V from 0V to -3V and Vds is kept constant at -1.5 V. Here It can be seen from fig.12 (b) log 10Id vsVgs curve, that Vgs is varied with a step of -0.5 V from -3V to -0V and Id varies from -1.87*10-20Amp to -1.93*10-08 Amp.This curve is drawn in saturation region, keeping Vds constant at 1.5V.
2.7 PTAA with Al2O3 dielectric
Fig.13 (a) Simulated Structure (b) Output characteristics (Id-Vd) for different constant Vgs values
The dimension of device is kept same as discussed above, only gate dielectric has been changed. In Fig.13 (a) Al2O3 layer has chosen as dielectric, which has dielectric constant of 9.1 and due to which capacitance of dielectric has been also
changed i.e. 1.41 µF/cm2. Fig.13 (b) shows the output
Fig.14 (a) Transfer characteristics (Id - Vgs) at Vds= -1.5 V (b) Log 10 Id Vs Vgs curve at Vds = -1.5V
Fig.14(a) shows the transfer characteristic of top contact bottom gate organic thin film transistor with gate voltage Vgs varying with step 0.5 V from 0V to -3V and Vds is kept constant at -1.5 V. Here It can be seen from fig 4.21.2 (b) log 10Id vs Vgs curve, that Vgs is varied with a step of -0.5 V from -3V to -0V and Id varies from -1.80*10-23Amp to -2.74*10-08 Amp.This curve is drawn in saturation region, keeping Vds constant at 1.5V.
3
P
ARAMETER EXTRACTION FOR DIFFERENT DIELECTRIC MATERIAL COMBINATION WITHPTAA
The performance parameters such as mobility, threshold voltage, Sub-threshold slope, transconductance, ON/OFF current ratio are extracted from characteristic plots of various OTFT structures. The resulting characteristics parameter values are presented in following table.
is required to fabricate and designing display and memory devices. So from the table, It can be concluded that the material combination 2 shows better performance as compared to other material combinations in terms of drain current, mobility, transconductance and Ion/Ioff current ratio and sub-threshold voltage
4 C
ONCLUSIONThis paper describes about the simulated device structure and output characteristics (Id-Vd) for different constant Vgs values. This also describes transfer characteristics (Id-Vgs) at Vds=-1.5V and Log 10 Id Vs Vgs curve at Vds = -1.5 V. These simulated structures and characteristics are drawn for pentacene with different insulators, PTAA with different insulators
.
A comparative analysis of various OTFTs with different material combination has been done using Silvaco ATLAS two dimensional finite element dependent numerical device simulations. The performance of material combination pentacene-HfO2-Au-Al is better in terms of Max. Ion, Max. transconductance gm, Max. µsat, Max. µlin and material combination PTAA-HfO2-Au-Al is better in terms of Min. Ioff, Max. Ion/Ioff ratio, Min. Sub-threshold slope voltage SS but material combination Pentacene-SiO2-Au-Si is better than othermaterial combinations in terms of Min. VT. Now a particular
material combination can be chosen according to our application
A
CKNOWLEDGMENTI feel a sense of deep self-satisfaction and a great experience of having accomplished my paper entitled “DESIGN OF PI CONTROLLER TO MINIMIZE THE SPEED ERROR OF D.C. SERVO MOTOR”. I would like to extend my gratitude and my sincere thanks to my honorable Sh.H.P.Shukla, Director in NIELIT, Gorakhpur, U.P., India 273010. I am also grateful to
Sh.S.K.Singh, HOD of ED&T in NIELIT, Gorakhpur, U.P., India 273010, for providing a solid background for my studies and research thereafter. I feel pleasure to express my profound gratitude to Sh.Nishant Tripathi for their valuable encouragement, timely suggestions and continuous support and providing me with all the necessary information.
R
EFERENCES[1] O. Marinov and M. Jamal Deen, “Performance of Organic thin film transistors,” J. Vac. Sci. Technol. B. vol. 24, no. 4, 2006.
[2] M. J. Deen, M. H. Kazemeini, and S. Holdcroft, “Contact effects and extraction of intrinsic parameters in poly (3-alkylthiophene) P3AT thin-film field effect transistors,” J. Appl. Phys., vol 103, no. 12, pp. 124 509 (1-7) , Jun. 2008.
113 IJSTR©2012
on Communication Systems and Network Technologies (CSNT 2011), 436-440.
[4] H. Klauk, G. Schmid, W. Radlik, Werner Waber, Lisong Zhou, Chris D. Sheraw,J. A. Nichols and T. N. Jackson, “Contact resistance in Organic Thin Film Transistors” Solid State Electronics 47 (2003)297-301.
[5] Yen -Yi Lin, Student Member, IEEE, David J. Gundlach, S. F. Nelson, and T. N. Jackson, “Pentacene-Based Organic Thin Film Transistors,” IEEE Trans. On Electron Devices, Vol. 44,No. 8, Aug. 1997.
[6] David J. Gundlach, Yen -Yi Lin, T. N. Jackson,S. F. Nelson, and D . G. Schlom,” Pentecene Organic Thin Film Transistor-Molecular Ordering and Mobility,” IEEE Electron Device Lett. Vol. 18 , No. 3, March 1997.