Particle Swarm Optimization With Kernel Support
Vector Machine For Churn Prediction In
Telecommunication Industry
Isabella Amali , Dr. R. Arunkumar
Abstract: At present times, because of the challenges posed from global competitors, customer churn prediction (CCP) provides a major concern for organizations in different churns. To provide better customer retention, various CCP models have been presented. This paper presents a new CCP using hybridization of particle swarm optimization with kernel support vector machine (PSO-KSVM) in telecommunication industry. Here, PSO algorithm is used to optimize the variables of SVM namely C and σ. The validation of PSO-KSVM takes place using a benchmark dataset. The results ensured the effective outcome of the presented model over the compared methods.
Keywords: Churn prediction, Customer retention, Telecommunication, Optimization algorithm.
————————————————————
1.
INTRODUCTION
Customer retention is assumed to be a main interest of various firms in the application of telecommunications. Along with the improved competition as well as production diversity on market, several telecommunications firms apply the use of data mining (DM) models which is helpful in predicting churn user [1]. In case of mobile telecommunications domain, the term churn is named as customer attrition or subscriber churning. In simple words it can be defined as the "customer loss" [2]. This customer loss can be estimated by measuring the values of churn which is more essential indicator to all companies. The task of migrating from one supplier to alternate one is a general habitat that is because of the good service or better advantages provided by the opposite firms while purchasing any product [3]. Most of the saturated markets and firms apply a preventive marketing principle to maintain their own customer relationship. To retain the user in a satisfied manner, every company acquires a model which is capable of finding a client with churn idea or suggestion. By identifying the customer churn, marketers can apply the proactive retention techniques [4]. In order to enhance the efficiency and to minimize the greater expense present in such type’s retention campaigns, churn forecasting must be more précised, to guarantee that incentives could be provided only when the users modify to the better service and to earn more profit. The customer retention process becomes easier by constructing a churn prediction method, and also the mobile telecommunications firms would be succeeded with static profit in a competitive market [5].
This development in churn prediction is very robust as it is based on the DM process as well as other methods as it has enhanced performance produced by ML techniques when related to statistical methods for non-parametric information [6]. Here [7], DM is the process of cleaning data which tends to identify the tendency as well as patterns that offers the suspicious questions which the customer requested. DM models are based on the junction of artificial intelligence (AI), ML, statistics, as well as DBMS [8]. Additionally, DM models are applicable in developing detection techniques to find upcoming movements and default nature by enabling the firms to create an intelligent decision according to the knowledge derived from dataset. The framework applied here is termed as modeling. Modeling is defined as the task of designing mining technique, an execution of particular ML approaches. Such kinds of models are arithmetic expression which helps to process unique level of corresponding dataset. According to the business issue which requires a service, DM models are widely divided into various classes [9]. A class that has a customer attention is named as classification analysis. Also, classification is a task developed by a method to create pre-classified training examples as a single category. Therefore [10], this classification technique is applied for classifying upcoming inputs respectively.
2.
PROPOSED
WORK
A. SVM Classification
The establishment of SVM is a benchmark in the application of ML technique. Some of the merits associated with SVMs are maximum precision, simple arithmetic tractability as well as direct geometric perception. In recent times, various enhanced SVMs are developed in a rapid manner, where the core SVM is a significant as well as effective. The kernel SVMs are composed with multiple benefits, as given in the following:
Performs quite-well in practice and very efficient in different applications like natural language
__________________________
Isabella Amali Research Scholar
Department of Computer and Information science
Annamalai University.
Dr. R. Arunkumar Assistant Professor
Department of Computer Science and Engineerin
Annamalai University.
It is constrained with some tunable features. The presence of training usually applies convex
quadratic optimizing method.
Therefore, solutions derived are global as well as unique in nature, which helps to eliminate the convergence to local minimum executed with alternate statistical learning methods like Neural Networks (NN).
1) Principles of Linear SVMs: As provided a p-dimension training database of size N as
{( ) { }}
where represents either or 1 that refers to class 1or 2. Every is considered to be -dimension vector. The highest-margin hyperplane that separates class 1 from class 2 is the exact SVM required. By assuming that hyperplane could be expressed as
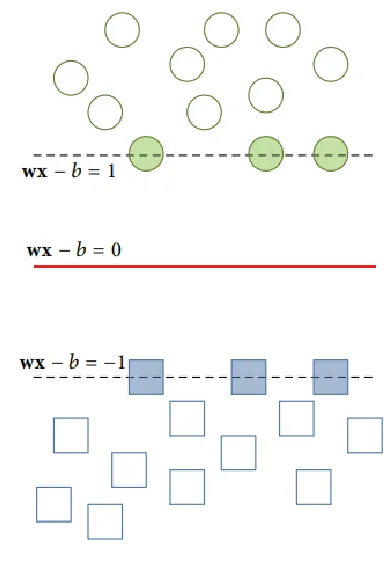
where is a dot product and indicates a normal vector to hyperplane. The basic intention is to select as well as to increase the margin among 2 parallel vectors as illustrated in Fig. 1 and hyperplanes as higher at the time of segregating data. Thus, 2 parallel hyperplanes are defined in the form of equations as
Thus, the process can be converted into optimization issue. In addition, the distance among 2 parallel hyperplanes has to be improved, and objective to inhibit data falling to the margin. By applying elegant mathematical data, the issues is generalized in the form of
‖ ‖
( )
Practically, the ‖ ‖ is often substituted using,
‖ ‖
( )
The cause for above process is based on factor of ‖ ‖
which has the square root estimation. Once the Eq. (5) is superseded, then solution remains unchanged, however the problem has been modified as quadratic programming optimizing model which is simple to resolve under the application of Lagrange multipliers as well as reputed quadratic programming (QP) methodologies and process.
Fig. 1. The concept of parallel hyperplanes
2) Soft Margin: In practical domains, it has lack of hyperplane which splits the sample in an accurate manner. At this point, the ―soft margin‖ model might select a hyperplane which tends to divide the provided samples in the form of clean and reliable data, where the distance to adjacent split instance to be improved.
The positive slack parameters have been proposed for calculating the misclassified degree of sample in such a way that distance among margin as well as vectors lies on wrong side of a margin. Later, an optimized hyperplane dividing the data which is derived from the given optimizing issue:
‖ ‖ ∑
{ ( )
where denotes the error cost. Thus, optimization is changed as a trade-off from higher margin as well as small error penalty. The optimization issues are resolved with the help of ―Lagrange multiplier‖ by
{ ‖ ‖ ∑
∑
[ ( ) ] ∑
}
The min-max problem cannot be resolved simply, this dual form method to resolve the desired issue.
3) Dual Form: The dual form of Eq. (6) could be presented in the form of
∑
∑
∑
( )
{
∑
It is constrained with major benefits of dual form function which is the slack variables disappear from dual issue, along with a constant that appears in the form of extra condition of Lagrange multipliers. Then, optimization issue (8) modifies into a QP problem that has been described as optimizing of a quadratic notation of various parameters that relies on linear constraints of variables. Thus, massive techniques are capable of resolving Eq. (9) in a due course of time and even in milliseconds, as same as interior point model, active set technology, augmented Lagrangian approach, conjugate gradient framework, simplex technique, etc.
B. PSO-KSVM
1) Kernel SVMs: The linear SVMs has the problem towards linear hyperplane that is not capable of dividing complex distributed practical information. To normalize in the form of non-linear hyperplane, kernel is used for SVMs. Hence, the resultant technique is same as existing methods, but not all dot products are substituted using nonlinear kernel notation. From the other approach, KSVMs enables to set the highest-margin hyperplane from a converted feature space. Also, the conversions might be in the form of nonlinear, and transferred space are comprised with maximum dimensional; which is done even the classification model is a hyperplane from higher-dimensional feature space, and it is a non-linear in actual input space. For every kernel, it must be composed with a least adoptable feature that tends to form reliable kernel as well as to remodel in the form of practical information. In this study, RBF kernel has been selected as it has best performance. Therefore, the kernel can be defined as
( ) ( ‖ ‖
)
∑
∑
∑
( ‖ ‖
)
{
∑
They are still considered to be QP issue, so that interior point technique has been employed to resolve this issue. But, it is a standard problem where the measures of parameters as well as in (10).
2) PSO: In order to compute the optimal parameter from and few conventional techniques are employed with trial-and-error method. The main reason to apply this model is that, it causes higher overhead as well as not ensures to identify the near-optimal solutions. Hence, PSO is a developed global optimizing technique that is obtained from the study of progress of bird flocking or fish schooling. It is simple and easy technique to be applied. On the other hand, an alternate method is established as cross-validation to develop the fitness function employed to PSO.
PSO process a searching task by swarm of particles that is upgraded for each process. In order to obtain a best solution, all particles are migrated in the dimension of existing best position as well as best global position
for a swarm as given:
( )
[ ( )]
( )
[ ( )]
where is the particle index, implies the entire number of particles, represents a process index, whereas signifies present iteration value, and refers the location. Hence, the velocity as well as the particle location could be extended by using the given functions:
( )
( )
nmaed as ―acceleration coefficients.‖ The particle encoding is constrained with parameters and in (10).
3.
RESULT
ANALYSIS
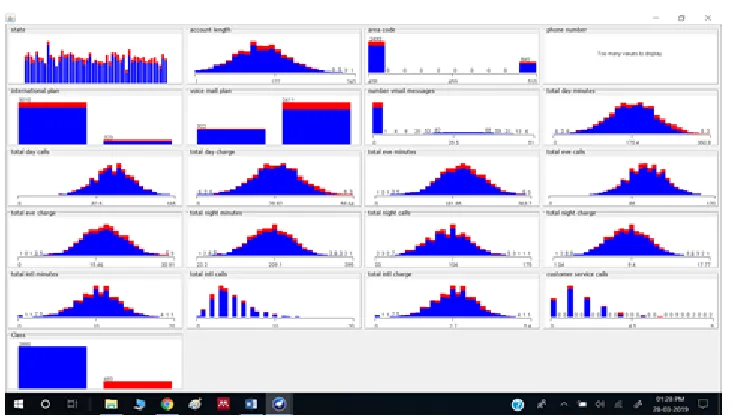
The results are validated using a dataset which comprises of a total of 3333 instances under the existence of 21 features. The overall of 14.49% of samples appears in the positive class and the remaining 85.51% of samples appears in negative class. The detail of the dataset is given in Table 1. Fig. 2 shows the frequency distribution of dataset for all attributes.
TABLE I
DATASET DESCRIPTION
Fig. 2. Frequency Distribution of Dataset 1 for all Attributes
TABLE II
CONFUSION MATRIX OF DIFFERENT METHODS FOR APPLIED DATASET
Experts
PSO-SVM RBF-SVM Linear-SVM Polynomial-SVM Sigmoid-SVM
NC C NC C NC C NC C NC C
NC 520 57 498 79 448 129 519 58 406 171
C 15 90 19 86 22 83 20 85 30 75
TABLE III
PERFORMANCE EVALUATION OF EXISTING WITH PROPOSED METHOD FOR APPLIED DATASET
Methods FPR FNR Sensitivity Specificity Accuracy F-Score Kappa
PSO-SVM 38.77 2.80 97.19 61.22 89.44 93.52 65.17
RBF-SVM 47.87 3.67 96.32 52.12 85.63 91.04 55.29
Linear-SVM 60.84 4.68 95.32 39.15 77.85 85.57 40.01
Polynomial-SVM 40.55 3.71 96.28 59.44 88.56 93.01 61.75
Sigmoid-SVM 69.51 6.88 93.11 30.48 70.52 80.15 26.97
Description Values
Instances count 3333
Features count 21
Class count 2
% of Positive instances 14.49% % of Negative instances 85.51%
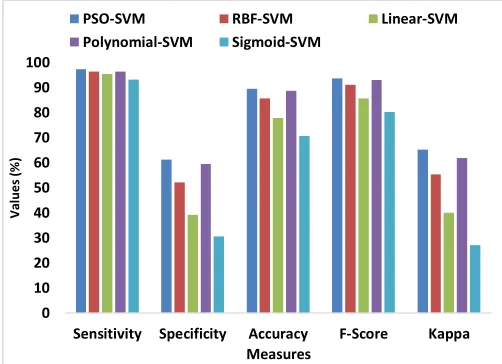
Table 2 depicts the confusion matrix attained by the presented PSO-KSVM model on the executed dataset. The table values indicated that the PSO-KSVM attains a total of 520 instances as non-churn and 90 instances as churn. The RBF-SVM method classified the overall of 498 samples as non-churn and 86 instances as churn. Then, linear model classified the overall of 448 samples as non-churn and 83 instances as non-churn. Afterwards, polynomial SVM model classified the overall of 519 instances as non-churn and 85 instances as non-churn. Subsequently, sigmoid SVM model classified the overall of 406 samples as non-churn and 75 instances as non-churn. Table 3 and Fig. 3 depict the outcomes attained by various models in several measures. The Sigmoid-SVM models offers minimal classifier outcome by attaining FPR, FNR, Sensitivity, Specificity, Accuracy, F-Score and Kappa values of 69.51, 6.88, 93.11, 30.48, 70.52, 80.15 and 26.97 respectively. Next, the linear SVM performs slightly better and attains a FPR, FNR, Sensitivity, Specificity, Accuracy, F-Score and Kappa values of 60.84, 4.68, 95.32, 39.15, 77.85, 85.57 and 40.01 respectively. Simultaneously, the RBF-SVM method depicts manageable outcomes by attaining FPR, FNR, Sensitivity, Specificity, Accuracy, F-Score and Kappa values of 47.87, 3.67, 96.32, 52.12, 85.63, 91.04 and 55.29 respectively. Then, the Polynomial-SVM model shows manageable results by attaining FPR, FNR, Sensitivity, Specificity, Accuracy, F-Score and Kappa values of 47.87, 3.67, 96.32, 52.12, 85.63, 91.04 and 55.29 respectively. But, the PSO-SVM offers effective outcome by attaining FPR, FNR, Sensitivity, Specificity, Accuracy, F-Score and Kappa values of 38.77, 2.80, 97.19, 61.22, 89.44, 93.52 and 65.17 respectively.
Fig. 3. Classifier results of diverse methods
4.
CONCLUSION
This paper has proposed a new CCP using hybridization of PSO-KSVM in telecommunication industry. Here, PSO technique is utilized for optimization variables of SVM namely C and . The validation of PSO-KSVM takes palce using a benchmark dataset. The results ensured the
outcome by attaining FPR, FNR, Sensitivity, Specificity, Accuracy, F-Score and Kappa values of 38.77, 2.80, 97.19, 61.22, 89.44, 93.52 and 65.17 respectively.
REFERENCES
[1] M. Shaw, C. Subramaniam, G. W. Tan, and M. E. Welge, ―Knowledge management and data mining for marketing,‖ Decision Support Systems, Vol. 31, no. 1, 2001, pp. 127-137.
[2] C. P. Wei and I. T. Chiu, ―Turning telecommunications call details to churn prediction: a data mining approach,‖ Expert Systems with Applications, Vol. 23, 2002, pp. 103-112.
[3] Xia, G.E. and Jin, W.D., 2008. Model of customer
churn prediction on support vector machine. Systems
Engineering-Theory & Practice, 28(1), pp.71-77. [4] J. H. Ahn, S. P. Han, and Y. S. Lee, ―Customer churn
analysis: Churn determinants and mediation effects of partial defection in the Korean mobile
telecommunications service industry,‖
Telecommunications Policy, Vol. 30, Issues 10–11, 2006, pp. 552-568.
[5] Zhao, Y., Li, B., Li, X., Liu, W. and Ren, S., 2005, July.
Customer churn prediction using improved one-class
support vector machine. In International Conference
on Advanced Data Mining and Applications (pp. 300-306). Springer, Berlin, Heidelberg.
[6] V. García, A. I. Marqués, and J. S. Sánchez, ―Non-parametric Statistical Analysis of Machine Learning Methods for Credit Scoring,‖ Advances in Intelligent Systems and Computing, Volume 171, 2012, pp. 263-272.
[7] Brandusoiu, I. and Toderean, G., 2013. Churn
prediction in the telecommunications sector using support vector machines. Margin, 1, p.x1.
[8] S. Chakrabarti, M. Ester, U. Fayyad, J. Gehrke, J. Han, S. Morishita, G. Piatetsky-Shapiro, and W. Wang, ―Data Mining Curriculum: A Proposal,‖ Version 1.0, 2006.
[9] F. Gorunescu, Data Mining Concepts, Models and Techniques, Springer-Verlag Berlin Heidelberg, 2011.
[10]Amin, A., Shehzad, S., Khan, C., Ali, I. and Anwar, S.,
2015. Churn prediction in telecommunication industry
using rough set approach. In New trends in
computational collective intelligence (pp. 83-95). Springer, Cham.
[11]http://www.sgi.com/tech/mlc/db/ (Last Access: November 30, 2017 02:00 PM).
0 10 20 30 40 50 60 70 80 90 100
Sensitivity Specificity Accuracy F-Score Kappa
V
al
u
e
s
(%
)
Measures