1701
Target Projection Pursuit Feature Selection
Quadratic Associative Classifier for Time Series
Big Data Prediction
A.Selvakumar, Dr.S.PrasathAbstract— Big data is a collection of data that are large in size and growing exponentially with respect to time. A time series is a sequence of monitored data over time. The various methods have been developed in the time series analysis. But the accurate prediction was not performed with minimum time. In order to improve the prediction accuracy with minimum time, an efficient Targeted Interactive Projection Pursuit Feature Selection based Quadratic Associative Data Classification (TIPPFS-QADC) technique is introduced. Initially, the TIPPFS-QADC technique collects a large volume of data from the big dataset. The TIPPFS-QADC technique comprises the two processes namely feature selection and classification. The TIPPFS-QADC technique uses Targeted Interactive Projection Pursuit for performing the feature selection in a time series database for reducing the prediction time and space complexity. Targeted Projection Pursuit is a statistical technique used to explore the space of projections through manipulating the Jaccard similarity between the features. After performing the feature selection, Quadratic Associative Data Classification is carried out to predict the future results of time series data. Quadratic Associative Classifier (QAC) is a supervised learning model that uses association rules to separate the two or more classes. Through performing the classification, the time series data prediction is carried out with superior accuracy and lesser time consumption. Experimental evaluation of proposed TIPPFS-QADC technique and existing methods are carried out using big dataset. The results observation clearly shows that the proposed TIPPFS-QADC technique obtains higher prediction accuracy and minimum false positive rate, prediction time and space complexity.
Index Terms—Time series big data, feature selection, Targeted Interactive Projection Pursuit, Jaccard similarity, Quadratic Associative classifier, association rules, space complexity.
—————————— ——————————
1 I
NTRODUCTION Big data is a field used to analyze and extract the information for future use. Time series analysis is a statistical technique that handles the time series data. Time series data describes that data is in a series of particular time periods. Tracking the behavior of particular data in time gives essential information. Classification is an essential data mining technique that allocates data objects in the collection to the target class. Different classification strategies were used by existing methods for performing the prediction. But, the prediction accuracy was not improved and time consumption was not reduced. In order to address these issues, associative classifier and ensemble classifiers are exploited in our research work for time series data prediction.A Distributed Fuzzy Associative classification based Fuzzy Frequent Pattern (DFAC-FFP) approach was introduced in [1] for big data analysis. But, the classifier interpretability was not improved by reducing space complexity.
A new Multivariate and Multi-Output Weighted Nearest Neighbor‘s (MV-kWNN) algorithm was introduced in [2] for predicting big time series data. But minimized prediction time was not minimized. A k-weighted nearest neighbors algorithm was developed in [3] for predicting big time series.
But, accurate forecasting was not performed.
The associative classification algorithms were introduced in [4] for improving the classification performance. But, classification time was not minimized. A Distributed FastShapelet Transform (DFST) was introduced in [5] for categorizing time series data. The space complexity remained unsolved.
A Dynamic Barycenter Averaging Kernel-based Radial basis function (RBF-DBAK) was developed in [6] for categorizing time series data. But, time was not minimized.
A deep belief echo-state network (DBEN) was developed in [7] for predicting the time series data. But, prediction time was not reduced. An ensemble classification models were developed in [8] for predicting big data time series. But, the performance of dynamic ensemble was not evaluated.
A Tropical cyclone forecasting using adaptive neuro-fuzzy inference system (CF-ANFIS) was developed in [9]. But, the complexity of the cyclone prediction was not minimized. A typicality-and-eccentricity-based method was developed in [10] for predicting the time series weather data. However, error rate in the time series weather data prediction was not reduced. The major issues are identified from the above-said literature such as less prediction accuracy, more weather prediction time, high prediction error rate, failure to select more relevant features and so on. Such kinds of major issues are overcome by introducing a novel technique called Targeted Interactive Projection Pursuit Feature Selection based Quadratic Associative Data Classification (TIPPFS-QADC). The major contributions of the TIPPFS-QADC technique ————————————————
A.Selvakumar, PhD Research Scholar Part-time, Department of Computer Science, Nandha Arts and Science College, Erode,Tamilnadu, India, PH-6383284989. [email protected]
1702 compared to existing are summarized asfollows,
To improve the prediction accuracy and minimize the false positive rate, TIPPFS-QADC technique exploits the combination of classification and association rule mining. The quadratic classifier performs the likelihood test between the mean of the classes and the data. Then the association rule mining is applied to measure the support and confidence value. If the support and confidence values are lower and greater than the maximum and minimum fixed expert-defined thresholds, then the TIPPFS-QADC correctly classifies the data into a particular class.
To minimize prediction time and space complexity, TIPPFS-QADC selects the relevant feature and removes the irrelevant features from the big dataset using Targeted Interactive Projection Pursuit statistical technique. The statistical technique uses the projection matrix to project similar features in the two-dimensional space. The similar features are identified using Jaccard similarity coefficient. Then the quadratic associative classifier categorizes the input data into two or more classes with the selected features.
The organization of the paper is described as follows: Section 2 describes the related works in the big time series data prediction. The brief description of TIPPFS-QADC technique is presented in Section 3. Section 4 provides the experimental evaluation with the big dataset. Experimental Results are discussed with various performance metrics in Section 5. Section 6 concludes the proposed work and followed by the references.
2
R
ELATEDW
ORKSAn ensemble of deep learning with LSTMs (Long Short Term Memory neural networks) was developed in [11] for forecasting time series data. But, more complex prediction was not performed. A Random Forest classifier was developed in [12] for time-series forecasting. But, accurate forecasting was not performed. A conceptual weather environmental forecasting system (CWEFS) was introduced in [13] to forecast cyclone. But, it failed to minimize the prediction error. A deep Fourier neural networks were developed in [14] for predicting time series data. But accurate prediction was not performed.
An online support vector algorithm (LaSVM) was designed in [15] for predicting air pollution with big data. But, performance and reliability of the prediction was not enhanced. A co-evolutionary multi-task learning approach was developed in [16] for forecasting dynamic time series data. The approach failed to perform the pattern classification. A Supervised Aggregative Feature Extraction (SAFE) technique was developed in [17] for nonlinear predictive with big data time series. But, time complexity was more in big data time series prediction. A novel hybrid clustering algorithm was developed in [18] for grouping time series data. But false positive rate was not reduced.
A Hidden Markov Models ensembles were developed in [19] for clustering and classification ofthe time series data
.
However, time complexity was not minimized. A modified cuckoo search algorithm was designed in [20] for predicting multistep time series prediction. But, prediction accuracy was not increased. The major issues from the above-said reviewsare overcome by introducing a novel technique called TIPPFS-QADC.
3 M
ETHODOLOGYThe time series big datasets comprise more data and it leads to ‗curse of dimensionality‘ and computational vulnerability. Therefore, dimensionality reduction plays a major role in big data analytics. The conventional techniques have been introduced for improving the prediction performance with time series big data. But these techniques failed to get efficient prediction results in a reasonable time as well as space complexity. Based on this motivation, TIPPFS-QADC technique is developed.
The major objective of the TIPPFS-QADC technique is to predict the time series data with higher accuracy and minimum time as well as space complexity. The TIPPFS-QADC technique comprises the two major processes namely feature selection and classification with the big time series data. The time series data is the sequence of well-defined data measured at regular time intervals over a period of time. In the feature selection, the relevant features from the big dataset are selected for predictive analysis. Targeted Interactive Projection Pursuit is a type of statistical technique used for selecting the relevant features from the big dataset. Feature selection is also called an attribute selection from the large dataset for minimizing the time and space complexity in the predictive analytics. Then the data classification is performed using Quadratic Associative classifier with the selected features for achieving superior prediction accuracy.
Figure 1 architecture diagram of the proposed TIPPFS-QADC technique
Figure 1 depicts an architecture diagram of TIPPFS-QADC technique comprises the feature selection and data classification. Initially, the number of features and data are collected from the big time series dataset. The big data
Time series big dataset
Collect number of features and data
Feature selection
Remove irrelevant features Select relevant features
Relevant features
Data Classification
Classify the data with the relevant features
1703 comprises more features and data. While performing the
classification, large feature and data create more complexity. Therefore, the TIPPFS-QADC technique selects the relevant features and removes the irrelevant features before the classification. This process minimizes the complexity in the prediction. In the second step, classification is carried out using quadratic classifier and association rule mining to categorize similar time series data for predicting future events.
3.1 Targeted Interactive Projection Pursuit based feature selection
The first process of TIPPFS-QADC technique is to select the relevant features from the large dataset. The TIPPFS-QADC technique uses Targeted Interactive Projection Pursuit for feature selection. Targeted Interactive Projection Pursuit is a type of statistical method used for feature selection and it allows the TIPPFS-QADC technique to interactively discover the relevant features from the multidimensional space. It also enables the users to discover the results in the two-dimensional views of high two-dimensional datasets.
The time series big dataset comprises a number of features in the multidimensional space. Targeted Interactive Projection Pursuit is a mapping of a set (i.e. features set) into a different subset (relevant or irrelevant) into two dimensional spaces.
Let us consider the ‗A‘ is a m * n matrix that describes ‗m‘ features of ‗n‘ dimensions, and ‗K‘ is a m * q matrix that describes a q dimensional target view of those features. Then the projection matrix ‗S‘ finds the similarity between the target (i.e. time series data prediction) and the features in the dataset. The jaccard similarity coefficient is used for measuring the similarity between target and features in the matrix ‗A‘.
(1)
From (1), ρ denotes a jaccard similarity coefficient, T represents target, fm denotes a features. T ∩ fm denotes a
mutual dependence between the target (i.e. time series data prediction) and feature. The jaccard similarity coefficient (ρ ) provides the similarity value between 0 and 1 (0 ≤ ρ ≤ 1). Based on the similarity value, the projection matrix projects the relevant features into the subset. The projection matrix also minimizes the size of the difference between the feature and the target when the similarity is higher. The projection matrix uses the steepest gradient descent to minimize the differences which is mathematically formulated as follows,
(2)
In (2) f(x) denotes a steepest gradient descent function, arg min stands for argument of the minimum. A‘ is a m*n matrix that describes ‗m‘ features of ‗n‘ dimensions, K is a m*q matrix that describes a q dimensional target view of those features, projection matrix ‗S‘. The above equation (2) is used to project the similar features into the two dimensional space. The less similarity features increases the difference between the target
and the projection of the feature. These features are called as an irrelevant features and it is removed from the dataset. The algorithmic process of the Targeted Interactive Projection Pursuit based feature selection is described as follows,
Input: Big time series dataset , number of features
Output: Select relevant features Begin
1. For each feature
2. Construct feature matrix , target matrix , projection matrix
3. Measure the correlation between the features and target ‗ ‘
4. if then
5. Features are said to be a relevant
6. Projection matrix project the high similarity features into two-dimensional space
7. Minimize the difference between the projection of the feature and the target
8. Select relevant features
9. else
10. Remove irrelevant features 11. End if
12. End for End
Algorithm 1 Targeted Interactive Projection Pursuit based feature selection
Algorithm 1 describes the features selection using Targeted Interactive Projection Pursuit. Initially, the numbers of features are collected from the big dataset. Then the correlations between the target and the features in the matrix are computed to find the high and low similarity features. The projection matrix project the high similarity features into two-dimensional spaces. The high similarity feature projection minimizes the difference between the projection of the feature and the target. Followed by, the high similarity features are selected for time series data prediction and the low similarity features are removed. The feature selection process in TIPPFS-QADC technique minimizes the prediction time as well as the space complexity.
3.2 Quadratic Associative Data Classification
1704 Figure 2 Flow process of Quadratic Associative Data Classification
Figure 2 illustrates the flow process of quadratic associative data classification for predicting the time series data. Let us consider the number of time series data taken from the big dataset . Initialize the number of classes
and their mean as well as deviation. Based on the initialization, the quadratic classifier computes the likelihood ratio test for each data and their mean value as follows,
(3)
In (3), represents the likelihood, represents deviation, denotes a mean of the class, represents the time series data. The likelihood expresses how the data is more similar to mean of the class. The likelihood function of the data and mean are calculated that the data categorized into a particular class. Then the quadratic classifier uses the association rule mining concept to accurately classify the data by generating the association rule based on their support and confidence threshold range values. Association rule mining is a method which is used to determine the correlations of the data and the mean value of the classes. Let us consider the association rules where Di denotes a time series data
and denotes an output class. The support is an indication of how the data is more related to that particular class mean value which is formulated as follows,
(4)
In (4), denotes a support value of an in dataset and mean of the class ,
‘ ’
denotes a number of classes. Based on the support value, the confidence is measured as follows,(5)
In (5), represents the confidence of how the is more related to the mean value of the particular class. Then the classification is done based on the support and confidence threshold ranges. If the classifier categories the time series data into different classes, the various threshold ranges are predefined. Given a set of data, the goal of association rule mining is to find all rules having the estimated support and confidence is greater than the minimum and maximum threshold which is expressed as follows.
(6)
In (6), denotes an output of the quadratic associative classifier, and denotes a minimum and maximum threshold range of the support value. and are the minimum and maximum threshold range of the confidence value. If the support value of data and mean within the minimum and maximum threshold range of the class, then the data is categorized into a particular class. In this way, the quadratic associative classifier categorizes the time series data into two or more classes that have support and confidence threshold ranges. Accordingly, all the time series data are correctly classified into different classes with higher accuracy. Based on the classification results, the accurate prediction is performed with minimum time. The algorithmic process of the quadratic associative classifier is describes as follows.
Input: Big time series dataset , number of data Output: Increase the prediction accuracy
Begin
1. Initialize the output classes
2. Initialize the mean value of classes
3. For each data
4. Measure the likelihood ratio‘ 5. For each mean value of classes
6. Measure support value
7. Measure confidence value
If (
then
8. Classify the data into a particular class 9. End if
10. End for 11. End for
End
Algorithm 2 Quadratic Associative Data Classification
Algorithm 2 describes the quadratic associative data classification for increasing the prediction accuracy with minimum time. The quadratic associative classifier initially defines the number of classes and means values. Then the likelihood between the mean and data is measured for classifying the data into that particular class. By applying the association rule mining, the support value Collect number of data with selected
features
Measure the likelihood ratio for each data and classes Define mean value of each class
Compute support and confidence measure
1705 and confidence value of the data and mean value is computed. If
the estimated support and confidence are better than the minimum threshold range, then the data is classified into that particular class. In this way, the time series data are correctly classified into the different classes. The classified results are used to predict the time series data with higher accuracy and minimum false positive rate.
4 E
XPERIMENTALS
ETTINGSAn experimental evaluation of TIPPFS-QADC technique and existing DFAC-FFP [1], MV-kWNN[2] are implemented using Java language. For the experimental consideration, Hurricanes and Typhoons, 1851-2014 dataset is taken from the https://www.kaggle.com/noaa/hurricane-database for predicting the cyclone through the classification. The National Hurricane Center includes a data on tropical cyclones that occurred within the Atlantic Ocean and Eastern Pacific Ocean. The dataset comprises the 22 attributes for both Atlantic Ocean and Eastern Pacific Ocean such as ID, Name, Date, Time, Event, Status, Latitude, Longitude, Maximum Wind, Minimum Pressure, Low Wind NE, Low Wind SE, Low Wind SW, Low Wind NW, Moderate Wind NE, Moderate Wind SE, Moderate Wind SW, Moderate Wind NW,High Wind NE, High Wind SE, High Wind SW, High Wind NW.
The database consists of 49,105 instances for the Atlantic Ocean and 26,138 instances for the eastern Pacific Ocean. For the experimental consideration, the tropical cyclones occurred in the Atlantic Ocean is considered for performing the experimental evaluation with time series big data. The numbers of time series data are taken from the 1000-10000 for the experiential evaluation. Performance analysis of TIPPFS-QADC technique and existing methods namely DFAC-FFP [1], MV-kWNN[2] are carried out with certain parameters such as prediction accuracy, false positive rate, prediction time and space complexity.
5 P
ERFORMANCER
ESULTSA
NDD
ISCUSSIONThe experimental results of TIPPFS-QADC technique and existing methods namely DFAC-FFP [1], MV-kWNN[2] are discussed in this section with different performance metrics such as prediction accuracy, false positive rate, prediction time and space complexity. The performance results of proposed and existing methods are discussed with table and graphical representation.
5.1 Performance Results of Prediction Accuracy
Prediction accuracy is the ratio of a number of similar weather data are correctly classified into the different classes to the total number of data. It is given by,
(7) From (7),PA represents the prediction accuracy, ‗n‘ denotes a number of data. The prediction accuracy is measured in percentage (%).
TABLE 1 PREDICTION ACCURACY VERSUS THE NUMBER OF DATA
Number of data
Prediction accuracy (%) TIPPFS-QADC
DFAC-FFP
MV-kWNN
1000 94 84 89
2000 93 83 88
3000 92 82 87
4000 89 78 84
5000 88. 77 83
6000 87 76 82
7000 86 75 80
8000 85 73 78
9000 84 72 77
10000 83 71 76
Table 1 reports the experimental results of cyclone prediction accuracy in the Atlantic Ocean versus a number of weather data points collected from the cyclone database. Totally ten different results are obtained for different input data taken from 1000 to 10000. The prediction accuracy is computed with the three different methods TIPPFS-QADC technique, DFAC-FFP[1] and MV-kWNN [2]. The comparison of ten different results clearly shows that the TIPPFS-QADC technique significantly increases the cyclone prediction accuracy by 14% and 7% when compared to DFAC-FFP[1] and MV-kWNN [2] respectively.
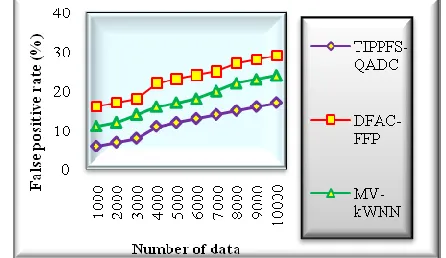
5.2 Performance Results of False Positive Rates The false positive rate is the ratio of a number of weather data are incorrectly classified into the different classes to the total number of data for predicting the cyclone in the Atlantic Ocean. It is given by,
(8)
From (8),FPR represents the false positive rate, ‗n‘ denotes a number of data.
1706 particular class only if the estimated support values within the
minimum and maximum threshold ranges. Otherwise, the data is checked with the other classes mean value. Based on the support and confidence estimation of the mean and data, the data are accurately categorized into particular class. Based on the classification results, the cyclone prediction is performed with less FPR.
The observed results confirm that the performance of the false positive rate is minimized by 49% and 34% using TIPPFS-QADC technique when compared to the DFAC-FFP[1] and MV-kWNN [2] respectively.
5.3 Performance Analysis of Prediction Time
Prediction time is the amount of time required to predict the cyclone through the classification. It is given by,
(9) From (9), PT represents the prediction time, ‗n‘‘ denotes a number of data
.
TABLE 3PREDICTION TIME VERSUS NUMBER OF DATA
Number of data
Prediction time (ms)
TIPPFS-QADC
DFAC-FFP MV-kWNN
1000 28 37 32
2000 32 40 36
3000 35 45 39
4000 36 48 44
5000 40 50 45
6000 42 54 48
7000 48 57 53
8000 52 61 56
9000 56 65 61
10000 60 70 65
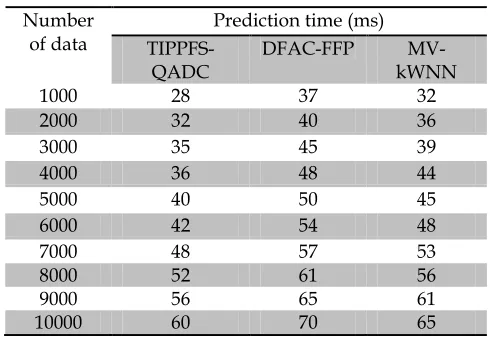
The cyclone prediction time using three methods with respect to a number of big weather data are reported in Table 3. The table values show that the TIPPFS-QADC technique consumes minimum time for predicting the cyclone in the Atlantic ocean when compared to DFAC-FFP[1] and MV-kWNN [2].
The comparison results show that the PT is considerably minimized using TIPPFS-QADC technique by 19% and 11% when compared to DFAC-FFP [1] and MV-kWNN [2].
5.4 Performance Analysis of Space Complexity
Space complexity is the amount of storage space required to predict the cyclone through the classification algorithm. It is given by,
(10) From (10), SC represents the space complexity, n‘ denotes a number of data.
Figure 6 performance results of space complexity versus number of data Figure 6 shows the performance results of the SC of big data using three methods TIPPFS-QADC technique, DFAC-FFP [1] and MV-kWNN [2]. As shown in the above graphical results, the proposed TIPPFS-QADC technique minimizes the SC for big data processing while compared to other existing classification algorithms. This is because, the TIPPFS-QADC technique performs the dimensionality reduction to minimize the SC. The dimensionality of data is minimized by selecting the more suitable features and their data through the target iterative projection pursuit statistical technique. The quadratic classification algorithm only uses the selected features and their data instead of using all the features data. The feature selection process of TIPPFS-QADC technique minimizes the SC. The compassion of ten different performance results shows that the SC using TIPPFS-QADC technique is considerably minimized by 19% and 10% when compared to the state-of-the-art methods. The above discussion clearly proves that the proposed TIPPFS-QADC technique significantly improves the cyclone prediction accuracy with minimum time and SC.
6 C
ONCLUSION1707
R
EFERENCES[1] Armando Segatori, Alessio Bechini, Pietro Ducange and Francesco Marcelloni, ―A Distributed Fuzzy Associative Classifier for Big Data‖, IEEE Transactions on Cybernetics, Volume 48, Issue 9, 2018, Pages 2656 – 2669
[2] R.Talavera-Llames, R.Pérez-Chacón, A.Troncoso, F.Martínez-Álvarez, ―MV-kWNN: A novel multivariate and multi-output weighted nearest neighbours algorithm for big data time series forecasting‖, Neurocomputing, Elsevier, 2019, Pages 1-40 [3] A.Galicia, J.F.Torres, F.Martínez-Álvarez, A.Troncoso, ―A novel
spark-based multi-step forecasting algorithm for big data time series‖, Information Sciences, Elsevier, Volume 467, 2018, Pages 800-818
[4] Francisco Padillo, Jose Maria Luna and Sebastian Ventura, ―Evaluating associative classification algorithms for Big Data‖, Big Data Analytics, Springer, Volume 4, Issue 2, 2019, Pages 1-27 [5] Francisco J. Baldan and Jose M. Benıtez, ―Distributed FastShapelet Transform: a Big Data time series classification algorithm‖, Information Sciences, Elsevier, 2018, Pages 1-22 [6] Kejian Shi , Hongyang Qin , Chijun Sima , Sen Li , Lifeng Shen,
Qianli Ma, ―Dynamic Barycenter Averaging Kernel in RBF Networks for Time Series Classification‖, IEEE Access, Volume 7, Pages 47564 – 47576
[7] Xiaochuan Sun, Tao Li, Qun Li , Yue Huang , Yingqi Li, ―Deep belief echo-state network and its application to time series prediction‖, Knowledge-Based Systems, Elsevier, Volume 130 , 2017, Pages 17–29
[8] A. Galicia, R. Talavera-Llames, A. Troncoso, I. Koprinska, F. Martinez-Alvarez, ―Multi-step forecasting for big data time series based on ensemble learning‖, Knowledge-Based Systems, Elsevier, Volume 163, 2019, Pages 830–841
[9] Trong Hai Duong, Phi Hung Do, Sy Dzung Nguyen, Minh Hien Hoang, ―ENSO-based tropical cyclone forecasting using CF-ANFIS‖, Vietnam Journal of Computer Science, Springer, Volume 3, Issue 2, 2016, Pages 81–91
[10]Eduardo Soares, Pyramo Costa Jr, Bruno Costa and Daniel Leite, ―Ensemble of evolving data clouds and fuzzy models for weather time series prediction‖, Applied Soft Computing, Elsevier, Volume 64, 2018, Pages 445-453
[11] Jie Chen, Guo-Qiang Zeng, Wuneng Zhou, Wei Du, Kang-Di Lu, ―Wind speed forecasting using nonlinear-learning ensemble of deep learning time series prediction and extremal optimization‖, Energy Conversion and Management, Elsevier, Volume 165, 2018, Pages 681–695
[12] Jun-He Yang, Ching-Hsue Cheng, and Chia-Pan Chan, ―A Time-Series Water Level Forecasting Model Based on Imputation and Variable Selection Method‖, Computational Intelligence and Neuroscience, Hindawi , Volume 2017, November 2017, Pages 1-11
[13] Chih-Chiang Wei, ―Conceptual weather environmental forecasting system for identifying potential failure of under-construction structures during typhoons‖, Journal of Wind Engineering & Industrial Aerodynamics, Elsevier, Volume 168, 2017, Pages 48–59
[14]Michael S.Gashler and Stephen C.Ashmore, ―Modeling time series data with deep Fourier neural networks‖, Neurocomputing, Elsevier, Volume 188, 2016, Pages 3-11 [15]Z. Ghaemi , A. Alimohammadi , M. Farnaghi, ―LaSVM-based
big data learning system for dynamic prediction of air pollution in Tehran‖, Environmental Monitoring and Assessment, Springer, Volume 190, Issue 300, 2018, Pages 1-17
[16]Rohitash Chandra, Yew-Soon Ong, Chi-Keong Gohc, ―Co-evolutionary multi-task learning for dynamic time series prediction‖, Applied Soft Computing, Elsevier, Volume 70, 2018, Pages 576-589
[17] Gian Antonio Susto, Andrea Schirru , Simone Pampuri, Seán McLoone, ―Supervised Aggregative Feature Extraction for Big Data Time Series Regression‖, IEEE Transactions on Industrial Informatics , Volume 12 , Issue 3 , 2016, Pages 1243 - 1252 [18] Saeed Aghabozorgi, Teh Ying Wah, Tutut Herawan, Hamid A.
Jalab, Mohammad Amin Shaygan, and Alireza Jalali, ―A Hybrid Algorithm for Clustering of Time Series Data Based on Affinity Search Technique‖, The Scientific World Journal, Hindawi Publishing Corporation, Volume 2014, March 2014, Pages 1-12 [19] Nazanin Asadi , Abdolreza Mirzaei , Ehsan Haghshenas,
―Creating Discriminative Models for Time Series Classification and Clustering by HMM Ensembles‖, IEEE Transactions on Cybernetics , Volume 46 , Issue 12 , 2016 , Pages 2899 – 2910 [20]Pauline Ong and Zarita Zainuddin, ―Optimizing wavelet neural