DISTRIBUTION CHANNELS SELECTION USING PCA-DEA
APPROACH
Milan Andrejić1, Milorad Kilibarda2
1, 2 University of Belgrade, Faculty of Transport and Traffic Engineering, Vojvode Stepe 305, 11000,
Belgrade, Serbia
Received 17 November 2014; accepted 18 January 2015
Abstract: Strategic decision making is very important in logistics.One of the most important strategic decisions in logistics is the selection of distribution channels. This paper proposes the efficiency of distribution channels as one of the main selection criteria. The efficiency of distribution channels simultaneously affects logistics costs and customer satisfaction. Based on the main characteristics of the distribution channels, such as delivery time, service level, volume of business, the level of errors and the different cost categories in this paper the PCA-DEA approach for measuring the efficiency and selection of certain types of distribution channels is proposed. Model is tested on the numerical example. Results show the great capability of the proposed model.
Keywords:distribution channels, efficiency, principal component analysis, data envelopment analysis.
1 Corresponding author: [email protected]
1. Introduction
In order to survive in the market, meet customer demands and reduce cost logistics companies need to make appropriate strategic decisions. Strategic decisions are recognized in literature and practice. According Wanke and Zinn (2003) the most important logistics decisions are: centralized or decentralized inventories and push or pull strategy. Mentioned decisions influence the level of service provided to the customers and the total logistics costs. Pedersen et al. (2012) emphasize the decision of centralized and decentralized warehousing. Mentioned decisions affects the accuracy of delivery, delivery time, warehouse costs, transportation costs, service levels, number of employees, equipment, inventory levels, etc.
In this paper, it is assumed that one of the most important decisions is the distribution channels selection. This decision incorporates some of mentioned decisions (centralized or decentralized inventory, push or pull strategy, etc.). Distribution channels are characterized by different indicators. The selection depends on used indicator. One of the indicators that best describe the functioning of logistics systems is the efficiency (Andrejić et al., 2013). In that sense, in this paper the efficiency of distribution channels is set up as the main selection criteria. The basic advantage of this indicator is that it combines a number of other indicators. The efficiency is also the prerequisite to reduce costs and increase the quality of services provided.
describes basic characteristics of distribution channels. Model for measuring efficiency of distribution channels is proposed in fourth section. Model is tested on numerical example. Concluding remarks and directions of future research are given in the last section.
2. Types of Distribution Channels
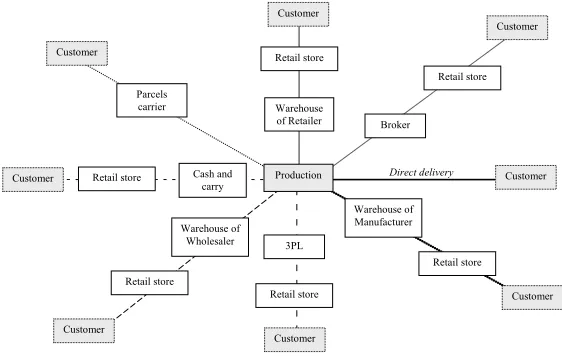
There are different distribution channels classifications in literature. Depending on the number of participants and the structure there are several types of distribution channels (Fig. 1). Channels in which the manufacturer is in direct contact with the users and where the products are delivered directly from the manufacturer to the customer are called direct channel of distribution (Fernie and Sparks, 2009). In this type of distribution wholesalers and distribution centers are not present. These channels are the shortest and simplest forms of product distribution. Production is the most frequently based on the order
that the customer may turn out in many different ways. There are different types of direct channel of distribution. Ordering product from catalog by e-mail is one of the basic channels. Distribution activities are realized by logistics companies specialized in the delivery of smaller shipments and courier services without the presence of retail stores. In some cases distribution is realized by manufacturer. For specific groups of products that are tailored to the special requirements of the user and which are not held in stock direct delivery from the manufacturer to the end consumer is made. These channels are usually used for smaller but more frequent deliveries. Internet and shopping from home are the most common. This type of buying is very similar to ordering products via e-mail, but not the same. Internet and shopping from home expanded to all commercial products. The last form of direct channels refers to manufacturer - manufacturer (“business to business – B2B”) channels. They are used for industrial products.
Production Warehouse of Retailer Retail store
Retail store Customer
Broker
Customer
Retail store Warehouse of
Manufacturer
Customer Retail store
3PL
Retail store Warehouse of
Wholesaler
Customer
Customer Cash and carry
Customer Retail store
Parcels carrier Customer
Direct delivery Customer
Fig. 1.
Manufacturer – manufacturer’s distribution
network – retail store is the next form of
distribution. In the past this channel is used as classic physical distribution channels and was the most common channel for many years. The manufacturer holds its products in warehouse of finished goods, central distribution centre or several regional distribution centers. The products are transported in large vehicles to the sites, where they are stored and then broken down into individual orders that are delivered to retail stores in the supplier’s retail delivery vehicles. All of the logistics resources are owned by the manufacture. This type of channel is still commonly used by the brewing industry.
Manufacturer – retailer’s distribution
network – retail store gaining importance
in 1980s. In these channels, manufacturers delivered the goods to the regional or the national distribution centers, which are owned by retailers. Distribution of products from these centers to the retail stores is realized by retailer’s network. Deliveries are made with large vehicles and high percent of space utilization. The main problem that accompanies these channels is the inability of realized core activity and the relative incompetence of trading companies to perform logistics processes and activities.
The basic characteristic of manufacturer
– wholesaler – retail store channels is
the dominant role of wholesalers as intermediaries between manufacturers and retailers. From the standpoint of physical distribution channel logistics activities are carried out through a distribution network of wholesalers. Wholesaler realized profit by purchasing large quantities of the product from the manufacturer at a relatively low price and selling to the retail stores with
adequate margin. These channels with certain modifications are present in the market today.
With the introduction of outsourcing in retail chains leads to the appearance of the channel forms manufacturer – LSP – retail. Logistics providers directly affect the costs of distribution reduction. On the other hand, the logistics service providers can respond to more restrictive distribution legislation. At the present time there is appearance of logistics providers specialized in the distribution of certain types of products in order to reduce distribution costs and adapt precisely defined demands.
Distribution channels manufacturer –
broker – retail are nowadays relatively rarely
used. These channels are related more to the commercial channels, and less on the physical distribution channels. Unlike wholesalers, brokers are more concerned with marketing activities, and less logistics processes and activities.
3. Characteristics of Distribution
Channels
intermediaries, whose role is limited to the transport function. In this sense the direct distribution channel with specialized logistics service providers as carriers of all logistics functions in channels is defined. Outsourcing in direct distribution channels is present with retail outlets (Fig. 1). However, the emergence direct distribution channels with specialized logistics provider are in phase of development. This section in more detail analyzed the aforementioned six distribution channels.
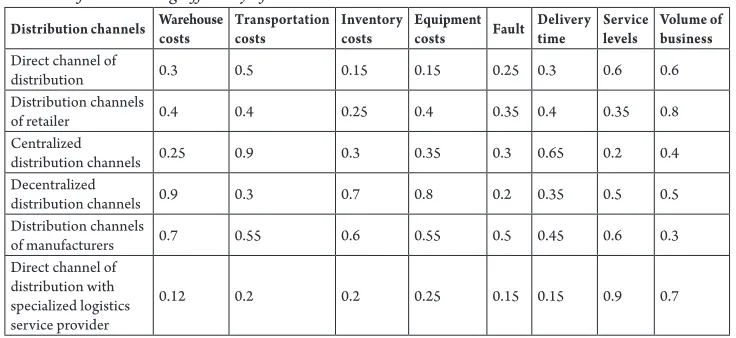
Distribution channels are characterized by different parameters. For the purpose of
their comparison it is necessary to define a set of common parameters. Based on the parameters used in the literature (Pedersen et al., 2012; Wanke and Zinn, 2004) and in the practice a set of eight common indicators is defined: warehouse costs, transportation costs, inventory costs, equipment costs, service levels, delivery time, the degree of fault and the volume of business. Values for each indicator for six distribution channels are shown in Table 1. Values represent the assessment for each channel according mentioned criteria. In this paper, the assumed values are used as an example to test the proposed methodology.
Table 1
Indicators for Measuring Efficiency of Distribution Channels*
Distribution channels Warehouse costs Transportation costs Inventory costs Equipment costs Fault Delivery time Service levels Volume of business Direct channel of
distribution 0.3 0.5 0.15 0.15 0.25 0.3 0.6 0.6
Distribution channels
of retailer 0.4 0.4 0.25 0.4 0.35 0.4 0.35 0.8
Centralized
distribution channels 0.25 0.9 0.3 0.35 0.3 0.65 0.2 0.4
Decentralized
distribution channels 0.9 0.3 0.7 0.8 0.2 0.35 0.5 0.5
Distribution channels
of manufacturers 0.7 0.55 0.6 0.55 0.5 0.45 0.6 0.3
Direct channel of distribution with specialized logistics service provider
0.12 0.2 0.2 0.25 0.15 0.15 0.9 0.7
*values in table represents scores for each channel according each indicators (parameters) on 0-1 scale
A set of cost indicators include four basic categories of logistics costs. Warehouse costs, transportation costs, inventory costs and equipment costs vary depending on the type of distribution channel and are highly relevant to their operating. The delivery time is one of the key indicators of distribution channels. One of the common objectives of all participants in the distribution channel is to minimize delivery time. The degree of
The last indicator is the volume of business that certain categories of distribution channels can realized.
4. Distribution Channels Selection
As mentioned before the DEA method is one the most frequently used method for efficiency evaluation. In the DEA literature there are recommendations about relation between number of DMUs (Decision Making
Units) and number of variables. The PCA is
data reduction technique of multivariate data. The PCA explains the variance structure of a matrix of data through linear combinations of variables, consequently reducing the data to a few principal components (PCs), which generally describe 80-90% of the variance in the data (Sharma, 1996). If most of the population variance can be attributed to the first few components (dummy variables), then they can replace the original variables with minimum loss of information (Adler and Golany, 2001 and 2002). The PCA improves discrimination of the DEA models.
According to Hair et al. (1995), a random vector X=[X1, X2,…, Xp] (the p is the number
of original inputs/outputs chosen to be aggregated) has the correlation matrix C with eigenvalues λ1≥λ2≥…≥λp≥0 and normalized
eigenvectors l1,l2,…,lp. Consider the linear
combinations, where the superscript t
represents the transpose operator: (1) (2) (3) The PCs are the uncorrelated linear combinations ranked by their variances in a descending order. Adler and Golany (2002) set additional constraints that require the
weight of PC1to be at least that of PC2, the
weight of PC2 to be at least that of PC3 and so
on. The PCA – DEA model for DMUa used
in this paper has the following form (Adler and Yazhemsky, 2010):
(4)
Subject to:
(5)
(6)
(7)
(8) (9)
(10)
(11)
VPC and UPC represents vector of weights assigned to inputs and outputs PCs, XPC and
YPC represent the input and output matrix, while LXand LYrelate to the matrix of the PCA linear coefficients of input and output data.
largely dependent on the storage processes operating. The results correspond to the findings in the practice.
As mentioned before, two principal components are also extracted in the group of output indicators. They explain more than 85% of total variance. The first component explains 63% with the largest influence of service level and delivery time. This is consistent with findings in the literature where it is stated that the quality of service is one of the basic prerequisite of efficiency (Andrejić et al., 2013). The second component explains more than 22% where the dominant indicator is volume of business.
Table 2
The Importance of Individual Factors to Efficiency of Distribution Channels
Input indicators PC1 PC2
Warehouse costs 0.132 0.976 Transportation costs 0.986 0.023 Inventory costs -0.065 0.984 Equipment costs 0.984 0.041
Output indicators PC1 PC1
Fault -0.228 -0.251
Delivery time 0.984 0.003
Service levels 0.830 0.422
Volume of business 0.123 0.963
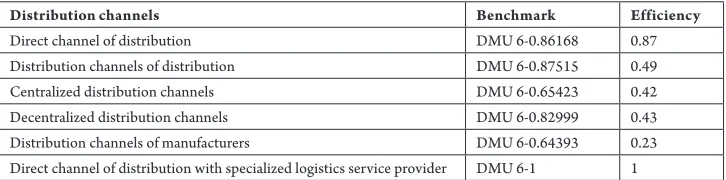
As mentioned before the second phase uses the values from the first phase for assessing efficiency of distribution channels. According results in Table 3 it easy to see that the most efficient channel is direct channel of distribution with specialized logistics service provider as the creator of the entire chain and executor of all processes and activities (from order to delivery, if necessary, they also have retail function - special retail stores). This type involves close cooperation and collaboration of manufacturers, providers and customers.
Collaboration is rather manifested in the unique information system and information sharing. Closely specialized service providers for the distribution of certain product groups (one or more manufacturers) have the ability to plan and coordinate the capacity, resources, processes and activities in accordance with the requirements of users in the market.
In this way, they can minimize transportation cost, warehouse cost, equipment cost and supplies, with a minimum degree of faults.
Table 3
Efficiency of Distribution Channels
Distribution channels Benchmark Efficiency
Direct channel of distribution DMU 6-0.86168 0.87
Distribution channels of distribution DMU 6-0.87515 0.49
Centralized distribution channels DMU 6-0.65423 0.42
Decentralized distribution channels DMU 6-0.82999 0.43
Distribution channels of manufacturers DMU 6-0.64393 0.23
Direct channel of distribution with specialized logistics service provider DMU 6-1 1
Based on the results obtained for the given example, it is clear that the distribution network of the manufacturer has a minimum efficiency. This can be explained by the high cost, relatively low service level, long
logistics service providers. Efficiency of retailer’s distribution channel and traditional centralized and decentralized channels of distribution is relatively similar and correspond with results in the literature (Pedersen et al., 2012).
5. Conclusions
Distribution channels selection is one of the most important strategic decisions in logistics. Efficiency of distribution channels is an essential prerequisite for a successful operating of company. This is result of cost reduction and increasing in customer satisfaction. This paper proposes new approach based on the PCA – DEA approach for measuring efficiency as basic selection criteria. Proposed approach integrate warehouse costs, transportation costs, inventory costs, equipment costs, service levels, delivery time, the degree of fault and the volume of business in the single efficiency measure.
Model is tested on the assumed numerical example. The results show a remarkable importance of delivery time and service level on the resulting efficiency. The most efficient channel is direct channel of distribution with specialized logistics service provider. Obtained efficiencies are the results of the observed numerical examples and cannot be fully generalized.
The proposed approach, with appropriate corrections, can be applied for efficiency evaluation of other logistics systems and supply chains. Future research should examine in more detail the basic processes in the distribution channels and make evaluation. It is also necessary to include appropriate indicators of individual
processes with special emphasis on quality indicators. In future research, it is also possible to combine the proposed model with other methods of multi-criteria decision making.
Acknowledgements
This paper was supported by the Ministry of Education, Science and Technological Development of the Republic of Serbia, through the project TR 36006, for the period 2011-2014.
References
Adler, N.; Golany, B. 2001. Evaluation of deregulated airline networks using data envelopment analysis combined with principal component analysis with an application to Western Europe, European Journal of Operational Research, 132: 260-273.
Adler, N.; Golany, B. 2002. Including principal component weights to improve discrimination in data envelopment analysis, Journal of Operations Research Society of Japan, 46: 66-73.
Adler, N.; Yazhemsky, E. 2010. Improving discrimination in Data Envelopment Analysis: PCA-DEA or Variable Reduction, European Journal of Operational Research. DOI: http://dx.doi.org/10.1016/j.ejor.2009.03.050, 202(1): 273-284.
Andrejić, M.; Bojović, N.; Kilibarda, M. 2013. Benchmarking distribution centers using Principal Component Analysis and Data Envelopment Analysis: a case study of Serbia, Expert Systems with applications.
DOI:http://dx.doi.org/10.1016/j.eswa.2012.12.085, 40(10): 3926-3933.
Hair, J.F.; Anderson, R.E.; Tatham, R.L.; Black, W.C. 1995. Multivariate data analysis. Englewood Cliffs, NJ: Prentice Hall.
Pedersen, S.G.; Zachariassen, F.; Arlbjorn, S.J. 2012. Centralization vs. de-centralization of warehousing: a small and medium-sized enterprise perspective,
Journal of Small Business and Enterprise Development. DOI: http://dx.doi.org/10.1108/14626001211223946, 19(2): 352-369.
Rushton , A.; Croucher, P.; Baker, P. 2006. The handbook of logistics and distribution management. 3rd edition, Kogan page, London and Philadelphia.
Sharma, S. 1996. Applied Multivariate Techniques. John Wiley & Sons, Inc, New York.