OncoTargets and Therapy
Dove
press
O r i g i n a l r e s e a r c h
open access to scientific and medical research
Open access Full Text article
Modulation of expression of the nuclear receptor
nr0B2 (small heterodimer partner 1) and its
impact on proliferation of renal carcinoma cells
Katharina Prestin1,*
Maria Olbert2,*
Janine hussner1
Tamara l isenegger1
Daniel g gliesche1
Kerstin Böttcher2
Uwe Zimmermann3
henriette e Meyer zu schwabedissen1
1Department of Pharmaceutical
sciences, Biopharmacy, University of Basel, Basel, switzerland;
2center of Drug absorption and
Transport, institute of Pharmacology,
3Department of Urology,
University Medicine greifswald, greifswald, germany
*These authors contributed equally to this work
Abstract: Mammalian nuclear receptors (NRs) are transcription factors regulating the expres‑ sion of target genes that play an important role in drug metabolism, transport, and cellular signaling pathways. The orphan and structurally unique receptor small heterodimer partner 1 (syn NR0B2) is not only known for its modulation of drug response, but has also been reported to be involved in hepatocellular carcinogenesis. Indeed, previous studies show that NR0B2 is downregulated in human hepatocellular carcinoma, suggesting that NR0B2 acts as a tumor suppressor via inhibition of cellular growth and activation of apoptosis in this tumor entity. The aim of our study was to elucidate whether NR0B2 may also play a role in other tumor entities. Comparing NR0B2 expression in renal cell carcinoma and adjacent nonmalignant transformed tissue revealed significant downregulation in vivo. Additionally, the impact of heterologous expression of NR0B2 on cell cycle progression and proliferation in cells of renal origin was characterized. Monitoring fluorescence intensity of resazurin turnover in RCC‑EW cells revealed no significant differences in metabolic activity in the presence of NR0B2. However, there was a significant decrease of cellular proliferation in cells overexpressing this NR, and NR0B2 was more efficient than currently used antiproliferative agents. Furthermore, flow cytometry analysis showed that heterologous overexpression of NR0B2 significantly reduced the amount of cells passing the G1 phase, while on the other hand, more cells in S/G2 phase were detected. Taken together, our data suggest that downregulation of NR0B2 may also play a role in renal cell carcinoma development and progression.
Keywords: small heterodimer partner, SHP1, NR0B2, nuclear receptor, kidney cancer, proliferation
Introduction
In the past decade, the mammalian nuclear receptor (NR) superfamily of transcription factors has been the focus of numerous studies analyzing their role in physiology and pathophysiology, revealing their key function in fundamental cellular processes,
including metabolism and proliferation.1,2 One of the outstanding characteristics of NRs
is the capacity to regulate the expression of a variety of genes, thereby coordinating transcription and function of gene networks. In detail, members of this protein family display three characteristic domains, namely the activation function, a highly conserved zinc‑finger region for DNA binding, and a large hydrophobic domain mediating ligand
binding and protein dimerization.3 Binding of specific activating ligands results in con‑
formational changes controlling dimerization and affinity to specific DNA sequences in the regulatory regions of their targets. However, when talking about NRs, one has to consider an extraordinary member of this protein superfamily, which is the small correspondence: henriette e Meyer zu
schwabedissen
Department of Pharmaceutical sciences, Biopharmacy, University of Basel, Klingelbergstrasse 50, ch-4056 Basel, switzerland
Tel +41 61 267 1495 Fax +41 61 267 1498
email [email protected]
Journal name: OncoTargets and Therapy Article Designation: Original Research Year: 2016
Volume: 9
Running head verso: Prestin et al
Running head recto: Impact of NR0B2 on proliferation of renal carcinoma cells DOI: http://dx.doi.org/10.2147/OTT.S106926
OncoTargets and Therapy downloaded from https://www.dovepress.com/ by 118.70.13.36 on 25-Aug-2020
For personal use only.
Number of times this article has been viewed
This article was published in the following Dove Press journal: OncoTargets and Therapy
Dovepress Prestin et al
heterodimer partner SHP1, also known as NR subfamily 0
group B member 2 (NR0B2).4
This particular NR is not only expressed in various human organs with outstanding importance in metabolic homeostasis, such as the liver, pancreas, and kidneys, but is also assumed to be a major regulator of several metabolic pathways, including glucose, bile acid, cholesterol, and fatty
acid homeostasis as reviewed by Kim et al.5
Importantly, the diversity of processes modulated by NR0B2 is the result of the unique functionality of this particular member of the superfamily. In detail, NR0B2 is an atypical NR, as it lacks the conserved zinc‑finger
DNA‑binding domain.4 Therefore, NR0B2 is not capable of
binding directly to response elements to regulate its target genes. Instead, NR0B2 interacts with various members of the superfamily of NRs, which in turn contain a DNA‑binding
domain and thereby exhibit transcriptional regulation.4 In this
way, NR0B2 is assumed to function as a transcriptional corepressor, inhibiting the activity of its binding partners by coactivator competition, recruitment of corepressors, or
direct interaction with their DNA‑binding domain.6
More precisely, compared to NR‑binding proteins har‑ boring LXXLL‑motifs in their amino acid sequence, the NR0B2 contains two functional LXXLL‑related motifs located in helix 1 of its N‑terminal ligand‑binding domain and in helix 5 of its carboxy‑terminus, which target the activation function (AF‑2) of other NRs, such as peroxi‑ some proliferator‑activated receptor gamma (NR1C3), aryl hydrocarbon receptor, constitutive androstane receptor (NR1I3), liver receptor homolog‑1 (NR5A2), liver X receptor alpha (NR1H3), farnesoid X receptor (NR1H4), and preg‑
nane X receptor (NR1I2).7–9 All these NRs are involved in
transcriptional regulation of more or less well‑defined gene networks, which explains the diversity of cellular functions
modulated by NR0B2.7–9 Hence, NR0B2 not only influences
physiological metabolic pathways, complex networks of drug metabolizing enzymes, and efflux transporters, but also
carcinogenesis and tumor progression.3,10
Especially, NR0B2 is assumed to be involved in the
regulation of cell cycle progression and apoptosis in liver.11,12
Indeed, Zhang et al reported that Nr0b2-/- knockout mice
lacking the expression of this NR spontaneously develop hepatocellular carcinoma (HCC) at the age of 12–15 months, which is accompanied by massive cellular proliferation
and enhanced malignant transformation of hepatocytes.13
Moreover, a link between NR0B2 and tumor suppression was confirmed by findings in human tissue samples of HCC, showing not only significant downregulation of NR0B2 in
hepatic tumor compared with nonmalignant transformed liver tissue, but also diminished expression of NR0B2 target gene
sets involved in cell proliferation and metabolism.14–16
Even though there is rising evidence that NR0B2 func‑ tions as a tumor suppressor, little is known about the role of this NR in human tumors other than HCC. The aim of the present study was to determine whether NR0B2 downregula‑ tion can also be observed in other tumor entities of human organism.
Materials and methods
human tissue samples
Human renal tissue samples were obtained from patients undergoing surgery after diagnosis of renal cell carcinoma. The study was approved by the local ethics committee at the Medical Faculty of the University of Greifswald (III UV 12/03). Written informed patient consent was also obtained. After surgical resection, the malignant and nonmalignant transformed samples were cut into small pieces, snap frozen
in liquid nitrogen, and stored at -80°C until further use. For
pulverization of the samples, 100 mg of snap frozen tissues were grinded for 1 minute at 25 Hz in a mixer mill (MM400, Retsch, Haan, Germany) using a 5 mL‑grinding jar, which was cooled in liquid nitrogen before. A polymerase chain reaction (PCR)‑ready first‑strand cDNA panel containing normal and malignant samples of various tissues was com‑ mercially obtained from OriGene, Rockville, MD, USA (TissueScan™ disease tissue quantitaPCR arrays CSRT101 and CSRT103/303/503, used for analysis in Figure 1).
cell lines
For the present study, the renal carcinoma cell lines RCC‑EW (KTCTL‑2, CLS 300246, Heidelberg, Germany), Caki‑1
(ATCC® HTB‑46™), and Caki‑2 (ATCC HTB‑47) cells
were used. The cell lines were kindly provided by Prof Nicole Endlich (Greifswald, Germany). Cell culture of RCC‑EW cells was performed using Dulbecco’s Modified Eagle’s Medium supplemented with 10% fetal calf serum (FCS) and 1% GlutaMAX™‑1 (each from LuBio Sciences,
Lucerne, Switzerland) at 37°C with 5% CO2 in a humidified
atmosphere. Caki‑1 and Caki‑2 cells were cultured under the same conditions in McCoy’s 5A (modified) medium (LuBio Sciences) supplemented with 10% FCS.
rna extraction and cDna synthesis
Human adult tissue total mRNA extracted from liver and kidney was purchased from BioCat (Heidelberg, Germany). Extraction and DNase treatment of total RNA from frozen
OncoTargets and Therapy downloaded from https://www.dovepress.com/ by 118.70.13.36 on 25-Aug-2020
Dovepress impact of nr0B2 on proliferation of renal carcinoma cells
and pulverized renal human tissues and from cultured cells
was conducted using the NucleoSpin® silica‑membrane
technology provided by Macherey‑Nagel (Dueren, Germany) according to the manufacturer’s instructions. After priming
with random hexamer oligonucleotides, total RNA (2 µg)
was reverse transcribed using the high‑capacity reverse transcription kit (LuBio Sciences).
TaqMan
®quantitative real-time Pcr
TaqMan quantitative real‑time PCR (RT‑PCR) was per‑ formed using cDNA (an equivalent of 10 ng RNA), Taq‑ Man Gene Expression Master Mix, predeveloped TaqMan probes (Hs00222677_m1 for NR0B2, Hs00765553_m1 for cyclin D1/CCND1, and assay 4319413E for 18S ribosomal RNA), and the ViiA7™ RT‑PCR system (each from LuBio Sciences). Expression was normalized to that of 18S ribosomalRNA using the ΔCt method, where Ct is the threshold cycle.
Relative expression was determined according to the 2-ΔΔCt
method referring to the expression of the indicated control.
Preparation of an nr0B2-encoding
adenovirus
The coding sequence of NR0B2 (NM_021969.2) was ampli‑
fied by PCR using the sense and antisense primer 5′‑CTTG
AGATGAGCACCAGCCAACCAGGGG‑3′ and 5′‑CATG
TCCCCAAAACAGGTCACCTGAGCAAAAGC‑3′, and
subcloned into eukaryotic expression vector pEF6/V5‑His
by TOPO® Cloning Reaction using the pEF6/V5‑His TOPO
TA expression kit (LuBio Sciences) according to the manu‑ facturer’s instructions.
The coding sequence of NR0B2 in pEF6/V5‑HIS
was then transferred into pENTR1A® (LuBio Sciences)
using the FastDigest™ restriction enzymes KpnI and NotI (Thermo Scientific, Reinach, Switzerland). After ligation, amplification in Escherichia coli, and sequence control, the NR0B2 insert was transferred into pAd/CMV/V5‑DEST™
(LuBio Sciences) by recombination using the Gateway®
LR Clonase™ Kit (LuBio Sciences). The adenoviral vector was digested with PacI and subsequently transfected Figure 1 nr0B2 expression in tumor tissue.
Notes: The mrna expression of nr0B2 was assessed by TaqMan® quantitative rT-Pcr comparing malignant and nonmalignant transformed tissue samples, (A–D) using the
commercially available cDna panel csrT103 (includes stomach, adenocarcinoma of stomach, and gisT) and csrT101 (includes liver and hcc [stages i–iV], from lung and nsclc [stages i–iV], kidney and ccrcc [stages i, iii, and iV]) (Origene, rockville, MD, Usa), (E) or using samples of 24 individuals undergoing renal surgery after diagnosis of rcc. Data are presented as mean ± sD and were obtained after performing the 2-ΔΔct method (*P0.05 by Mann–Whitney test). (F) Protein expression assessed by Western
blot analysis comparing surgery samples of rcc tissue compared to adjacent healthy control tissue. gaPDh served as loading control.
Abbreviations: adenocarc, adenocarcinoma; c, control; ccrcc, clear cell renal cell carcinoma; gaPDh, glyceraldehyde 3-phosphate dehydrogenase; gisT, gastrointestinal stromal tumor; hcc, hepatocellular carcinoma; nr0B2, nuclear receptor subfamily 0 group B member 2; nsclc, non-small cell lung carcinoma; rT-Pcr, real-time polymerase chain reaction; sD, standard deviation; T, tumor.
(
)
&RQWUR
O
5&&
.LGQH\PDWFKHG
15%N'D
*$3'+N'D
& 7 & 7 & 7
15%P51$
H[SUHVVLRQUHODWLYH WRFRQWUROWLVVXH
$
%
&
'
&RQWURO +&& &RQWURO 16&/& &RQWURO *,67 &RQWURO FF5&&
$GHQRFDUF
/LYHUSDQHO /XQJSDQHO 6WRPDFKSDQHO .LGQH\SDQHO
15%P51$
H[SUHVVLRQUHODWLYH WRFRQWUROWLVVXH
15%P51$
H[SUHVVLRQUHODWLYH WRFRQWUROWLVVXH
15%P51$
H[SUHVVLRQUHODWLYH WRFRQWUROWLVVXH
15%P51$
H[SUHVVLRQUHODWLYH WRFRQWUROWLVVXH
OncoTargets and Therapy downloaded from https://www.dovepress.com/ by 118.70.13.36 on 25-Aug-2020
Dovepress Prestin et al
into replication‑competent HEK293A cells (Vira Power,
LuBio Sciences, ATCC® Number CRL‑1573). Amplifica‑
tion of the virus was determined by visualization of cell lysis by light microscopy. Afterward, the supernatant was used for further virus amplification in HEK293A cells. The amount of plaque forming units (pfu) was determined by 3‑(4,5‑dimethylthiazol‑2‑yl)‑2,5‑diphenyltetrazolium bromide plaque assay in HEK293A cells, as recommended by the manufacturer (LuBio Sciences). The adenoviral vector pAd/CMV/V5‑GW/LacZ served as a control in the experiments, as recommended by the manufacturer (LuBio Sciences).
Protein preparation
Preparation of tissue lysates was performed by resuspension of pulverized tissue or cultured cells in ice‑cold radioim‑ munoprecipitation assay buffer (Sigma‑Aldrich, Buchs, Switzerland) containing 50 mM Tris–HCl of pH 8.0, 150 mM NaCl, 1% Igepal CA‑630/NP‑40, 0.5% sodium deoxycholate, 0.1% sodium dodecyl sulfate, and 1:100 protease inhibitor cocktail (Sigma‑Aldrich). After syringing the suspension with a 20‑gauge needle and 15 minutes incubation on ice,
cells were centrifuged 15 minutes at 13,000× g for removal of
cell debris. The supernatant was stored at -80°C until further
use. The Pierce® BCA protein assay kit (Thermo Scientific)
and an Infinite® M200 microplate reader (Tecan, Männedorf,
Switzerland) were used for protein quantification.
immunodetection
Tissue and cell lysates were used for immunodetection of NR0B2 by performing Western blot analysis. After sodium dodecyl sulfate polyacrylamide gel electrophoresis using 10% polyacrylamide gel, the proteins were electrotrans‑
ferred to a Protran® nitrocellulose membrane (GE Health‑
care, Glattbrugg, Switzerland) using the Mini‑PROTEAN®
Tetra Cell (Bio‑Rad, Cressier, Switzerland). For blocking of unspecific binding, membranes were incubated with tris‑
buffered saline containing 0.04% Tween® 20 containing 5%
albumin fraction V (Carl Roth, Arlesheim, Switzerland). NR0B2 protein was detected using a 1:1,000 dilution of rabbit polyclonal anti‑NR0B2 antibody (ab96605) (Abcam, Cambridge, UK) and a horseradish peroxidase‑labeled secondary goat anti‑rabbit IgG antibody (Bio‑Rad), each diluted in tris‑buffered saline containing 0.04% Tween 20 containing albumin fraction V, Pierce™ ECL 2 Western blotting substrate (Thermo Scientific), and ChemiDoc™ XRS System (Bio‑Rad). For immunofluorescence detec‑ tion of NR0B2 in cell lines, a rabbit antihuman polyclonal
antibody LS‑B3560‑50 (1:50 diluted in phosphate‑buffered saline [PBS] containing 5% FCS, LifeSpan BioSciences,
Seattle, WA, USA) and Alexa Fluor® 488‑labeled chicken
anti‑rabbit (1:300 diluted in PBS containing 5% FCS, H+L
A21200, Thermo Scientific) were used. Immunofluorescent staining of MKI67 was conducted using monoclonal rabbit anti‑MKI67 antibody (1:25, DRM004, San Diego, CA, USA) and Alexa Fluor 488‑coupled antibody (1:150). Cells were fixed with 4% paraformaldehyde and permeabilized with 0.2% Tween 20 for 10 minutes at room temperature. Samples
were mounted using Roti®‑Mount FluorCare (Carl Roth) con‑
taining 4′,6‑diamidino‑2‑pheynylindole for nuclei staining.
Staining was visualized with a Leica DMi8 microscope using a DFC365FX camera. MKI67 expression was quanti‑ fied with the Leica Application Suite version 4.4 (Leica, Heerbrugg, Switzerland). Intensity values were determined by subtracting mean intensity value of regions that mark the background from the mean intensity values of regions with specific staining (using the channel detecting emission of Alexa Fluor 488 as gray scale). The resulting intensity values were normalized to the background‑cleared average
value of signal intensity of 4′,6‑diamidino‑2‑pheynylindole
staining detected in the same marked regions. Five photo‑ graphs per sample were analyzed. Staining was performed in three experiments.
hematoxylin and eosin staining
Prior to staining of RCC‑EW with hematoxylin and eosin
(H&E), 3.2×10⁴ cells per well of a 12‑well plate were
seeded on cover slips and treated for 96 hours with adeno‑ virus. Afterward, the cells were washed with PBS, fixed
with methanol:acetone (1:1) for 10 minutes at -20°C. For
H&E staining, the fixed cells were incubated with hema‑ toxylin solution modified according to Gill II (Carl Roth) for 15 minutes, rinsed with tap water, incubated with eosin solution (Carl Roth, 75 mg eosin in acidic 75% ethanol) for 1 minute, and dehydrated in ascending ethanol concentrations (from 80% to 100%). After mounting the cover slips on slides using Roti Histokit (Carl Roth), staining was visualized with a Leica DMi8 microscope using a MC170HD camera and the Leica Application Suite version 4.4.
Determination of cell proliferation by
cell counting
Counting of RCC‑EW cells was performed using the CASY®
Model TT System (Roche Diagnostics, Indianapolis, IN, USA) based on the principle of electrical current exclusion.
Briefly, 3.2×10⁴ cells were seeded in a 12‑well plate and
OncoTargets and Therapy downloaded from https://www.dovepress.com/ by 118.70.13.36 on 25-Aug-2020
Dovepress impact of nr0B2 on proliferation of renal carcinoma cells
transduced with adenovirus (Ad)‑NR0B2, or Ad‑LacZ as control (50 pfu/cell). Ninety‑six hours after transfection, the
cells were counted by aspirating 400 µL of the cell suspension
through a measuring capillary sized 150 µm after trypsiniza‑
tion (300 µL trypsin–ethylenediaminetetraacetic acid 0.05%
per well, reaction stopped by 700 µL Dulbecco’s Modified
Eagle’s Medium per well) and diluted 1:200 in an isotonic liquid (CASYton, Roche Diagnostics). Caki‑1 cells were
defined as viable between sizes of 7.5–60.0 µm using the
manufacturer’s protocol “Setting Up An Animal Cell line”. Sizes of viable Caki‑2 and RCC‑EW cells ranged between
7.75 and 40.0 µm.
Determination of cell viability
Cells were cultured in a 48‑well plate in 100 µL of medium at
37°C for indicated periods of time. For background control,
medium without cells was used. Then 10 µL of resazurin
solution (PromoKine, Heidelberg, Germany) were added to each well. After 3 hours, fluorescence intensity was moni‑ tored, measuring the excitation at 530 nm and emission at 590 nm using an Infinite M200 plate reader and i‑control™ software (Tecan).
cell cycle analysis
For cell cycle analysis, 1×10⁵ cells/well were seeded in a six‑
well plate and cultured for 24 hours. Afterward, the cells were incubated with medium containing Ad‑NR0B2, or Ad‑LacZ as control (50 pfu/cell) for 12 hours. At indicated time points, the cells were harvested by trypsinization and fixed
for 24 hours in 70% ethanol at 4°C. The cells were stained
by 30 minutes incubation with PBS‑containing propidium
iodide (50 µg/mL), RNAse A (2 µg/mL), and glucose (15%
w/v). Resuspended and propidium iodide‑stained cells were analyzed using fluorescence‑activated cell sorting system FACSCalibur™ and the instrument software CellQuest™ (BD Biosciences, Heidelberg, Germany).
statistical analysis
Statistical calculations were performed using GraphPad Prism 6 version 6.04 (GraphPad Software Inc., La Jolla, CA, USA).
Results
Detection of nr0B2 in malignant and
nonmalignant transformed human tissues
As it has previously been reported that NR0B2 expression
is decreased in HCC,15,16 we investigated whether malignant
transformation of other tissues is also associated with a
regulation of NR0B2 mRNA levels. A first screening was per‑ formed assessing the amount of mRNA by TaqMan RT‑PCR using a commercially available PCR‑ready first‑strand cDNA panel that contained samples of different tumors.
NR0B2 expression was significantly lower in hepatic tumor tissue compared to the nonmalignant transformed
control tissue (relative expression 0.1±0.1 vs 1.0±0.2, Mann–
Whitney test, P0.05, Figure 1A). Furthermore, comparison
of malignant and nonmalignant transformed tissue samples
of lung (relative expression 0.5±1.1 vs 1.0±0.7, P=0.14,
Figure 1B) showed a difference in NR0B2 expression, however, without statistical significance. There was also a trend for downregulation of NR0B2 in the tumor tissue of the
stomach (relative expression in adenocarcinoma 0.4±0.5 vs
1.0±0.5, P=0.07, Figure 1C), while NR0B2 expression was
not detected in the gastrointestinal stromal tumor (GIST) of the stomach. Moreover, NR0B2 expression was reduced in renal cell carcinoma (Figure 1D). Despite the very small sample size in this first assessment of expression using the cDNA panel for screening, we verified our preliminary notion of downregulation of the NR by performing TaqMan quantitative RT‑PCR using a collection of 24 samples of renal cell carcinoma obtained from different individuals and paired adjacent nonmalignant transformed renal tissue
(relative expression 0.1±0.3 vs 1.4±1.1, Mann–Whitney test,
P0.0001, Figure 1E). In addition, performing Western
blot analyses confirmed that NR0B2 expression in human specimen of renal cell carcinoma was significantly lower compared to nonmalignant transformed tissue, suggesting that the previously observed reduction of this NR may also play a role in this tumor entity (Figure 1F).
characterization of nr0B2 expression
and proliferation of cell lines isolated
from renal carcinoma
To identify a cellular model that could be used for a mecha‑ nistic study to evaluate the impact of NR0B2 on prolifera‑ tion of renal carcinoma cells, we characterized the NR0B2 expression in a selection of immortalized renal carcinoma cell lines.
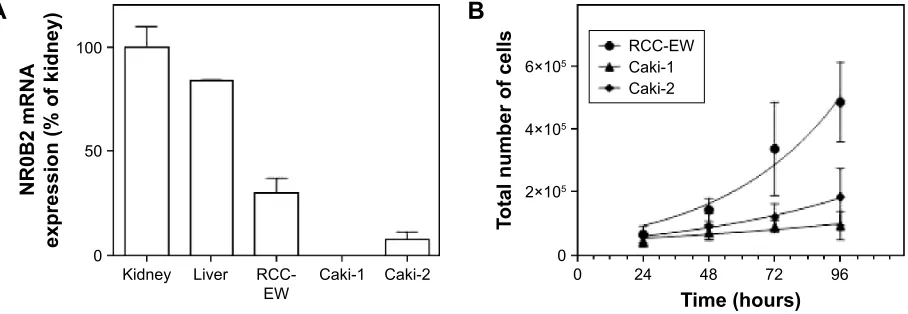
Performing quantitative RT‑PCR showed that, compared
to human kidney (100.2%±9.7%), NR0B2 mRNA expres‑
sion was similar in human liver (84.1%±0.2%), whereas its
expression was much lower in renal clear cell carcinoma cell lines Caki‑1 and Caki‑2 (relative expression referring to
human kidney 0.1%±0.0%, and 8.0%±3.5%, respectively),
and in the epithelial renal adenocarcinoma cell line RCC‑EW
(30.3%±7.0%) (Figure 2A).
OncoTargets and Therapy downloaded from https://www.dovepress.com/ by 118.70.13.36 on 25-Aug-2020
Dovepress Prestin et al
Monitoring the time course of cell numbers in the culture revealed that the doubling time of RCC‑EW cells was mark‑ edly shorter than that of Caki‑1 and Caki‑2 cells: 29.9 hours
(confidence interval [CI] 22.1±46.3 hours), 82.1 hours
(CI 46.6±344.8 hours), and 45.9 hours (CI 29.3±105.5 hours)
(doubling time assessed by nonlinear fit of exponential growth equation, Figure 2B). Due to their enhanced prolif‑ erative activity, the RCC‑EW cells were selected for further experiments.
impact of heterologous nr0B2 on cell
viability, proliferation, and cell cycle
progression of rcc-eW cells
Previous findings by Zhang et al suggest an impact of the
NR on cell proliferation.13 To test whether NR0B2 exerts a
similar influence on carcinoma cells derived from human kidney, the impact of adenoviral transfer of NR0B2 on RCC‑EW cells was tested.
The heterologous transfer of NR0B2 was validated by Western blot analysis using different amounts of the NR0B2 adenovirus. The used adenoviral load was directly associated with the expression levels of NR0B2 protein (Figure 3A). Additionally, immunofluorescent staining of NR0B2 in RCC‑EW cells was significantly enhanced after infection with Ad‑NR0B2, but not after exposure to LacZ control (Ad‑LacZ, Figure 3B). Importantly, H&E staining revealed no significant change of cellular morphology after adenoviral infection with either Ad‑NR0B2 or Ad‑LacZ, although some cells transduced with NR0B2 appeared bigger and were swollen (Figure 3C).
Cell viability was monitored by quantification of resazu‑ rin turnover. As shown in Figure 4A, no significant differ‑ ence was observed in metabolic activity after viral transfer of NR0B2 or LacZ. However, the effect of heterologous NR0B2 on proliferative activity determined by capillary‑ based cell counting over a period of 96 hours, revealed a significantly decelerated proliferation rate of RCC‑EW cells after infection with the adenovirus encoding for the NR (total cell number 72 hours after infection with Ad‑LacZ vs
Ad‑NR0B2 9.2±4.6×10⁵ vs 6.3±3.8×10⁵; and 96 hours after
infection with Ad‑LacZ vs Ad‑NR0B2 11.5±8.7×10⁵ vs
7.6±6.6×10⁵; Figure 4B). Our results support the notion that
NR0B2 overexpression also has an antiproliferative effect on renal cell carcinoma cells.
To qualify the impact of NR0B2 on cell cycle progres‑ sion, flow cytometric analysis after propidium iodide staining of infected cells was performed. RCC‑EW cells showed a pronounced shift of cell cycle phases 96 hours after adeno‑ viral transfer of NR0B2 (Figure 4C). In detail, adenoviral overexpression of this NR significantly reduced the amount of cells passing the G1 phase (Ad‑NR0B2 vs Ad‑LacZ
77.8%±0.1% vs 67.4%±0.2% referring to total cell number,
two‑way analysis of variance, Dunnett’s test post hoc,
P0.0005), while more cells were detected in the S/G2
phase (Ad‑NR0B2 vs Ad‑LacZ 17.1%±0.5% vs 24.7%±0.4%
referring to total cell number, two‑way analysis of variance,
Dunnett’s test post hoc, P0.0005).
It has previously been reported that the antiproliferative activity of NR0B2 in HCC is associated with a downregula‑
tion of the cell cycle regulator cyclin D1.17,18 To test whether
î
î
î
7LPHKRXUV
7RWDOQXPEHURIFHOOV
5&&(: &DNL &DNL
%
5&& (: /LYHU
.LGQH\ &DNL &DNL
15%P51$
H[SUHVVLRQRINLGQH\
$
Figure 2 characterization of nr0B2 expression human renal carcinoma cell lines.
Notes: (A) nr0B2 mrna expression assessed by TaqMan® quantitative rT-Pcr. Data are presented as mean ± sD and were obtained after performing the 2-ΔΔct method
referring the expression to that of human kidney (Biocat, heidelberg, germany). (B) For characterization of proliferation, time course of cell numbers in culture was monitored at indicated time points and assessed by capillary-based casY® cell counting. Data are presented as mean ± sD (n=3 in triplicates, nonlinear fit of exponential
growth equation).
Abbreviations: mrna, messenger rna; nr0B2, nuclear receptor subfamily 0 group B member 2; rT-Pcr, real-time polymerase chain reaction; rcc-eW, renal cell carcinoma cell line; sD, standard deviation.
OncoTargets and Therapy downloaded from https://www.dovepress.com/ by 118.70.13.36 on 25-Aug-2020
Dovepress impact of nr0B2 on proliferation of renal carcinoma cells
,QIHFWLRQRI5&&(:
$G15%
15%
$GH*)3
SIX
β$FWLQ
H*)3
$
$G/DF= $G15%$G15% $G/DF=
%
&
Figure 3 Validation of adenoviral transfer of nr0B2 (ad-nr0B2) in rcc-eW cells.
Notes: (A) Western blot analysis of rcc-eW cell lysates 96 hours after infection with indicated amounts of pfu of ad-nr0B2 or ad-egFP as control. (B) Immunofluorescent staining of rcc-eW cells with anti-nr0B2 polyclonal primary antibody and alexa Fluor® 488-labeled secondary antibody (green) 12 hours after adenoviral transfer. cell
nuclei were counterstained with 4′,6-diamidino-2-pheynylindole (blue). For infection of rcc-eW cells, 50 pfu per cell was used. scale bar =10 µm. (C) For assessment of cellular morphology, cells were fixed and stained with hematoxylin and eosin 96 hours after infection, Scale bar =200 µm.
Abbreviations: pfu, plaque forming units; NR0B2, nuclear receptor subfamily 0 group B member 2; RCC‑EW, renal carcinoma cell line; eGFP, enhanced green fluorescent protein.
$G/DF= $G15%
'HDG * *6
3KDVHVRIFHOOF\FOH
$
&
$G/DF=
$G15% $G/DF= $G15% $G/DF= $G15% $G/DF= $G15%
K K K K
9LDELOLW\
RIFRQWURO
&HOOQXPEHU
RIWRWDOFHOOV
'
P51$
H[SUHVVLRQ
UHODWLYHWR
$G/DF=
(
$G/DF= $G15% &&1'
*$3'+
%
7LPHKRXUV
&&1'
7RWDOFHOOQXPEHU
î
î
î
$G/DF= $G15%
$G/DF= &RQWURO
$G15%
Figure 4 Heterologous NR0B2 overexpression significantly decreased the proliferation of renal cell carcinoma cell line RCC‑EW.
Notes: The impact of exogenous nr0B2 overexpression on cell viability, proliferative activity, and cell cycle progression was analyzed. Fifty pfu per cell were used for infection with nr0B2-adenovirus (ad-nr0B2) or lacZ-adenovirus as control (ad-lacZ). Data from A to D are mean ± sD. (A) Monitoring of fluorescence intensity of resazurin turnover (n=5, P0.05 by t-test). (B) Monitoring of the time course of cell count in culture at indicated time points assessed by capillary based casY® cell counting
(n=5, *P0.05 by ratio paired t-test). (C) Cell cycle analysis by fluorescence‑activated cell sorting (n=3, *P0.05 by two-way analysis of variance, Dunnett’s test post hoc). (D) impact of nr0B2 on mrna expression of cyclin D1 (ccnD1) was assessed by TaqMan® quantitative rT-Pcr. Data were obtained according to the 2-ΔΔct-method
referring expression to that observed in cells infected with ad-lacZ control (n=3, not significant P0.05 by Mann–Whitney test). (E) cyclin D1 protein expression assessed by Western blot analysis comparing rcc-eW cells in presence and absence of nr0B2 adenovirus. gaPDh served as loading control.
Abbreviations: gaPDh, glyceraldehyde 3-phosphate dehydrogenase; nr0B2, nuclear receptor subfamily 0 group B member 2; pfu, plaque forming units; rcc-eW, renal carcinoma cell line; rT-Pcr, real-time polymerase chain reaction; sD, standard deviation; h, hours.
OncoTargets and Therapy downloaded from https://www.dovepress.com/ by 118.70.13.36 on 25-Aug-2020
Dovepress Prestin et al
cyclin D1 is also regulated by NR0B2 in renal carcinoma, the expression of cyclin D1 was assessed in RCC‑EW cells in the presence and absence of NR0B2. However, neither
mRNA (Figure 4D: 1.3±1.1 vs 1.6±1.7, P=0.90) nor protein
expression (Figure 4E as assessed by Western blot analysis) were significantly altered by NR0B2.
Moreover, immunofluorescent staining of MKI67 revealed no significant change in the mean expression of this proliferation marker in the presence or absence of
NR0B2 (mean of expression ± SD referring to control:
Ad‑LacZ vs NR0B2 1.00±0.50 vs 1.05±0.24, t‑test, P=0.85;
Figure 5).
$G/DF=
1XFOHL '$3,
0.,
$OH[D)OXRU
0HUJH
6HFRQGDU\DQWLERG\ FRQWUROPHUJH
6HFRQGDU\DQWLERG\
FRQWURO$OH[D)OXRU
$G15%
Figure 5 Immunofluorescent staining of MKI67 in RCC‑EW cells.
Notes: anti-MKi67 monoclonal primary antibody and alexa Fluor® 488-labeled secondary antibody (green) were used for staining of rcc-eW cells 96 hours after
transduction with 50 plaque forming units of nr0B2-adenovirus (ad-nr0B2) or lacZ-adenovirus (ad-lacZ). cell nuclei were counterstained with DaPi (blue). scale bar =100 µm. The micrograph is representative of three independent experiments.
Abbreviations: DaPi, 4′,6-diamidino-2-pheynylindole; nr0B2, nuclear receptor subfamily 0 group B member 2; rcc-eW, renal carcinoma cell line.
OncoTargets and Therapy downloaded from https://www.dovepress.com/ by 118.70.13.36 on 25-Aug-2020
Dovepress impact of nr0B2 on proliferation of renal carcinoma cells
impact of adenoviral expression of
nr0B2 on rcc-eW cells compared to
chemotherapeutics
Since NR0B2 significantly reduced cellular proliferation of renal carcinoma cells, we next compared the impact of heter‑ ologously overexpressed NR0B2 with the effectiveness of the tyrosine kinase inhibitor sunitinib or the mammalian target of rapamycin inhibitor temsirolimus, which are in clinical
use for the treatment of renal cell carcinoma.19–21
When renal carcinoma cells RCC‑EW not overexpress‑ ing NR0B2 were treated with sunitinib (Ad‑LacZ/dimethyl
sulfoxide [DMSO] vs Ad‑LacZ/10 µM: 100%±43.6%
vs 60.0%±17.8%) or temsirolimus (Ad‑LacZ/DMSO vs
Ad‑LacZ/10 µM: 100%±43.6% vs 68.8%±23.2%), the
impact of these compounds was limited to a slight but not statistically significant reduction in cell numbers compared to control cells treated with solvent control (Figure 6A and B). In contrast, a significant reduction in cell numbers was observed when cells were infected with NR0B2‑adenovirus
and simultaneously treated with DMSO (47.0%±16.4%),
sunitinib (10 µM: 35.0%±11.0%), or temsirolimus (10 µM:
36.3%±12.6%), indicating that infection with Ad‑NR0B2
was more efficient than treatment with chemotherapeutics alone. However, inhibition of proliferation by a combination of adenoviral transfer and chemotherapeutic treatment was not stronger than usage of the adenovirus alone.
Discussion
Members of the transcription factor family of NRs have been reported to regulate the expression of target genes involved
in cellular signaling, drug metabolism, drug transport, and/or tumor progression. Especially, NR0B2 has been addressed in terms of carcinogenesis. Studies using NR0B2 knockout mice demonstrate that the loss of this particular orphan NR results in enhanced malignant transformation and increased proliferation of hepatocytes, finally triggering the spontane‑
ous development of HCC.10–13 Additionally, beneficial effects
of farnesoid X receptor‑induced NR0B2 expression on cell proliferation and tumor growth of liver cancer in nude mice
have been observed.14 Notably, our results confirmed the pre‑
vious findings by others and showed a significant reduction of NR0B2 expression when comparing the specimen of HCC and nonmalignant transformed tissue, which suggested that
NR0B2 functions as tumor suppressor in this tissue.12,13–16
The focus of our study was to show that downregula‑ tion or even loss of human NR0B2 is also characteristic for extrahepatic tumor entities. Yet, in our study, when using the commercially available cDNA panel, we observed dif‑ ference in NR0B2 expression when comparing tumor and healthy control tissue samples of human non‑small cell carcinoma of the lung. However, the results did not reach statistical significance, which may in part be explained by the small number of samples in the cDNA tumor panel used for screening. Nonetheless, Jeong et al previously identified mRNA expression of NR0B2 as a prognostic marker for the outcome of non‑small cell lung cancer patients, thereby providing evidence for NR0B2 playing a role in tumor
progression.22 Our results also indicated that NR0B2 expres‑
sion is lower in samples of gastric adenocarcinoma, which might be in contrast to findings of Park et al, showing high
Sunitinib
Cell numbe
r
(% of DMSO control)
Cell numbe
r
(% of DMSO control)
Temsirolimus
A
* *
* *
*
* *
* *
*
* *
*
B
200
150
100
50
Ad-Lac
Z
Ad-Lac
Z
Ad-NR0B
2
Ad-NR0B
2
Ad-Lac
Z
Ad-NR0B
2
Ad-Lac
Z
Ad-Lac
Z
Ad-NR0B
2
Ad-NR0B
2
Ad-Lac
Z
Ad-NR0B
2
DMSO 1 µM 10 µM DMSO 1 µM 10 µM 0
200
150
100
50
0
Figure 6 impact of adenoviral transfer of nr0B2 and antiproliferative compounds on rcc-eW cells.
Notes: The rcc-eW cells were infected with 50 plaque forming units of adenovirus containing lacZ or nr0B2, respectively (ad-lacZ, ad-nr0B2), and were treated with different concentrations of (A) sunitinib or (B) temsirolimus. cells were counted using capillary-based casY® cell counter 96 hours after viral infection and 48 hours after
application of compounds. Data are presented as mean ± sD (n=4, *P0.05 by one-way analysis of variance, Tukey’s posttest).
Abbreviations: DMsO, dimethyl sulfoxide; nr0B2, nuclear receptor subfamily 0 group B member 2; sD, standard deviation; rcc-eW, renal carcinoma cell line.
OncoTargets and Therapy downloaded from https://www.dovepress.com/ by 118.70.13.36 on 25-Aug-2020
Dovepress Prestin et al
NR0B2 expression in precancerous lesions of human gastric
cancer.23 In our expression analysis using the commercially
obtained cDNA panel, specimen of GIST showed even more pronounced downregulation of NR0B2 compared to healthy control samples. At this point, one might speculate that even though NR0B2 is highly expressed in intestinal metaplasia lesions of the stomach, its role in tumor progression in adenocarcinoma and GIST might be different.
Importantly, the findings of our expression studies screen‑ ing the samples of the cDNA panel also revealed that NR0B2 is downregulated in human renal cell carcinoma compared to healthy tissue samples, suggesting that mechanisms of reduced NR0B2 expression may also play a role in this tumor entity. Our observation was further validated in a collection of renal carcinoma samples comprising a higher number of specimens from tumor and nonmalignant trans‑ formed tissue where each sample pair was derived from one individual. Since little is known about the role of NR0B2 in renal carcinogenesis, we further focused on NR0B2 in this tumor entity.
To assess the impact of NR0B2 on renal carcinoma cell proliferation, we performed an adenoviral transfer of NR0B2 in tumor kidney cells, thereby modulating the expression of this NR. The overexpression of NR0B2 in a human renal carcinoma cell line (RCC‑EW) resulted in a significantly diminished proliferative activity in vitro.
Furthermore, some cells transduced with NR0B2 dis‑ played cytoplasmic swelling, which is a characteristic of oncotic, nonapoptotic cell death due to disturbed intracellular
ion homeostasis, and membrane integrity.24 Based on the fact
that NR0B2 is also a transcriptional regulator of membrane
transporters,8 it may be speculated that this NR is involved in
the regulation of ion channels, thereby stabilizing the osmotic nature of the cell. Nonetheless, the growth‑inhibiting effect of NR0B2 may also include other targets, which are involved in apoptosis and cell cycle progression. As reviewed by
Zhang and Wang, these targets include NF‑κB, P53, C‑JUN,
HDAC6, NUR77, and BCL2.12 Focusing on the latter, it is
assumed that the growth inhibiting capacity of NR0B2 is based on the inhibitory interaction of this NR with BCL2, which is known to function as an antiapoptotic protein. The inhibition of BCL2 by NR0B2 promotes mitochondrial
cytochrome c release and therefore apoptosis.12
Moreover, previous studies analyzing the role of NR0B2 in hepatocarcinogenesis show that the tumor‑suppressing function of NR0B2 in HCC is based on the repression of cyclin D1 expression. In this regard, it is noteworthy that
cyclin D1 is a positive regulator of cell cycle progression,25
and that cyclin D1 expression is assumed to be under the
control of NR liver receptor homolog‑1 (NR1H2).8 Thus the
impact of NR0B2 in hepatocytes is assumed to be indirect,
by negative modulation of nuclear receptor LHR‑1.13,26,27
In accordance with this, the loss of NR0B2 in HCC is associated with increased cyclin D1 expression, which then
promotes hepatocyte proliferation.13
Even though the NR0B2‑dependent downregulation of cyclin D1 has been reported, the NR0B2‑dependent impact on cyclin D1 expression, as previously observed in liver, was not found in RCC‑EW cells, suggesting that additional regulators are involved, and that NR0B2‑mediated cyclin D1 repression may be cell‑specific. Although we did not observe a significant change in the expression of cyclin D1, there was a shift in cell cycle progression from G1 phase to S/G2 phase. In addition, our studies revealed no significant change in the expression of MKI67, which is a protein present during cell cycle progression, and which is absent in cells arrested
in the G0 phase.28 These findings suggest that NR0B2 may
rather trigger G2 arrest in renal carcinoma cells, preventing the cells from entering mitosis. Thus it needs to be clarified whether NR0B2 affects the expression or activity of proteins
regulating G2/M transition.29
Nevertheless, even if the underlying mechanism for the antiproliferative effect in renal carcinoma cells has not been clarified, our findings in human kidney cells, and the results of others showing the tumor growth inhibiting effect of NR0B2 in HCC, direct the attention to this NR as a target in cancer treatment. Focusing on this option, expression of NR0B2 may be influenced directly by heterologous overex‑ pression of NR0B2, as realized by adenoviral transfer in our study. Importantly, in our in vitro studies, the direct impact of NR0B2 was more pronounced than that observed for chemotherapeutic treatment using tyrosine kinase inhibitor sunitinib or the mammalian target of rapamycin inhibitor temsirolimus, which are approved for the treatment of renal
cell carcinoma.19 In this context, it is important that renal cell
carcinoma exhibit pronounced chemoresistance, resulting in
poor responsiveness to conventional chemotherapy.20,21
In this regard, it will be the focus of future studies to test potential therapeutic approaches, which could be fol‑ lowed to enhance NR0B2 activity. The first strategy could be ligand‑mediated activation. However, this may be chal‑ lenging, as NR0B2 is classified as an orphan receptor, since the ligands modulating its activity have not been identified so far, although some atypical retinoids are discussed as
activating ligands.30 Another option to influence NR0B2
activity is the transcriptional modulation of NR0B2 gene
OncoTargets and Therapy downloaded from https://www.dovepress.com/ by 118.70.13.36 on 25-Aug-2020
Dovepress impact of nr0B2 on proliferation of renal carcinoma cells
expression. It has been reported that NR0B2 is the target of ligand‑activated NR, which bind to the highly con‑
served 5′‑flanking promoter region of NR0B2 and induce
the expression of this NR. Hence, affecting the activity of transcription factors, such as NR farnesoid X recep‑ tor or liver X receptor alpha, which are known regulators of NR0B2, may be another strategy to modulate NR0B2
expression.8,27,31 However, one has to consider that activa‑
tion of NR may result in a high potential of adverse effects due to the fundamental role of NR in metabolic pathways and drug response, as we have learned from the lessons
of pregnane X receptor‑induced drug–drug interactions.8,9
A third approach to enhance the level of NR0B2 in tumors, and to compensate for an insufficient expression of this gene would be the use of gene therapy. Interestingly, the feasi‑ bility of viral gene transfer as therapeutic intervention has been proven in in vivo studies on heart failure, showing that adenoviral‑transfer of sarcoendoplasmic reticulum calcium transport ATPase (SERCA2a) results in beneficial effects on cardiac myocyte contractility and calcium transport, and
thereby on systolic and diastolic dysfunction.32
Taken together, our findings reveal that NR0B2 is downregulated in human renal cell carcinoma compared to healthy tissue, suggesting that mechanisms of reduced NR0B2 expression may play a role in the development and progres‑ sion of this tumor entity. Our data also show that reconstitu‑ tion of NR0B2 by adenoviral transfer diminishes cellular proliferation of human kidney tumor cells in vitro, supporting its regulatory function in renal cell cancer progression and its potential role in treatment of renal cell carcinoma.
Disclosure
The authors report no conflicts of interest in this work.
References
1. Burris TP, Busby SA, Griffin PR. Targeting orphan nuclear receptors for treatment of metabolic diseases and autoimmunity. Chem Biol. 2012;19(1):51–59.
2. Sherman MH, Downes M, Evans RM. Nuclear receptors as modulators of the tumor microenvironment. Cancer Prev Res. 2012;5(1):3–10. 3. Urquhart BL, Tirona RG, Kim RB. Nuclear receptors and the regulation
of drug‑metabolizing enzymes and drug transporters: implications for interindividual variability in response to drugs. J Clin Pharmacol. 2007; 47(5):566–578.
4. Seol W, Choi HS, Moore DD. An orphan nuclear hormone receptor that lacks a DNA binding domain and heterodimerizes with other receptors. Science. 1996;272(5266):1336–1339.
5. Kim MK, Chanda D, Lee IK, Choi HS, Park KG. Targeting orphan nuclear receptor SHP in the treatment of metabolic diseases. Expert Opin Ther Targets. 2010;14(4):453–466.
6. Bavner A, Sanyal S, Gustafsson JA, Treuter E. Transcriptional corepres‑ sion by SHP: molecular mechanisms and physiological consequences. Trends Endocrinol Metab. 2005;16(10):478–488.
7. Johansson L, Bavner A, Thomsen JS, Farnegardh M, Gustafsson JA, Treuter E. The orphan nuclear receptor SHP utilizes conserved LXXLL‑ related motifs for interactions with ligand‑activated estrogen receptors. Mol Cell Biol. 2000;20(4):1124–1133.
8. Tirona RG, Kim RB. Nuclear receptors and drug disposition gene regulation. J Pharm Sci. 2005;94(6):1169–1186.
9. Meyer zu Schwabedissen HE, Kim RB. Hepatic OATP1B transport‑ ers and nuclear receptors PXR and CAR: interplay, regulation of drug disposition genes, and single nucleotide polymorphisms. Mol Pharm. 2009;6(6):1644–1661.
10. Baek SH, Kim KI. Emerging roles of orphan nuclear receptors in cancer. Annu Rev Physiol. 2014;76:177–195.
11. Zhang Y, Hagedorn CH, Wang L. Role of nuclear receptor SHP in metabolism and cancer. Biochim Biophys Acta. 2011;8:893–908. 12. Zhang Y, Wang L. Nuclear receptor small heterodimer partner in
apoptosis signaling and liver cancer. Cancers. 2011;3(1):198–212. 13. Zhang Y, Xu P, Park K, Choi Y, Moore DD, Wang L. Orphan receptor small
heterodimer partner suppresses tumorigenesis by modulating cyclin D1 expression and cellular proliferation. Hepatology. 2008;48(1):289–298. 14. Su H, Ma C, Liu J, et al. Downregulation of nuclear receptor FXR is
associated with multiple malignant clinicopathological characteristics in human hepatocellular carcinoma. Am J Physiol Gastrointest Liver Physiol. 2012;303(11):G1245–G1253.
15. Park YY, Choi HS, Lee JS. Systems‑level analysis of gene expression data revealed NR0B2/SHP as potential tumor suppressor in human liver cancer. Mol Cells. 2010;30(5):485–491.
16. He N, Park K, Zhang Y, Huang J, Lu S, Wang L. Epigenetic inhibition of nuclear receptor small heterodimer partner is associated with and regulates hepatocellular carcinoma growth. Gastroenterology. 2008; 134(3):793–802.
17. Botrugno OA, Fayard E, Annicotte JS, et al. Synergy between LRH‑1 and beta‑catenin induces G1 cyclin‑mediated cell proliferation. Mol Cell. 2004;15(4):499–509.
18. Sato Y, Itoh F, Hareyama M, et al. Association of cyclin D1 expression with factors correlated with tumor progression in human hepatocellular carcinoma. J Gastroenterol. 1999;34(4):486–493.
19. Ljungberg B, Bensalah K, Canfield S, et al. EAU guidelines on renal cell carcinoma: 2014 update. Eur Urol. 2015;67(5):913–924. 20. Buczek M, Escudier B, Bartnik E, Szczylik C, Czarnecka A. Resistance
to tyrosine kinase inhibitors in clear cell renal cell carcinoma: from the patient’s bed to molecular mechanisms. Biochim Biophys Acta. 2014; 1845(1):31–41.
21. Santoni M, Pantano F, Amantini C, et al. Emerging strategies to over‑ come the resistance to current mTOR inhibitors in renal cell carcinoma. Biochim Biophys Acta. 2014;1845(2):221–231.
22. Jeong Y, Xie Y, Xiao G, et al. Nuclear receptor expression defines a set of prognostic biomarkers for lung cancer. PLoS Med. 2010;7(12): e1000378.
23. Park MJ, Kim KH, Kim HY, Kim K, Cheong J. Bile acid induces expression of COX‑2 through the homeodomain transcription factor CDX1 and orphan nuclear receptor SHP in human gastric cancer cells. Carcinogenesis. 2008;29(12):2385–2393.
24. Kunzelmann K. Ion channels in regulated cell death. Cell Mol Life Sci. 2016;73(11–12):2387–2403.
25. Thomasova D, Anders HJ. Cell cycle control in the kidney. Nephrol Dial Transplant. 2015;30(10):1622–1630.
26. Oiwa A, Kakizawa T, Miyamoto T, et al. Synergistic regulation of the mouse orphan nuclear receptor SHP gene promoter by CLOCK‑BMAL1 and LRH‑1. Biochem Biophys Res Commun. 2007;353(4):895–901. 27. Goodwin B, Jones SA, Price RR, et al. A regulatory cascade of the
nuclear receptors FXR, SHP‑1, and LRH‑1 represses bile acid biosyn‑ thesis. Mol Cell. 2000;6(3):517–526.
28. du Manoir S, Guillaud P, Camus E, Seigneurin D, Brugal G. Ki‑67 labeling in postmitotic cells defines different Ki‑67 pathways within the 2c compartment. Cytometry. 1991;12(5):455–463.
29. Stark GR, Taylor WR. Control of the G2/M transition. Mol Biotechnol. 2006;32(3):227–248.
OncoTargets and Therapy downloaded from https://www.dovepress.com/ by 118.70.13.36 on 25-Aug-2020
OncoTargets and Therapy
Publish your work in this journal
Submit your manuscript here: http://www.dovepress.com/oncotargets-and-therapy-journal OncoTargets and Therapy is an international, peer‑reviewed, open access journal focusing on the pathological basis of all cancers, potential targets for therapy and treatment protocols employed to improve the management of cancer patients. The journal also focuses on the impact of management programs and new therapeutic agents and protocols on
patient perspectives such as quality of life, adherence and satisfaction. The manuscript management system is completely online and includes a very quick and fair peer‑review system, which is all easy to use. Visit http://www.dovepress.com/testimonials.php to read real quotes from published authors.
Dovepress
Dove
press
Prestin et al
30. Chanda D, Park JH, Choi HS. Molecular basis of endocrine regula‑ tion by orphan nuclear receptor small heterodimer partner. Endocr J. 2008;55(2):253–268.
31. Goodwin B, Watson MA, Kim H, Miao J, Kemper JK, Kliewer SA. Differential regulation of rat and human CYP7A1 by the nuclear oxysterol receptor liver X receptor‑alpha. Mol Endocrinol. 2003;17(3): 386–394.
32. Periasamy M. Adenoviral‑mediated serca gene transfer into cardiac myocytes: how much is too much? Circ Res. 2001;88(4):373–375.
OncoTargets and Therapy downloaded from https://www.dovepress.com/ by 118.70.13.36 on 25-Aug-2020
![Figure 1 nr0B2 expression in tumor tissue.commercially available cDna panelnsclc [stages i–iV], kidney and ccrcc [stages i, iii, and iV]) (Origene, rockville, MD, Usa), (rcc](https://thumb-us.123doks.com/thumbv2/123dok_us/8621859.1411567/3.612.79.549.51.342/figure-expression-tissue-commercially-available-panelnsclc-origene-rockville.webp)