1. Introduction
Clayey soils take an important place among soils with special behavior because of their volume change with a variation of moisture variations. These volumetric changes are quite fatal for the structures built over them. Most of the foundation failures occur due to the expansive behavior of the soil underneath. Damage caused by these soils is more than twice than that of flood, hurricanes, tornados and earthquakes combined Jones and Holtz [11]. Damages caused due to the expansive behavior of clays are normally cracking and break up of pavements and building foundations. They also exert pressure on the face of retaining walls due to their swell potential. The expansive behavior of clayey soils is due to their mineralogical composition. Most common clay minerals i.e. smectite, illite, montmorillonite, and vermiculite etc. Show expansive behavior. These minerals consist of very fine particles which have very weak interparticle bonding and the greater surface area which makes it more prone to absorbing water. Large spaces are present between its particle lattice. Water can enter and hold into these spaces, causing an increase in volume or swelling of the soil.
Corresponding author
E-mail address: [email protected] DOI: 10.22105/jarie.2019.193339.1096
Use of Gypsum and Bagasse Ash for Stabilization of Low Plastic
and High Plastic Clay
Sadam Hussain Khan
NUST Institute of Civil Engineering, National University of Science and Technology, NUST, Islamabad, Pakistan.
A B S T R A C T P A P E R I N F O
Clays have a tendency to undergo volumetric changes when they interact with water. These soils are a very common reason for most of the foundation failures due to their degraded properties. With the growing need of infrastructure development, avoiding these soils for future constructions may not be possible. The present research is intended to examine the effect of gypsum and bagasse ash on the properties of clays and evaluate their potential for the stabilization and improvement of engineering properties of these soils. Gypsum is naturally occurring mineral and bagasse ash is a waste product produced by sugar-mills. Two types of swelling clays i.e. Low plastic, and high plastic clay, are used in this research for stabilization. Atterberg’s limits, compaction characteristics, unconfined compressive strength, California Bearing Ratio and swell potential of these soils are determined in both untreated as well as in treated form with varying content of gypsum and bagasse ash. The improvement observed for the combination of gypsum and bagasse ash is more significant as compared to the individual effect of gypsum or bagasse ash. Results obtained indicate that gypsum and bagasse ash can provide an effective and economical method for the improvement of Low and high plastic clays.
Chronicle:
Received: 09 June 2019 Revised: 14 August 2019
Accepted:17 September 2019
Keywords: Clays.
Cation Exchange. Chemical Admixtures. Gypsum.
Pozzolans. Bagasse Ash. Expansive Soils.
Journal of Applied Research on Industrial
Engineering
Various mechanical and chemical techniques have been developed to improve or stabilize the engineering properties of these soils. Mechanical stabilization includes compaction, surcharge loading, and pre-wetting etc. While chemical stabilization is done by adding different chemical admixtures i.e. Lime, cement, fly ash and chloride salts etc. These chemicals reduce the undesired swell and shrink potential of soil by directly reacting with soil particles. Most of these reactions are either cementitious or pozzolanic in nature.
Researchers have been trying to evaluate the potential of different chemicals as soil stabilizers by studying their effect on engineering properties of soil i.e. Consistency limits, particle size gradation [8], compaction characteristics, unconfined compressive strength, durability, California bearing ratio and swell potential of soil. Negi et al. [13] used lime for stabilization of highly active soils which undergo through frequent expansion and shrinkage. They found out that lime is an excellent soil stabilizing material for such soils. Basha et al. [12] monitored the effect of rice husk ash and cement on the strength properties of residual soils. Alavéz-Ramírez et al. [1] has used sugarcane bagasse ash and lime as soil stabilizers. Kolay and Pui [12] has used gypsum and fly ash for the stabilization of peat soils. Et al. [15] has used sugarcane bagasse ash for the stabilization of lateritic soils. Rajakumaran [16] studied the effect of steel slag and fly ash. Nsaif [14] has studied the effect of the addition of plastic waste materials on the strength of soils. Significant interest is shown by researchers to improve soil properties by using naturally occurring cheap materials and industrial wastes. Selection of any material as a soil stabilizer depends upon its suitability, availability and economic factors. Jamsawang et al. [17] studied the effectiveness of bagasse ash to improve unconfined compressive strength, chemical composition and microstructural properties of soft clay. The results indicated an increase in strength parameters. Rajeswari et al. [22] conducted an experimental program to investigate the influence of bagasse ash & phosphogypsum on the strength of sub grade soil. They concluded that these additives provide an effective mean to improve soil strength.
The basic mechanism of chemical stabilization is the bonding of soil particles and improvement of inter-particle forces with the added chemicals. Clay inter-particles are normally negatively charged. These negatively charged particles repel each other and cause a dispersion in soil particles, reducing the strength and bonding of soil. These negatively charged particles can be held together by positively charged cations forming large-sized flocks and groups of particles. This process is termed as flocculation and agglomeration which improve the drainage and strength parameters of soil Walworth [20]. Flocculation power of different cations is different. From Table 1, it is clear that sodium is weakest and calcium is strongest flocculator among the most common cations Rengasamy and Sumner [18]. Sodium and potassium can be replaced with cations of higher flocculating power i.e., Calcium and magnesium by the process of cation exchange. Cation exchange can be achieved by isomorphs substitution which is the process of replacement of one cation with another of similar ionic radii and valence state Holtz and Kovacs [10].
Gypsum is one of the most common resources of Calcium cations together with lime and some other calcium based salts. Gypsum can improve soil structure by replacing sodium or other weak flocculator cations present in soil with calcium cations. Due to the flocculation of soil particles, a significant increase in strength and durability of soil is observed. Bagasse ash is a pozzolanic material. Pozzolanic materials are those siliceous and aluminous products which react with calcium hydroxide in the presence of moisture to form cementitious products.
Table 1. Relative flocculating power of major soil cations [18].
The main objective of this research is to evaluate the potential of gypsum and bagasse ash as soil stabilizers. The superiority gypsum and bagasse ash possess over other admixtures like cement, fly ash etc. Is their abundance and economic aspects. Gypsum is naturally occurring material and is available abundantly in Pakistan. Bagasse ash is a waste product produced by the sugar mills. Using these materials as soil stabilizers can provide an economic and efficient mean to improve soil properties.
2. Materials and Methodology
2.1. Materials
Two types of soil samples are used in this research, Low plastic clay, and high plastic clay. Low plastic clay was collected from Nandipur, Gujranwala, Pakistan.
Then bentonite was mixed with this soil to change its type to high plastic clay. After performing a series of Atterberg’s limits test, 25% of bentonite were selected as a suitable percentage to prepare highly plastic clay. Bentonite was provided by a local supplier, Ahmed Saeed & Company, Lahore and its product ID were Bentobest. It's high swelling sodium bentonite.
Materials used for stabilization of this soil were gypsum and bagasse ash. Gypsum used in the research was procured from DFB gypsum industries. It was 98% pure gypsum and its product ID was GypPlaster®.
Bagasse ash was collected from Baba Fareed Sugar Mills Ltd, Okara, Pakistan.
2.2. Methodology
The methodology adopted in this research consist of four phases. Low plastic clay is abbreviated as “CL” and High plastic clay as “CH”. All tests are performed according to ASTM guidelines.
Cation Charges per Molecule Hydrated Radius (nm) Relative Flocculating Power
Sodium 1 0.79 1.0
Potassium 1 0.53 1.7
Magnesium 2 1.08 27.0
Table 2. Properties of bentonite (Ahmed Saeed & company).
Table 3. Properties of gypsum (DFB Gypsum industries).
2.2.1. Phase I: properties of untreated soil
The first phase of this research consists of the determination of properties of untreated soil. Properties like in-situ density, in-situ moisture content, specific gravity, Atterberg`s Limits, Grain size distribution, compaction characteristics, Unconfined Compressive Strength UCS, California Bearing Ratio CBR, and one dimensional swell potential for both soils CL and CH are determined. Since CH was artificially prepared, so it was not possible to determine its in-situ density and moisture content. ASTM D2216-10 [4] was followed in the determination of in-situ moisture content and in-situ density of soil. Grain size distribution was carried out in accordance with ASTM D422-63 (2007) e2 [5]. The standard proctor test was used for the determination of compaction characteristics i.e. MDD and OMC as per ASTM D698-12e2 test method [7]. ASTM D2166 / D2166M-16 [3] was adopted for the determination of UCS of soils. Samples were prepared in a mold having 4cm internal diameter and 8cm height. Samples were placed in loading device and load, deformation and time readings were noted down at sufficient intervals to define the shape of the stress-strain curve. Maximum peak stress reached in the stress - strain curve was selected as the unconfined compressive strength of the soil sample. UCS was determined in both soaked and unsoaked conditions. ASTM D1883-99 test procedure [2] was followed in the determination of CBR of soil. CBR was determined by compacting samples at optimum moisture content. 75 blows were applied to each layer, sample preparation and testing was done as per ASTM standard. Samples were subjected to soaking for 96 hours and CBR and one-dimensional swell potential values were determined for CL and CH. ASTM D4546-14 guidelines [6] were followed for the determination of one-dimensional swell potential.
SiO2 50 – 60 %
Al2O3 15 – 20 %
Fe2O3 2 – 4 %
MgO 4 – 6 %
CaO 0.5 – 1 %
Na2O 0.9 – 1.9 %.
K2O 0.2 – 0.5 %
TiO2 0.2 – 0.5 %
Others 0.5 – 1 %
Moisture 5 – 10 %
Loss on Ignition 10 – 15 %
Swelling Above 12 times
Suspension Above 12 times
Water absorption 5 times
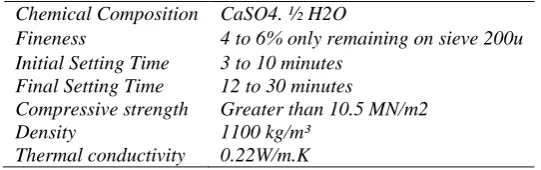
Chemical Composition CaSO4. ½ H2O
Fineness 4 to 6% only remaining on sieve 200u
Initial Setting Time 3 to 10 minutes Final Setting Time 12 to 30 minutes
Compressive strength Greater than 10.5 MN/m2
Density 1100 kg/m³
2.2.2. Phase II: optimization of gypsum content
The main criteria for Optimum gypsum content were that the content which gives maximum UCS value. First, standard proctor tests were performed by mixing 9%, 12%, 15%, and 18% gypsum, respective OMC and MDD were determined for both soils. Then UCS samples were prepared at OMC and MDD for each mix. Samples were cured for 7 days and tested. The curing period of 7 days was selected for this phase of research because the literature shows that the rate of gain of strength is maximum for the first 7 days of curing in gypsum stabilized soils. Gypsum percentage giving highest UCS was selected as the optimum gypsum content. Excess moisture is important for hydration process as well as for the reaction between soil and gypsum to proceed. So samples were prepared at 1%, 2% and, 3% moisture above OMC and tested after 7 days of curing.
2.2.3. Phase III: optimization of bagasse ash content
Similarly, the optimum percentage of bagasse ash was also determined. But first, it was important to verify the chemical composition of selected bagasse ash as per ASTM requirements for pozzolan materials. It was done by performing X-Ray fluorescence test on bagasse ash and its chemical composition was determined. OMC and MDD were determined by preparing samples of optimum gypsum content as determined in the previous phase for respective soils and 2%, 4%, 6%, and 8% Bagasse ash content. Then UCS was also determined by preparing samples at optimum gypsum and different bagasse ash contents. Optimum percentage of bagasse and optimum excess moisture percentage was selected on a similar basis as it’s done for optimum gypsum content.
2.2.4. Phase IV: properties of treated soil
After determining the optimum percentages of gypsum and bagasse ash, the next step was to determine the properties of soil by treating it with gypsum and bagasse ash. Engineering properties of soil like Atterberg’s limits, compaction characteristics, UCS, CBR and one dimensional swell potential of soil are determined and compared with those values of untreated soil.
3. Results and Discussions
3.1. Phase I: Properties of Untreated Soil
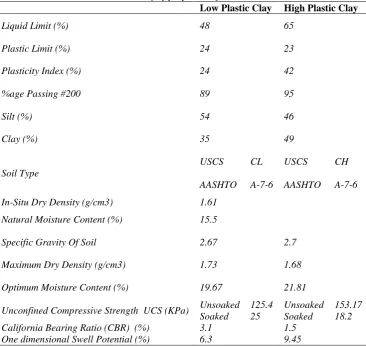
Table 4. Summary of properties of untreated soil.
From grain size distribution and Atterberg’s limits test data, Low plastic clay is classified as CL according to USCS system and A-7-6 as per AASHTO classification system, while classification for high plastic clay is CH and A-7-6 as per USCS and AASHTO classification system. Both of these soils have quite a high plasticity index, which makes them susceptible to swell and shrink on their contact with water. A significant drop in unconfined compressive strength is observed when soil is subjected to soaking, more than 87% strength is lost due to 48 hours soaking. It shows how poor the durability of the soil is. It is important to note that loss in strength for high plastic clay is more than that of Low plastic clay. So high plastic soils are more susceptible to failure in the wet season as compared to Low plastic clays. California bearing ratio CBR and one-dimensional swell potential values are also very poor and these must be improved.
3.2. Phase II: Optimization of Gypsum Content
Fig. 1 and Fig. 2 represent the variation of optimum moisture content OMC and maximum dry density MDD at various gypsum contents for CL and CH respectively. It is clear that the maximum change in the optimum moisture content OMC and maximum dry density MDD is observed at 12% gypsum level in CL and 15% gypsum level for CH.
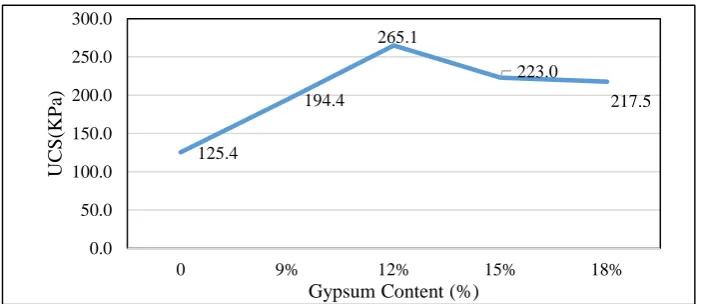
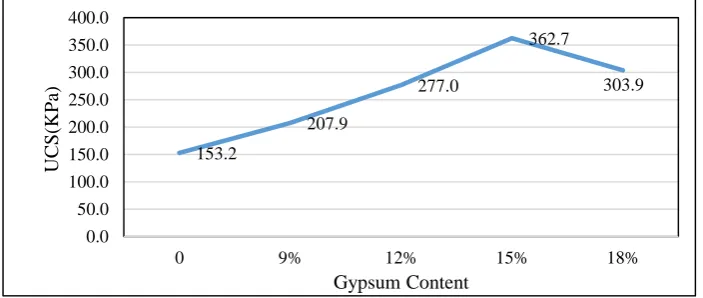
Fig. 3 and Fig. 4 indicate the UCS test results at various gypsum contents for CL and CH. Results indicate that the optimum percentage of gypsum is 12 percent for CL and 15% for CH.
Low Plastic Clay High Plastic Clay
Liquid Limit (%) 48 65
Plastic Limit (%) 24 23
Plasticity Index (%) 24 42
%age Passing #200 89 95
Silt (%) 54 46
Clay (%) 35 49
Soil Type
USCS CL USCS CH
AASHTO A-7-6 AASHTO A-7-6
In-Situ Dry Density (g/cm3) 1.61
Natural Moisture Content (%) 15.5
Specific Gravity Of Soil 2.67 2.7
Maximum Dry Density (g/cm3) 1.73 1.68
Optimum Moisture Content (%) 19.67 21.81
Unconfined Compressive Strength UCS (KPa) Unsoaked 125.4 Unsoaked 153.17
Soaked 25 Soaked 18.2
California Bearing Ratio (CBR) (%) 3.1 1.5
Fig. 1. Variation of OMC & MDD vs gypsum content for CL.
Fig. 2. Variation of OMC and MDD vs gypsum content for CH.
Fig. 3. UCS at various gypsum contents for CL.
1 4 7 10 13 16 19 22 25 28 1.55 1.6 1.65 1.7 1.75 1.8
0 9 12 15 18
OM C ( %) MDD ( g /cm 3 )
Gypsum Content (%)
Gypsum Content vs MDD Gypsum Content vs OMC 16 17 18 19 20 21 22 23 1.5 1.6 1.7 1.8 1.9 2 2.1 2.2
0 9 12 15 18
OM C ( %) MD D (g /cm 3 ) Gypsum (%)
Gypsum Content vs MDD Gypsum Content vs OMC
125.4 194.4 265.1 223.0 217.5 0.0 50.0 100.0 150.0 200.0 250.0 300.0
0 9% 12% 15% 18%
UC
S(K
P
a)
Fig. 4. UCS at various gypsum contents for CH.
The maximum change in compaction characteristics and UCS is observed at 12% and 15% gypsum content for CL and CH respectively. Stabilization process is actually related to the cementing between soil and admixture particles, which is dependent on the cation exchange capacity of the soil. Once the cation exchange capacity of soil is reached, no more admixture content is used for stabilization process. Instead, it starts reducing soil properties. That’s why maximum change is observed at 12% and 15% gypsum for CL and CH, respectively.
Next step was to determine the optimum value for moisture in excess to OMC which is required for hydration process and for the reaction between the soil and gypsum. Table 5 and Table 6 show that 1% and 2% is the optimum value for excess moisture for CL and CH.
Table 5. UCS at various excess moisture contents for CL.
Table 6. UCS at various excess moisture contents for CH.
3.3. Phase III: Optimization of Bagasse Ash Content
After the optimization of gypsum content, the next step is to optimize the percentage of bagasse ash for optimum results. Methodology carried out for this purpose is similar to as that for gypsum content optimization. First, the chemical composition of bagasse ash is verified as per ASTM requirements for
CL + 12 % Gypsum UCS KPa Psi
At OMC 265.1 38.4
1 % excess Moisture 291.6 42.3 2 % excess Moisture 283.6 41.1 3 % excess Moisture 236.3 34.3
CH + 15 % Gypsum UCS KPa Psi
At OMC 352.0 52.6
1 % excess Moisture 388.1 56.3 2 % excess Moisture 399.0 57.9 3 % excess Moisture 391.8 56.8
153.2
207.9
277.0
362.7
303.9
0.0 50.0 100.0 150.0 200.0 250.0 300.0 350.0 400.0
0 9% 12% 15% 18%
UC
S(K
P
a)
the pozzolanic material. Table 7 shows the chemical composition of bagasse ash and corresponding requirements as per ASTM standard.
Table 7. Chemical composition of bagasse ash.
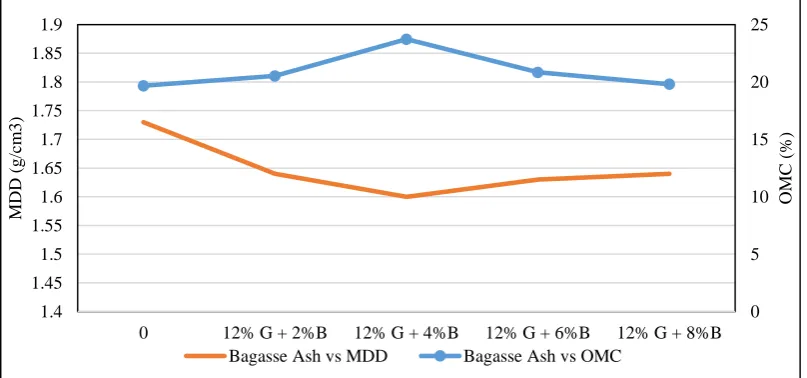
Once, the chemical composition of bagasse ash is verified, optimum moisture content OMC and maximum dry density MDD of soil samples with optimum gypsum content and various bagasse ash contents 2%, 4%, 6%, and 8% is determined. Fig. 5 and Fig. 6 represent the variation in the OMC and MDD vs optimum gypsum and various bagasse ash contents for CL and CH. The maximum change in the OMC and MDD is observed at 4% and 6% bagasse ash level for CL and CH, respectively.
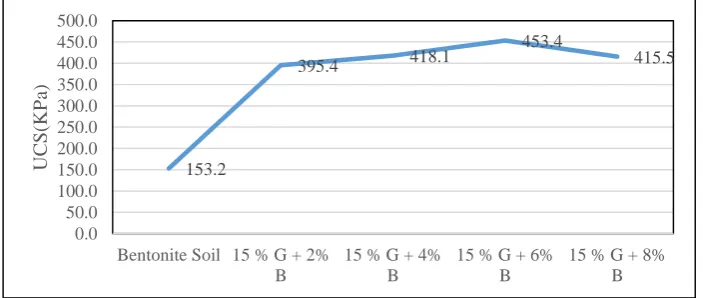
4% and 6% bagasse ash was verified as optimized content for CL and CH respectively when UCS tests were carried out. Fig. 7 and Fig. 8 show the unconfined compressive strength at various bagasse ash contents.
Fig. 5. Variation of OMC and MDD vs optimum gypsum and various bagasse ash content for CL.
Constitute Percentage ASTM C-618 Requirement
Silicon Dioxide, (SiO2) 60.58
Minimum 70% Aluminum Oxide, (Al2O3) 25.4
Ferric Oxide, (Fe2O3) 2.91
Calcium Oxide, (CaO) 1.42 4% maximum
Magnesium Oxide, (MgO) 3.21 4% maximum
Sulfur Trioxide, (SO3) 0.95 4% maximum
Potassium Oxide, (K2O) 3.5 4% maximum
Moisture Content 2.58 3% maximum
Loss on Ignition 2.81 10% maximum
0 5 10 15 20 25
1.4 1.45 1.5 1.55 1.6 1.65 1.7 1.75 1.8 1.85 1.9
0 12% G + 2%B 12% G + 4%B 12% G + 6%B 12% G + 8%B
OMC
(%
)
M
DD
(g
/cm
3
)
Fig. 6. Variation of OMC and MDD vs optimum gypsum and various bagasse ash content for CH.
Fig. 7. UCS at optimum gypsum and various bagasse ash contents for CL.
Fig. 8. UCS at optimum gypsum and various bagasse ash contents for CH.
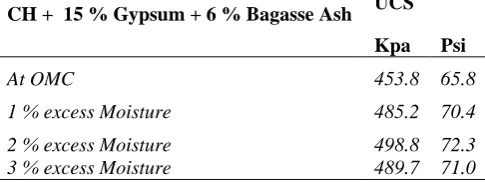
Excess moisture required for hydration process is also optimized in the similar fashion as it is done for optimum gypsum content. Table 8 and Table 9 show the variation of unconfined compressive strength with various excess moistures.
20.5 21 21.5 22 22.5 23 23.5 24 1.5 1.6 1.7 1.8 1.9 2 2.1 2.2 2.3 2.4 2.5
0 12% G + 2%B 12% G + 4%B 12% G + 6%B 12% G + 8%B
O M C (%) MD D (g /cm 3 )
Bagasse Ash vs MDD Bagasse Ash vs OMC
125.4 279.8 358.7 316.3 313.9 0.0 50.0 100.0 150.0 200.0 250.0 300.0 350.0 400.0
Soil 12 % G + 2% B12 % G + 4% B12 % G + 6% B12 % G + 8% B
UC S(K P a) 153.2 395.4 418.1 453.4 415.5 0.0 50.0 100.0 150.0 200.0 250.0 300.0 350.0 400.0 450.0 500.0
Bentonite Soil 15 % G + 2% B
15 % G + 4% B
15 % G + 6% B
15 % G + 8% B
UC
S(K
P
Table 8. UCS at various excess moisture contents for CL.
Table 9. UCS at various excess moisture contents for CH.
3.4. Phase IV: Properties of Treated Soil
After finding the optimum contents for gypsum and bagasse ash, the next step was to determine engineering properties of soil in treating a form with gypsum and bagasse ash and evaluate the potential of gypsum and bagasse ash soil stabilizers.
Table 10 and Table 11 represent the relationship between LL, PL, Cation exchange capacity CEC, and percentage swell of CL and CH, respectively when soil is stabilized with gypsum and bagasse ash. Plastic Limit, PL remained almost constant in all cases, but a significant drop in Liquid Limit LL and consequently in Plasticity Index PI was observed for both CL and CH. The reduction in Liquid Limit and Plasticity Index is due to the flocculation and agglomeration of soil particles, the particle size of soil is increased, the soil becomes more friable, tends to behave more silt like and plasticity of soil is reduced.
Table 10. Atterberg’s limits of treated CL.
Note 1: * CEC is determined by using empirical correlation of Yilmaz [21].
Note 2: ** Swell is determined by using empirical correlation of Seed and Lundgren [19].
CL + 12% Gypsum + 4 % Bagasse Ash UCS KPa Psi
At OMC 358.7 52.0
1% excess Moisture 394.6 57.2
2% excess Moisture 383.8 55.7
3% excess Moisture 376.7 54.6
CH + 15 % Gypsum + 6 % Bagasse Ash UCS Kpa Psi
At OMC 453.8 65.8
1 % excess Moisture 485.2 70.4
2 % excess Moisture 498.8 72.3
3 % excess Moisture 489.7 71.0
Sample LL PL PI CEC (meq/100g) * Swell (%) **
CL 48 24 24 36 5.04
CL +12% Gypsum 40 24 16 31 1.87
Table 11. Atterberg’s limits of treated CH.
Note 1: * CEC is determined by using empirical correlation of Yilmaz [21].
Note 2: ** Swell is determined by using empirical correlation of Seed and Lundgren [19].
Cation Exchange Capacity and free swell for both soils is also determined by using empirical correlations provided by Yilmaz [21] and Seed and Lundgren [19]. Sufficient reduction in cation exchange capacity and swell potential of soil is observed as the soil is treated with gypsum and bagasse ash.
Variation of compaction characteristics for CL and CH is shown in Fig. 1, Fig. 2, Fig. 5, and Fig. 6. These results indicate the effect of individual gypsum as well as a combination of gypsum and bagasse ash on OMC and MDD. Compaction test results on these soils indicate a gradual decrease in maximum dry density of soil with an increase in admixture content (gypsum and bagasse ash) up to a certain percentage. After that percentage content, MDD starts to increase and OMC starts to decrease. With the increase in admixture content the electrolyte concentration of the pore water increases, leading to reduced thickness of the double layer. As a result of which the clay particles move closer and the vendor walls attraction becomes predominant producing flocculation. These flocculated particles occupy larger spaces which reduce the dry density of soil. It is also due to the development of coating of soil particles by admixture which forms large sized particles. On the other hand, the optimum moisture content of soil increases with increase in admixture content. This is due to the reason that gypsum and bagasse ash are finer than soil. The finer the material is, larger will be its surface area and more water will be required for the lubrication of these particles. Moreover, gypsum and bagasse ash also reduces the amount of free silt and clay fraction forming coarser materials which occupy larger spaces for retaining water. This flocculated structure of the clay matrix effectively resists the compaction effort, giving rise to lower density and higher moisture content. The increase in water content is also attributed to the pozzolanic activity between gypsum, bagasse ash, and soil particles. With further increase in admixture content the concentration of cations increases near to the negatively charged clay surfaces. This difference of charge concentration leads to osmosis. Since the ions are under influence of charge on clay surface, they are restrained against diffusion, the water molecules diffuse towards the clay surface to equalize the charge concentration. This leads to separation of clay particles that produces more dispersed soil structure, thereby permits the particles to slide part over each other in a more oriented and denser matrix. Therefore, an increase in MDD coupled with a decrease in OMC is observed.
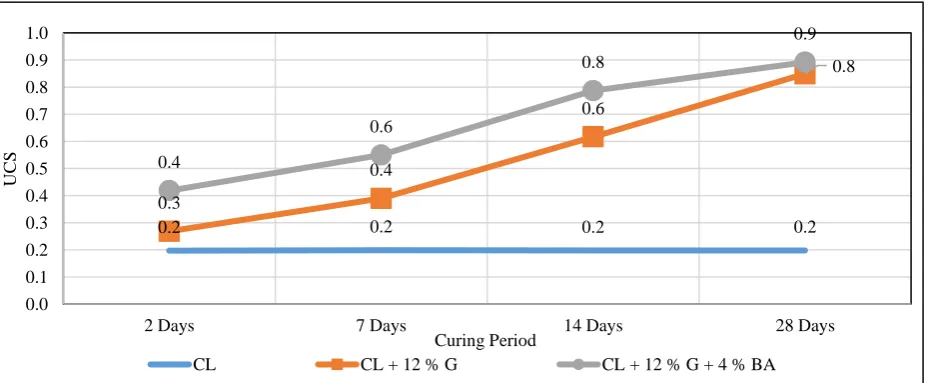
UCS tests are performed at 2, 7, 14, and 28 Days of curing in both soaked and unsoaked conditions. Test results for both Low plastic and highly plastic clay are shown in Fig. 9 to Fig. 14.
Sample LL PL PI CEC (meq/100g) * Swell (%) **
CH 65 23 42 51 19.7
CH +15% Gypsum 60 24 36 46 13.5
Fig. 9. UCS (unsoaked) comparison at various curing periods for CL.
Fig. 10. UCS (soaked) comparison at various curing periods for CL.
Fig. 11. UCS (soaked/unsoaked) at various curing periods for CL.
124.1 125.4 127.2 127.4
147.6 291.6 359.0 529.8 195.1 394.6 526.2 752.4 0.0 100.0 200.0 300.0 400.0 500.0 600.0 700.0 800.0
2 Days 7 Days 14 Days 28 Days
U CS (K P a) Curing Period
CL CL + 12 % G CL + 12% G + 4% BA
24.5 25.0 25.2 25.3
39.7 113.7 221.4 450.0 81.7 217.0 414.3 671.4 0.0 100.0 200.0 300.0 400.0 500.0 600.0 700.0 800.0
2 Days 7 Days 14 Days 28 Days
UCS
(KP
a)
Curing Period
CL CL + 12 % G CL + 12 % G + 4 % BA
0.2 0.2 0.2 0.2
0.3 0.4 0.6 0.8 0.4 0.6 0.8 0.9 0.0 0.1 0.2 0.3 0.4 0.5 0.6 0.7 0.8 0.9 1.0
2 Days 7 Days 14 Days 28 Days
UCS
Curing Period
Fig. 12. UCS (unsoaked) comparison at various curing periods for CH.
Fig. 13. UCS (soaked) comparison at various curing periods for CH.
Fig. 14. UCS (soaked/unsoaked) comparison at various curing periods for CH.
150.21 153.17 153.90 154.21
230.16
399.01
488.10
584.52
302.58
498.75
578.33
682.54
0.00 100.00 200.00 300.00 400.00 500.00 600.00 700.00 800.00
2 Days 7 Days 14 Days 28 Days
UCS
(KP
a)
Curing Period
CH CH + 15 % G CH + 15 G +6% BA
18.10 18.20 18.15 19.00
61.90
139.65
253.97
453.97
98.41
269.33
405.95
593.25
0.00 100.00 200.00 300.00 400.00 500.00 600.00 700.00
2 Days 7 Days 14 Days 28 Days
UCS
(KP
a)
Curing Period
CH CH + 15 % G CH + 15 G +6% BA
0.12 0.12 0.12 0.12
0.27
0.35
0.52
0.78
0.33
0.54
0.70
0.87
0.00 0.20 0.40 0.60 0.80 1.00
2 Days 7 Days 14 Days 28 Days
UCS
Curing Period
Unconfined compressive strength test results for both Low and high plastic clays show a significant improvement in the compressive strength of treated soil as compared to untreated soil. The improvement is more significant when we compare the ratio soaked strength to unsoaked strength of treated and untreated soils. The results indicate that gypsum and bagasse ash significantly improve the compressive strength of soil. This improvement is due to the pozzolanic reaction between soil, gypsum and bagasse ash. Cementitious products are formed as a result of this pozzolanic activity which increases the strength of soil.
California bearing ratio and one dimensional swell potential of treated and untreated soils are determined. CBR and swell potential values for CL and CH are shown in Table 12 and Table 13 respectively. Test results indicate that significant improvement is observed in CBR and one-dimensional swell of both CL and CH when these soils are treated with gypsum and bagasse ash as compared to untreated soil. This improvement is associated with cation exchange and pozzolanic reaction between soil, gypsum and bagasse ash particles.
Table 12. CBR and swell potential of CL.
Table 13. CBR and swell potential of CH.
4. Conclusions and Recommendations
The main objective of this study was to evaluate the potential and efficiency of gypsum and bagasse ash as soil stabilizing agent. The following conclusions are made on the basis of test results. A decrease in liquid limit and plasticity index was observed when gypsum and bagasse ash were added to the Low plastic and highly plastic clay. This decrease was more significant when gypsum and bagasse ash were used as a combination as compared to the individual effect of gypsum. This change is associated with the flocculation and agglomeration of soil particles caused due to the addition of gypsum and bagasse ash. This improvement changes the behavior of soil from clay to silt like. Maximum dry density is decreased by the addition and gypsum and bagasse ash while an increase in the optimum moisture content of soil is observed up to a certain percentage of admixture content. Decrease in dry density is due to flocculation of soil particles. The soil becomes more friable and difficult to compact. While the increase in optimum moisture content is due to the increased surface area of soil particles due to the addition of gypsum and bagasse ash which are finer particles. The higher surface area, more water is required for wetting of soil particles. At admixture content larger than optimum values, maximum dry density starts to increase and optimum moisture content starts to decrease. This disparity in results is attributed to the fact the soil structure tends to become dispersed at higher admixture content resulting
CBR Swell
CL 3.1 6.30
CL+ 12% Gypsum 6.6 2.05
CL + 12% Gypsum +4% Ash 9.1 0.95
CBR Swell
CH 1.5 9.45
CH + 15% Gypsum 2.4 0.98
in increase in maximum dry density and decrease in optimum moisture content. There is a significant improvement of unconfined compressive strength of soil with the addition of gypsum and bagasse ash for both Low plastic (natural soil) and high plastic (bentonite soil mix). Unconfined compressive strength increases up to an optimum percentage of admixture and then starts to decrease. This variation is attributed to the change of soil structure from flocculated to disperse beyond the optimum percentage of admixture. Moreover, the optimum moisture content is also increasing. Therefore, contributing to the decrease in unconfined compressive strength. The durability of the soil improved dramatically for treated soils. The loss in strength due to soaking for treated soil was significantly low as compared to untreated soil. This improvement in unconfined compressive strength is associated with the pozzolanic reaction between soil, gypsum and bagasse ash, which result in the formation of cementitious products. The California bearing ratio of the soil was improved almost 3 times for treated soil as compared to untreated soil. Whereas one-dimensional swell potential was reduced to less than 1% for treated soil. So a sufficient improvement in California bearing ratio and one-dimensional swell potential was observed with the addition of gypsum and bagasse ash. On the basis of the results obtained, it can be concluded that gypsum and bagasse ash can be efficiently used for the stabilization and improvement of Low plastic and high plastic clay soils. The improvement is more prominent when a combination of gypsum and bagasse ash is used as compared to the gypsum alone. Gypsum and bagasse ash can be better alternatives for admixtures like cement, lime, fly ash and rice husk ash etc. Because of their abundance and relatively lesser cost.
The recommendations have been made for future research. The high plastic clay used in this research was artificially prepared by mixing bentonite with Low plastic clay. It is recommended to use naturally available high plastic clay. The California bearing ratio was determined using one point CBR test by preparing samples at optimum moisture content and maximum dry density as determined in standard proctor test. The recommendation is to determine CBR value for a range of moisture contents and dry densities. One dimensional swell was taken into consideration for this research. The overall free swell of the soil should also be determined. The composition of Agro-based waste products varies with soil (due to the silica available in the soil). Effort should be made to compare the bagasse ash from various sources all over the country to standardize its use as a pozzolan in soil stabilization. The present study focused on some basic Geotechnical properties of soil i.e. Index properties, compaction characteristics, UCS, CBR and swell potential of the soil. It is recommended for future research to study the effect of gypsum and bagasse ash on shear strength parameters of soil as well. The efficiency of a combination of gypsum with other pozzolanic materials i.e. Rice husk ash, etc. Can also be checked to measure its suitability for the soil stabilization. Since the combination of gypsum and bagasse ash produces cementitious products, so it can also help improve the properties of granular soil especially those rich in silt content. Future study can also be done to check the suitability of gypsum and bagasse ash for improvement of granular soils.
References
[1] Alavéz-Ramírez, R., Montes-García, P., Martínez-Reyes, J., Altamirano-Juárez, D. C., & Gochi-Ponce,
Y. (2012). The use of sugarcane bagasse ash and lime to improve the durability and mechanical properties
of compacted soil blocks. Construction and building materials, 34, 296-305. doi:
10.1016/j.conbuildmat.2012.02.072
[2] ASTM D1883-99. (n.d.). Standard test method for cbr (california bearing ratio) of
laboratory-compacted soil. Retrieved from http://www.astm.org/cgi-bin/resolver.cgi?D1883-99
[3] ASTM D2166 / D2166M-16. (n.d.). Standard test method for unconfined compressive strength of
cohesive soil. Retrieved from http://www.astm.org/cgi-bin/resolver.cgi?D2166D2166M-13
[4] ASTM D2216-10. (n.d.). Standard test methods for laboratory determination of water (moisture) content
[5] ASTM D422-63 (2007) e2. (2016). Standard test method for particle-size analysis of soils (Withdrawn 2016). Retrieved from http://www.astm.org/cgi-bin/resolver.cgi?D422-63(2007)e2
[6] ASTM D4546-14. (n.d.). Standard test methods for one-dimensional swell or collapse of soils. Retrieved
from http://www.astm.org/cgi-bin/resolver.cgi?D4546-14e1
[7] ASTM D698-12e2. (n.d.). Standard test methods for laboratory compaction characteristics of soil using
standard effort (12 400 ft-lbf/ft3 (600 kn-m/m3)). Retrieved from http://www.astm.org/cgi-bin/resolver.cgi?D698-12e2
[8] ASTM D7928-17. (n.d.). Standard test method for particle-size distribution (gradation) of fine-grained
soils using the sedimentation (hydrometer) analysis. Retrieved from http://www.astm.org/cgi-bin/resolver.cgi?D7928-17
[9] Basha, E. A., Hashim, R., Mahmud, H. B., & Muntohar, A. S. (2005). Stabilization of residual soil with
rice husk ash and cement. Construction and building materials, 19 (6), 448-453.
doi:10.1016/j.conbuildmat.2004.08.001
[10]Holtz, R. D., & Kovacs, W. D. (1981). An introduction to geotechnical engineering (No. Monograph).
Prentice Hall, Englewood.
[11]Jones, D. E., & Holtz, W. G. (1973). Expansive soils -- the hidden disaster. Emmitsburg, MD: National
Emergency Training Center.
[12]Kolay, P. K., & Pui, M. P. (2010). Peat stabilization using gypsum and fly ash. UNIMAS E-journal of
civil engineering, 1 (2)
[13]Negi, A. S., Faizan, M., Siddharth, D. P., & Singh, R. (2013). Soil stabilization using lime. International
journal of innovative research in science, engineering and technology, 2(2), 448-453.
[14]Nsaif, A. L. M. H. (2013). The behavior of soils strengthened by plastic waste materials. Journal of
engineering and development, 17 (4).
[15]Osinubi, K. J., Bafyau, V., & Eberemu, A. O. (2009). Bagasse ash stabilization of lateritic soil.
In Appropriate technologies for environmental protection in the developing world (pp. 271-280). Springer Netherlands
[16]Rajakumaran, K. (2015). An experimental analysis on stabilization of expansive soil with steel slag and
fly ash. International journal of advances in engineering & technology, 7 (6), 1745.
[17]Jamsawang, P., Poorahong, H., Yoobanpot, N., Songpiriyakij, S., & Jongpradist, P. (2017). Improvement
of soft clay with cement and bagasse ash waste. Construction and building materials, 154, 61-71
[18]Rengasamy P., & Sumner, M. E. (1998). Processes involved in sodic behavior. In Sodic soils,
distribution, properties, management, and environmental consequences, M. E. Sumner & R. Naidu (Eds.), pp. 35-50. New York Press, New York.
[19]Seed, H. B., & Lundgren, R. (1962). Prediction of swelling potential for compacted clays. Journal of the
soil mechanics and foundations division, 88(3), 53-88.
[20]Walworth, J. (2012). Using gypsum and other calcium amendments in southwestern soils. Publication
AZ1413, College of Agriculture and Life Sciences, University of Arizona.
[21]Yilmaz, I. (2004). Relationships between liquid limit, cation exchange capacity, and swelling potentials
of clayey soils. Eurasian soil science, 37(5), 506-512.
[22]Rajeswari, K., Naidu, C. D., Rao, K. B., & Kumari, G. H. (2018). Study of soil stabalization on subgrade
![Table 1. Relative flocculating power of major soil cations [18].](https://thumb-us.123doks.com/thumbv2/123dok_us/8578389.1718329/3.595.92.502.89.154/table-relative-flocculating-power-major-soil-cations.webp)