Management Of Large Scale Osmotic Dehydration
Solution Using The Pearson’s Square Algorithm
Oladejo Duduyemi, P.O. Ngoddy, B.I.O. Ade-Omowaye
ABSTRACT: Osmotic dehydration is a widely researched and advantageous pre-treatment process in food preservation but has not enjoyed industrial acceptance because if its highly concentrated and voluminous effluent. The Pearson’s square algorithm was employed to give a focussed attack to the problem by developing a user-friendly template for reconstituting effluents for recycling purposes using Java script programme. Outflow from a pilot scale plant was reactivated and introduced into a scheme of operation for continuous OD of fruits and vegetables. Screened and re-concentrated effluent were subjected to statistical analysis in comparison to initial concentrations solution at confidence limit of (p<0.05). The template proven to be an adequate representation of the Pearson’s square algorithm, it is sufficiently good in reconstituting used osmotic solutions for repetitive usage. This protocol if adopted in the industry is not only environmentally friendly but also promises significant economic improvement of OD process. Application: Recycling of non-reacting media and as a template for automation in continuous OD processing.
Key words: Algorithm, osmolite, re-concentration, effluent, osmotic dehydration and recycling.
————————————————————
1. INTRODUCTION
The edible portions of fruits and vegetables supply nutrients of considerable value in the human diet. As biological structures, fruits and vegetables are prone to rapid deterioration by way of physiological processes called senescence or ageing [1]. Osmotic dehydration (OD) is an effective technique for the partial removal of water to obtain significant increase in their shelf-life by immersion in aqueous solutions of high osmotic pressure such as sugar and salt [2]. OD is used as pre-treatment to conventional air drying and not only removes water from the food, but also reduces the depletion of aroma [3]. It inhibits the growth of microorganisms and reduces the rate of degradation reactions [4]; it prevents microbial attacks [5] and lowers energy consumption [6, 7]. This technique is a partial dehydration process that gives the product quality enhancement over conventional drying processes [8]. OD is based on the difference between the concentration potential of moisture in plant cell on the one hand, and that of the chosen osmotic solution on the other.
Most laboratory batch scale studies on OD have recommended an excess solution liquor ratio to ensure negligible variation in the solution composition to make interpretation and modelling processes easier [9]. The re-concentration of spent solutions was reported to increase organoleptic quality of food [10]. However it has not enjoyed industrial acceptance owing in part to the dearth of knowledge in the design and principles underpinning the maintenance of the characteristically large quantity of the associated osmolite which poses both environmental and economic problems [11]. Although this practice has potential advantages, it poses the problems of handling large volumes of process liquid, the high cost of wasted solute as well as negative impact of the discharge. Other problems posed by the potential transfer of soluble and insoluble materials in the osmotic media arise as follows: (i) modification of solution properties (pH, water activity and viscosity), (ii) changes in sensory properties (mainly colour and flavour) and (iii) increase in organic components able to act as substrate for microbial growth. These constraints and their negative impacts have limited the adoption of OD for industrial application. The adoption of OD for industrial production processes is hindered by problems associated with the overall management of the concentrated solutions. In fact, there are recognised practical aspects that make the management and control of osmotic solutions a prime bottleneck of the OD process [12]. Techniques that separate the solution from particles by continuous filtration are required in a continuous plant is a necessity [13].The onus of managing osmotic solutions such as reactivation of spent stream by clarification, concentration and re-introduction for re-cycling remains a far-fetch goal. The increase in water loss is related to increase in osmotic solution concentration until equilibrium and consequent dilution of the osmotic solution [14]. Water activity of the osmotic solution has also been reported to decrease with increased solute concentration [15], [16]. Therefore, re-concentration would decrease water activity of the osmotic solution for further effective dehydration by imposing higher osmotic pressure difference. Osmotically dehydrated products for industrial application require appropriate manufacturing procedures at the industrial level [17]. The aim of this paper is to describe and develop the Pearson’s square algorithm as a possible tool for the management of osmotic solution for industrial use. The Pearson’s square _________________________________
Oladejo Duduyemi, P.O. Ngoddy, B.I.O. Ade-Omowaye
Department of Chemical and Polymer Engineering, Lagos State University, Epe campus, Lagos, Nigeria. Departmentof Food Science and Technology,
University of Nigeria, Nsukka, Nigeria.
Department of Food Science and Engineering Ladoke Akintola University of Technology, Ogbomoso, Nigeria.
54 algorithm uses interpolation as the basis for calculating
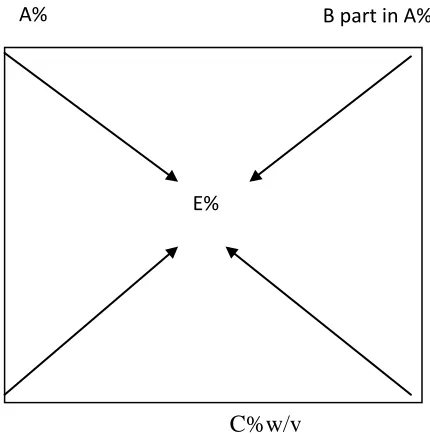
required make-up volumes and concentrations of spent solution for re-use. The theory proposes effective solution concentration limits that could be reconstituted from highly concentrated and diluted species, provided that there are no reactions as in the case of osmotic solutions as illustrated in Fig. 1.
Figure 1: Schematic illustration of the Pearson’s square
Algorithm.
Where: A% is the spent solution concentration in w/v, C% is the concentrated solution in w/v and E% (w/v) represents the required bath strength. The B part is the quantity of concentrated solution above E value while D1 and D2 represent the differences between (E–A) and (C-E) concentrations respectively representing the effective range of sucrose concentration. The required is calculated as D1 of E for every B part of the used bath liquor. Hence, the addition of B and D1 parts with respect to their volume and concentrations gives the full bath requirement.
3. MATERIALS AND METHODS
3.1 Vegetal Material:
Fresh fruit mango (Mangifera indica L.) obtained from a local farm were washed and kept in a cool dry place. The fruits were sliced to 20mm thick slabs and diced into cube-pieces of approximately 20mm in length. Hypertonic solution of granulated sugar purchased from a local shop was prepared into ten concentrations between 40 and 65 (wt/wt%). The sucrose solution concentration was checked using (Bellingham and Stanley, Kent) RFM 100 Refractometer in degree Brix (oBx). Osmotic dehydration of the samples was carried out in the hypertonic solution at ambient temperature of 25 ± 0.5 oC. All analytical measurements were carried out in accordance with [18]. Processing conditions regarding stirring intensity, duration and frequency, were the same for all the media and suspended particles were eliminated by filtration. The
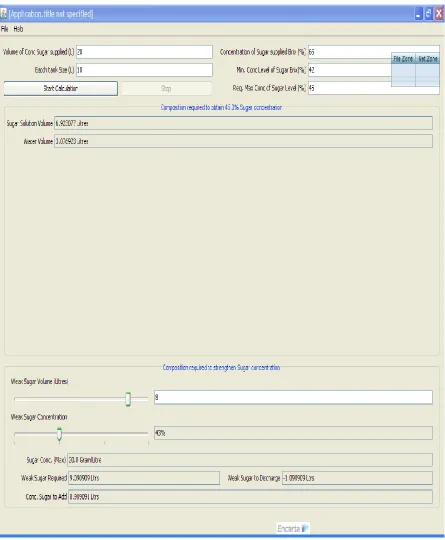
volumes and concentrations of spent syrup measured were recorded. Pearson’s Square algorithm was adopted to address the constraints of repeated manual calculations for re-concentration purposes. This had posed low-level industrial acceptability of OD processes. It was developed into an interactive computer-user interface/template in Java script based on the theories. A crop of the template of the Pearson’s square algorithm interface is shown in Fig. 2. Using the template, the efficiency of the Pearson’s algorithm was validated with spent osmotic solutions from a pilot plant used in a continuous osmotic dehydration of mango samples as illustrated in Fig 3. The requirement for the re-concentration of used effluent was evaluated on the template and measured conventionally to reconstitute processing liquor to the initial syrup concentration. The initial and re-constituted sucrose solutions were measured and compared. The application required fixing the respective data as indicated on the template. A referenced 65 oBx concentrated sucrose was prepared in the 20L stirred tank 1. The desired volume of solution in the contactor is determined by the choice of sample to liquor ratio in this assay 1:20. Predetermined concentration of 43.5±1.5 oBx required for the OD process were fixed as upper and lower limits of 45 and 42 respectively. The measured concentrations and volumes of spent sucrose solution after OD were measured and also fixed. The programme automatically calculated the make-up requirements for re-constituting spent liquors from several repeated experiments. After the operation in the pilot plant, average compositions of re-constituted solutions were compared with the initial sucrose concentration and statistically analysed at a significance level of 95 % (p<0.05) using Origin 6.1 statistical software. In further assay, osmotic solutions at the preliminary stage of determining optimal operating condition for the pilot plant were also reconstituted for appropriate comparison.
B part in A%
E%
A%
D1 , D2 parts
56 Tap 4 Mixer
111 Tap1 Tap 2
Flow meter
Tap3
Sampler
Pump 1
Pump 2
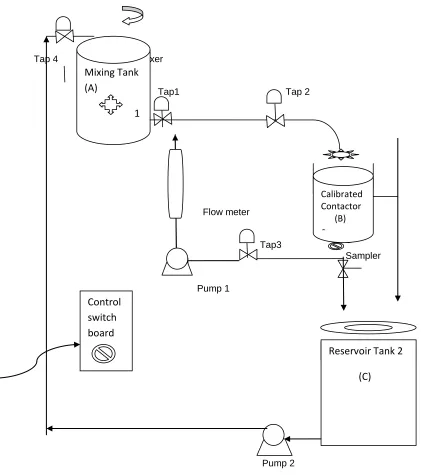
Figure 3: The sketch of the pilot plant set-up for the application of Pearson’s square algorithm
Plate 1: Pictorial view of the fabricated pilot plant
4. RESULTS AND DISCUSSION
An apparent reduction in concentration and volume of sucrose solution was observed during OD process for all samples except at high concentrations and temperatures above 45 oC which were observed to have higher concentrations than their initial composition. This is attributable to increased osmotic and vapour pressures as the concentrations increased. The operating temperatures coupled with continuous agitation, resulted in loss of more water by evaporation than osmotic dehydration from samples. Residual sucrose concentrations measured by refractometer RFM100 and re-constituted with the aid of the
interface compared favourably with the initial sucrose concentrations. Detailed measurement of volumes and concentrations of the initial and final sucrose concentrations is presented in Table 1.
Mixing Tank
(A)
1
Calibrated Contactor (B)
c
Reservoir Tank 2
(C)
Control
TABLE 1: Experimental validation of reconstituted sucrose by Pearson’s square algorithm
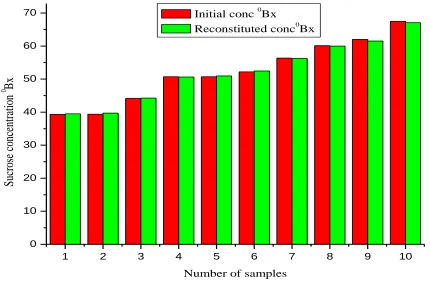
The concentrations and volumes of initial and spent sucrose solutions measured, subjected to one-way analysis of variance (ANOVA) is presented in Table 2 to validate the significance of Pearson’s algorithm. The mean of each column was 52.23 with variance of 89.79 and 87.66, respectively. At the p<0.05 level of significance, the means are not significantly different. Sucrose re-concentration using the algorithm produced an adequate sucrose
concentration fit for re-use and re-cycling in subsequent osmotic treatments after clarification by screening. A comparison of the two results is described in a bar chart Fig. 3. Therefore, the Pearson’s square algorithm is a reliable tool for re-concentration of used sucrose solution, with a view to recycling it in subsequent osmotic dehydration operations.
Table 2: One-Way ANOVA of fresh and simulated sucrose concentrations for recycling
Data No of samples Mean (%) Variance Test
Fresh 10 52.24 89.79 F = 6.89661E-6
Simulated 10 52.23 85.66 p = 0.99793
Where F is Fischer’s no and p is the probability. At the 0.05 level of significance, the means are NOT significantly different.
Figure 4: Bar-chart for fresh and reconstituted sucrose concentrations for re-use.
1 2 3 4 5 6 7 8 9 10
0 10 20 30 40 50 60 70
Suc
ro
se
c
onc
entr
ati
on
0
Bx
Number of samples Initial conc 0Bx
Reconstituted conc0Bx
S/N Initial conc (oBx)
Spent conc (o Bx)
Calc. vol. of used soln (ml)
Calc. vol. of initial conc (ml)
Final conc (o Bx)
1 39.34 35.91 45.59 4.41 39.49
2 39.36 36.93 45.45 4.55 39.69
3 44.14 39.01 41.94 8.06 44.24
4 50.72 49.54 47.50 2.50 50.62
5 50.73 39.68 31.67 18.33 50.94
6 52.18 48.41 40.91 9.09 52.43
7 56.35 47.19 29.70 20.30 56.27
8 60.10 50.62 26.05 23.95 59.99
9 62.00 57.66 33.33 16.67 61.53
58
5. CONCLUSION
The re-concentration and recycling of sucrose effluent in continuous operations of the pilot plant was enhanced. It gave insight into feedback control scenarios of the osmotic transport system necessary for the wider adoption of osmotic dehydration in the food industry. The Pearson’s square template developed is also a useful tool for automation and integration of continuous osmotic dehydration processing of fruits in food processing industry. The concept is also applicable to processes of non-reacting effluent compositions for reconstitution.
6. REFERENCES
[1] Jangam, Chung and Mujumdar, (2010). Jangam, S.V. Chung C.L and Mujumdar, A.S (2010). Drying of Foods, Vegetables and Fruits Vol. 1.
[2] Pandharipande SL, Saurav P, Ankit SS. (2012). ―Modeling of Osmotic Dehydration Kinetics of Banana Slices using Artificial Neural Network, International Journal of Computer Applications 48 (3),26- 31.
[3] Moazzam R. K. (2012). Osmotic dehydration technique for fruits preservation-A review. Pakistan Journal of Food Sciences (2012), Volume 22, Issue 2, Page(s): 71‐85
[4] Mujumdar, A. S. (1997). Drying fundamentals. In C. G. J. Baker (Ed.),Industrial Drying of Foods (pp. 7– 30). London: Blackie Academic and Professional. Mujumda, 2004
[5] García-Martínez E., Martínez-Monzó J., Camacho M. M., Martínez-Navarrete N., 2002 B. Characterisation of reused osmotic solution as ingredient in new product formulation, Food Research International, 35 307-313.
[6] Derossi A., Severini C. and Cassi D. (2010). Mass Transfer Mechanisms during Dehydration of Vegetable Food Traditional and Innovative Approach-Advanced Mass Transfer Pg 305 -353. [7] Hui, Y.H., Clary, C., Farid, M., Fasina, O.,
Noomhorm, A., Welti-Chanes, J., (2007). Food Drying Science and Technology. Destech Publications Inc.
[8] Chen, X.D. & Mujumdar, A.S. 2008. Drying Technologies In Food Processing. Wiley-Blackwell, West Sussex, United Kingdom.
[9] Raoult-Wack, A. L. Recent advances in the osmotic dehydration of foods. Trends in Food Science and Technology, Vol. 5, No. 8, 1994, pp. 255-260. Raoult-Wack, 1994.
[10]Warczok, J., Ferrando M, Lopenz F, Pihlajamaki A and Guell C. (2006). Reconcentration of spent solutions from osmotic dehydration using direct osmosis in two configurations. Journal of food engineering 80:317-326.
[11]Duduyemi, O., Ade-Omowaye, B.I.O. and Ngoddy, P. O. (2013b). Effects of Agitation by Convective Liquid Impingement on Osmotic Dehydration of Carrot Disk in a Semi-Continuous Operation. International Journal of Engineering Research & Technology Vol. 2 Issue 12.
[12]Cataldo A., Cannazza G , De Benedetto E, Severini C., Derossi A. (2011) An alternative method for the industrial monitoring of osmotic solution during dehydration of fruit and vegetables: A test-case for tomatoes. Journal of Food Engineering 105 pp 186–192.
[13]Dalla Rouza, M. and Giroux, F. (2001). Osmotic treatment (OT) and problems related to the solution management. Journal of Food Engineering, 49:223-236.
[14]Tortoe C, Orchard J, Beezer A (2011). Multilinear Regression Approach in Predicting Osmo-Dehydration Processes of Apple, Banana and Potato. J Food Process Technolology, Volume 5 issue 2:122.
[15]Tortoe Charles (2010). A review of osmodehydration for food industry African Journal of Food Science Vol. 4(6), pp. 303 – 324.
[16]Falade K.O., Igbeka J.C., Ayanwuyi F.A. (2007). Kinetics of mass transfer and colour changes during osmotic dehydration of watermelon, Journal of Food Engineering 80, 979-985.
[17]Mina Akbarian, Nila Ghasemkhani, Fatemeh Moayedi (2014). Osmotic dehydration of fruits in food industrial: A review International Journal of Biosciences Vol. 4, No. 1, p. 42-57.