246
Optimal Placement & Sizing Of Distributed
Generation (DG) To Minimize Active Power Loss
Using Particle Swarm Optimization (PSO)
Deepak Pandey,Jitendra Singh Bhadoriya
Abstract: Growing concerns over environmental impacts, conditions for improvement of the whole distribution network, and rebate programs offered by governments have contributed to an increment in the number of DG units in commercial and domestic electrical power output. It is known that the non optimal size and non optimal placement of DG units may lead to high power losses, bad voltage profiles. Therefore, this paper introduces a sensitivity analysis to determine the optimal sitting and sizing of DG units. A new methodology PSO for the placement of DG in the radial distribution systems to reduce the active power losses and to improve the voltage profile. A two-stage methodology is practiced for the optimal DG placement. In the first stage Power System Analysis Toolbox (PSAT), an open source MATLAB software package for analysis and design of small to medium size electric power systems for power flow and in the second stage, PSO is used to find the optimal size and site of DG in distribution systems. The effectiveness of the proposed method is demonstrated through IEEE 16 bus standard test systems.
Keywords: DG, PSAT, PSO, Loss minimization, Radial distribution system.
————————————————————
1. INTRODUCTION
The increasing demand on the power system has posed a challenging task to power system engineers in maintaining a reliable system economically. In the heavily loaded network, the load current drawn from the source would increase. This may lead to an increase in voltage drop and system losses[13-14][17-18]. The performance of distribution system becomes inefficient due to the reduction in voltage magnitude and increase in distribution losses. With this regard, changing environment of power systems design and operation has necessitated the need to consider active distribution network by incorporating DG unit [1]. DG is grid-connected or stand-alone electric generation units located within the electric distribution system at or near the end user. The integration of DG in distribution system would lead to improving the voltage profile and reduce active power loss in Power supply[3-6]. Optimization is a mathematical tool which can be used to locate and size the DG units in the system, so as to utilize these units optimally within certain limits and constraints. The optimal power flow problem has been introduced by Carpentier in 1962 [1]. It has taken over decades to develop efficient algorithms for its solution because it is a very large, non-linear mathematical programming problem. Many different mathematical approaches have been applied for seeking its solution [8-10]. The methods discussed in the literature use one of the following five methods [2][11][12]. They are (i) Lambda iteration method as found in economic dispatch problem solving, (ii) Gradient method, (iii) Newton-Raphson Method, (iv) Linear programming and (v) Interior point method. Apart from analytical approaches, there also exist heuristic search methods. Newly developed heuristic approaches called PSO has been introduced [7]. This method combines social psychology principles and evolutionary computation to motivate the behavior of organisms such as fish schooling, bird flocking, etc. A novel PSO algorithm for distribution system for minimization of active power loss, voltage drop with respect to their loading capabilities. This method thoroughly avoids premature convergence as well as convergence towards global optima. J.Z. Zhu [1], has proposed an improved method to study distribution network reconfiguration (DNRC) based on a refined genetic algorithm (GA). The DNRC model, in
247
proposed improved based method has been tested on a 16-bus test system and compared with the genetic algorithm (GA) based method.
2. BASIC PARTICLE SWARM OPTIMIZATION
ALGORITHM
Particle swarm optimization is a heuristic global optimization method put forward originally by Doctor Kennedy and E berhart in 1995(Kennedy J, Eberhart, R, 1995; Eberhart, R, Kennedy J, 1995) It is developed from swarm intelligence and is based on the research of bird and fish flock movement behavior[15][7]. In the basic particle swarm optimization algorithm, particle swarm consists of ―i‖ particles, and the position of each particle stands for the potential solution in D-dimensional space. The particles change its condition, according to the following three principles:
(1) To keep its inertia
(2) To change the condition according to its most optimist position
(3) To change the condition according to the swarm‘s most optimist position.
The position of each particle in the swarm is affected both by the most optimist position during its movement (individual experience) and the position of the most optimist particle in its surroundings (near experience). When the whole particle swarm is surrounding the particle, the most optimist position of the surrounding is equal to the one of the whole most optimist particle; this algorithm is called the whole PSO[15][20]. Each particle moves to the new position using velocity according to its own experience as called Pbest. Gbest is the overall best value obtained so far by any
particle in the population. By time to time, the PSO consists of velocity changes of each particle towards its Pbest and
Gbest. Each particle tries to modify its current position and
velocity according to the distance between its current position and Pbest, and the current position and Gbest[15].
After finding the best values the particle updates its velocity and position. The velocity of each particle can be modified by equation.
Vi K+1
=wVi K
+c1r1 Pbesti K
−Xi K
+c2r2 Gbesti K
−Xi K
(1)
1
k i
V
=velocity of particle at iterations
W=weight function
C1 & C2 =-weight coefficient both equal to 2
r1 & r2=random number between 0 and 1
k i
X
=current position of particle at iteration
Pbest = best position of particle i th
up to the current iteration
Gbest= best overall position found by the particle up to the
current iteration.
Weight function is given by
W=Wmax−Wmax−Wmin itermax
∗iter
Where
Wmax=initial weight equal to 0.9
Wmin=initial weight equal to 0.4
itermax=maximum iteration number
iter=current iteration number
The new position can be modified by
1 1
(2)
k k k
i i i
X
X
V
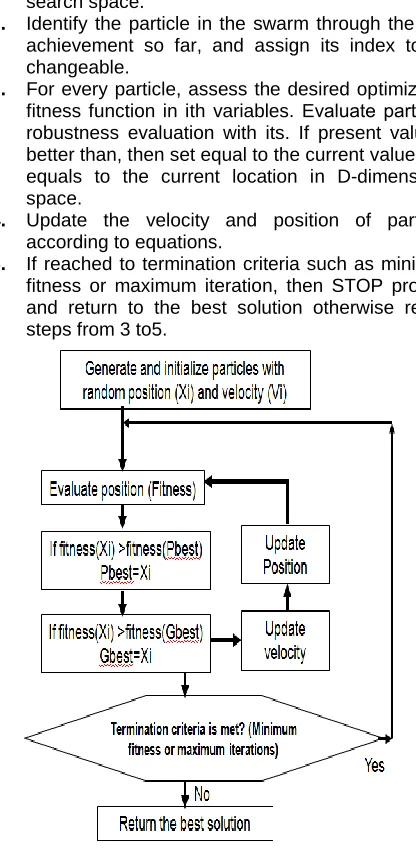
The unique process for establishing PSO is as follows:
1. Initialize population of particle with random position and velocities and D dimensions in the random search space.
2. Identify the particle in the swarm through the best achievement so far, and assign its index to the changeable.
3. For every particle, assess the desired optimization fitness function in ith variables. Evaluate particle‘s robustness evaluation with its. If present value is better than, then set equal to the current value, and equals to the current location in D-dimensional space.
4. Update the velocity and position of particles according to equations.
5. If reached to termination criteria such as minimum fitness or maximum iteration, then STOP process and return to the best solution otherwise repeat steps from 3 to5.
248
The flow chart for the implementation of sizing and siting of DG using PSO for 16-bus system with PSAT is given below.
3. OBJECTIVE FUNCTION
As the main objective of this work is to determine the optimal location and sizing of the distributed generation in the distribution network to minimize the losses (active power loss), the following objective function is selected as:
𝐹𝑙= 𝑚𝑖𝑛 𝑃𝑙𝑜𝑠𝑠 = 𝑛𝑡𝑙𝑘=1 𝐼𝑘 2. 𝑅𝑘 (3) Where
𝐹𝑙 is the objective function to minimize power losses. 𝑃𝑙𝑜𝑠𝑠 is the active power loss.
ntl is the number of lines in the distribution system.
Subjected to constraints: 𝑉𝑖𝑚𝑖𝑛 ≤ 𝑉
𝑖≤ 𝑉𝑖𝑚𝑎𝑥 (4)
𝐼𝑖≤ 𝐼𝑖𝑚𝑎𝑥 (5)
𝑉𝐷𝐺𝑚𝑖𝑛 ≤ 𝑉𝐷𝐺≤ 𝑉𝐷𝐺𝑚𝑎𝑥 (6) 𝑃𝐷𝐺𝑚𝑖𝑛 ≤ 𝑃
𝐷𝐺≤ 𝑃𝐷𝐺𝑚𝑎𝑥 (7) Where,
PDG : real power generations of DG.
Vi : voltage magnitudes at bus i. VDG : voltage magnitudes at bus i.
Ii: ith feeder current loading.
4. PROBLEM FORMULATION
The problem formulation for the optimal location and sizing of the distributed generation in the distribution network to minimize the active power loss includes the power flow with and with-out distributed generation in the distribution system. The distributed generation is considered as active power sources at a particular voltage, which is at unity power factor. The well known basic load flow equations are[20][6]:
*
* *
1 1
.
(8)
(
)
(9)
i i i i i
n n
i ik k i k ik i k ik
k k
S
P jQ V I
V Y V
V V Y
Resolving into the real and imaginary parts, then the power flow equations with-out DG are given as:
1
1
cos(
)
sin(
)
1
10
1
n
i i k ik i k ik Gi Di
k n
i i k ik i k ik Gi Di
k
P
V V Y
P
P
Q
V V Y
Q
Q
The basic power balance equations:
12
13
Gi Di L
Gi Di L
P
P
P
Q
Q
Q
The power flow equations considering losses with DG for the practical distribution system and the DG is an active power source at unity power factor (PV generator) then flow are given as:
(14)
(15)
i DGi Di L
i DGi Di L
P
P
P
P
Q
Q
Q
Q
The DG is active power source only at unity power factor, so QDGi=0.
(16)
(17)
i DGi Di L
i Di L
P
P
P
P
Q
Q
Q
The final power flow equations for distribution system are:
1
1
cos(
)
(18)
sin(
)
(19)
n
i k ik i k ik DGi Di L k
n
i k ik i k ik Di L
k
V V Y
P
P
P
V V Y
Q
Q
1 1cos(
)
0 (20)
sin(
)
0
(21)
n
i k ik i k ik DGi Di L k
n
i k ik i k ik Di L
k
V V Y
P
P
P
V V Y
Q
Q
𝑃𝑖𝑚𝑖𝑛 ≤ 𝑃𝑖≤ 𝑃𝑖𝑚𝑎𝑥 (22) 𝑄𝑖𝑚𝑖𝑛 ≤ 𝑄𝑖≤ 𝑃𝑖𝑚𝑎𝑥 (23)
𝑉𝑖𝑚𝑖𝑛 ≤ 𝑉
𝑖≤ 𝑉𝑖𝑚𝑎𝑥 (24)
𝑃𝐷𝐺𝑚𝑖𝑛 ≤ 𝑃𝐷𝐺 ≤ 𝑃𝐷𝐺𝑚𝑎𝑥 (25)
Where,
Pi, Qi : real and reactive power flow at bus i. PDi, QDi: real and reactive loads at bus i. Vi , Vk : voltage magnitudes at bus i and k.
𝑃𝐷𝐺𝑖: real power of DG at bus i.
N: total number of buses.
𝛿𝑖, 𝛿𝑘: voltage angles of bus i and k.
𝑌𝑖𝑘 : magnitude of the ikth element in bus admittance matrix. 𝜃𝑖𝑘 : angle of the ikth element in bus admittance matrix.
4. PSAT IMPLEMENTATION OF TEST
SYSTEM
In this work, we have presented the load flow simulation results of the 16-bus distribution System using PSAT, an advanced open source Power System Analysis Toolbox[16].
4.1 Introduction of PSAT (Power System Analysis Toolbox)
249
with a complete set of user-friendly graphical interfacesand a Simulink-based editor of one-line network diagrams. Basicfeatures, algorithms, and a variety of case studies are presented in this paper to illustrate the capabilities of the presented tool and its suitability for educational and research purposes[19]. Power System Analysis Toolbox (PSAT) is a Matlab toolbox for electric power system analysis and control. Besides basic power flow analysis, PSAT offers several other static/dynamic analyses like CPF (Continuation Power Flow), OPF (Optimal Power Flow), Small-signal stability analysis, Time-domain simulations etc. Only the power flow feature is explored for the simulation purpose of this work[16][19][21]. Newton-Raphson (NR) method, Fast decoupled methods (both BX and XB), Runge-Kutta method, Simple robust method are the available algorithmic options provided by PSAT to conduct power flow analysis. Both theoretically and practically NR algorithm converges faster to the solutions than the others, which is why we applied it to our system.
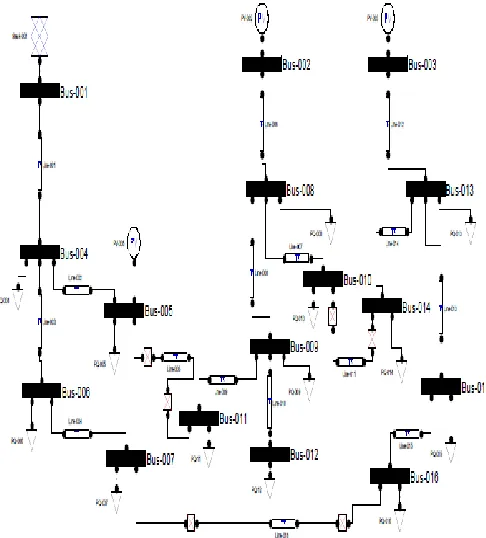
4.2 IEEE-16 Bus Radial Distribution System Modelling
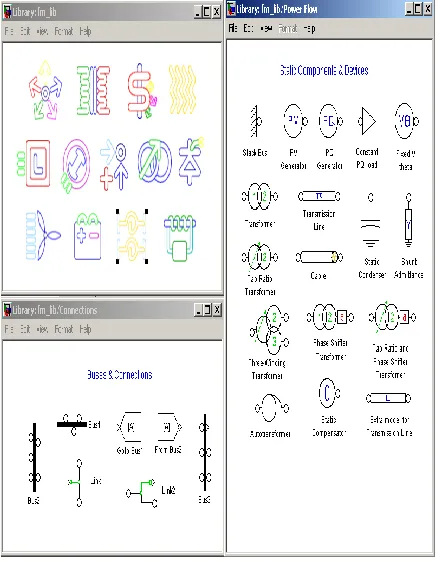
This section illustrates the modeling and implementation of the 16-bus test system, which is given below. The single line diagram if IEEE 16-bus test system given in fig 5. Fig. 6 depicts the model of the IEEE 16-bus network built using the PSAT Simulink library (see Fig. 4). Once defined in the Simulink model, one can load the network in PSAT and solve the power flow. Power flow results can be displayed in a GUI and exported to a file in several formats including, notepad, Excel and LaTeX[19]. PSAT also allows displaying bus voltages and power flows within the Simulink model of the currently loaded system.
Fig. 3: Executing the PSAT in GUI Mode
Fig. 4: The PSAT Simulink model library
250
Fig. 6: The PSAT Simulink model of IEEE 16-Bus distribution system
5. Results Analysis
The proposed algorithm is tested using both a 16-bus radial test system. The base values used are 100 MVA and 23 kV. A DG size is considered in a range of 1 kW to–30 kW. In this study, it is considered that the DG is operated at unity power factor. The first bus is considered as the feeder of electric power from the generation/transmission network. The remaining buses of the distribution system except the reference buses are considered for the placement of a DG of given size from the range considered.
251
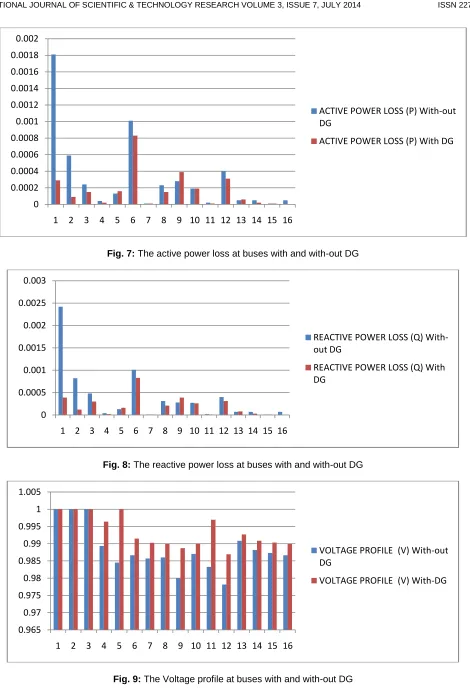
Fig. 7: The active power loss at buses with and with-out DG
Fig. 8: The reactive power loss at buses with and with-out DG
Fig. 9: The Voltage profile at buses with and with-out DG
0 0.0002 0.0004 0.0006 0.0008 0.001 0.0012 0.0014 0.0016 0.0018 0.002
1 2 3 4 5 6 7 8 9 10 11 12 13 14 15 16
ACTIVE POWER LOSS (P) With-out DG
ACTIVE POWER LOSS (P) With DG
0 0.0005 0.001 0.0015 0.002 0.0025 0.003
1 2 3 4 5 6 7 8 9 10 11 12 13 14 15 16
REACTIVE POWER LOSS (Q) With-out DG
REACTIVE POWER LOSS (Q) With DG
0.965 0.97 0.975 0.98 0.985 0.99 0.995 1 1.005
1 2 3 4 5 6 7 8 9 10 11 12 13 14 15 16
VOLTAGE PROFILE (V) With-out DG
252
Table-1: Active, Reactive power loss and Voltage of 16-bus system with-out and with DG
With-out DG With DG
Bus No.
Active Power Loss
Reactive Power
Loss
VOLTAGE PROFILE (V)
Active Power Loss
Reactive Power
Loss
VOLTAGE PROFILE (V)
1. 0.00181 0.00242 1 0.00029 0.00039 1
2. 0.00059 0.00082 1 9.00E-05 0.00012 1
3. 0.00024 0.00048 1 0.00015 0.0003 1
4. 4.00E-05 4.00E-05 0.98934 2.00E-05 2.00E-05 0.9964
5. 0.00013 0.00013 0.98453 0.00016 0.00016 1
6. 0.00101 0.00101 0.98666 0.00083 0.00083 0.9915
7. 1.00E-05 1.00E-05 0.98572 1.00E-05 1.00E-05 0.99026
8. 0.00023 0.00031 0.98601 0.00015 0.00021 0.99003
9. 0.00028 0.00028 0.97995 0.00039 0.00039 0.98871
10. 0.00019 0.00027 0.98705 0.00019 0.00026 0.99008
11. 2.00E-05 2.00E-05 0.98327 1.00E-05 1.00E-05 0.99696
12. 0.0004 0.0004 0.97816 0.00031 0.00031 0.98694
13. 5.00E-05 7.00E-05 0.99083 6.00E-05 8.00E-05 0.99269
14. 5.00E-05 7.00E-05 0.9882 2.00E-05 3.00E-05 0.99086
15. 1.00E-05 1.00E-05 0.98732 1.00E-05 1.00E-05 0.99033
16. 5.00E-05 7.00E-05 0.98664 0 0 0.98996
Table-2: Total Real and Reactive power loss of the 16 bus radial system
PARAMETER WITH-OUT DG WITH DG
REAL POWER [P.U.] 0.00511 0.00267
REACTIVE POWER [P.U.]
253
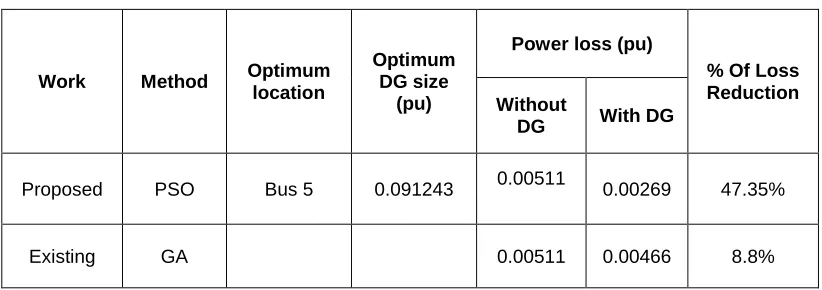
Table-3: Size and location of DG in the 16 bus radial system
Work Method Optimum
location
Optimum DG size
(pu)
Power loss (pu)
% Of Loss Reduction Without
DG With DG
Proposed PSO Bus 5 0.091243 0.00511 0.00269 47.35%
Existing GA 0.00511 0.00466 8.8%
The results show the overall losses of the system are reduced by optimal placement of the DG, which is shown in fig. 7, fig 8 and table 1, table 2, table3. The voltage profiles of the overall system are also improved as shown in fig. and 9, and tables 1.
6. CONCLUSIONS
The results clarified the efficiency of this algorithm for the improvement of the voltage profile, reduction of power losses of the grid, and also for increasing the voltage stability margin and maximum loading. This work presents an efficient method for choosing the suitable placement and size of Distributed Generation (DG) to achieve the third objective which is the minimization of an objective function hence the lowest real power loss. PSO is used to determine the best location and size of DG to achieve these objectives. From the results obtained show that the proper size and site of DG can improve system performance by reducing the loss, and additionally the improve the voltage profile of the system. The conclusions for the objectives are given as:
• Voltage profile is significantly improved by placing DG in Distribution system.
• Particle Swarm Optimization is proposed for finding the optimal size of DG and the location is found where loss is minimized.
• Size and location of DG Estimated for loss minimization.
• Active Power losses have been reduced by
47.35%
REFFERENCES
[1]. J.Z. Zhu, ―Optimal reconfiguration of electrical distribution network using the refined genetic algorithm‖ Electric Power Systems Research, vol. 62, pp. 37-42, Elsevier, 2002.
[2]. Altaf Q.H. Badar , B.S. Umre, A.S. Junghare, ―Reactive power control using dynamic Particle Swarm Optimization for real power loss minimization‖ Electrical Power and Energy Systems, vol. 41, pp. 133–136, Elsevier, 2012.
[3]. Pavlos S. Georgilakis and Nikos D. Hatziargyriou ―Optimal Distributed Generation Placement in Power Distribution Networks: Models, Methods,
and Future Research‖, IEEE Transactions on power systems, Vol. 28, No. 3, august, 2013.
[4]. P.Ravibabu, K.Venkatesh, and C.Sudheer Kumar ―Implementation of Genetic Algorithm for Optimal Network Reconfiguration in Distribution Systems for Load Balancing‖ IEEE Region 8 sibircon pp.124-128, IEEE, 2008.
[5]. Duong Quoc Hung and Nadarajah Mithulananthan ―Multiple Distributed Generator Placement in Primary Distribution Networks for Loss Reduction‖ IEEE Transactions on industrial electronics, Vol. 60, No. 4, April 2013.
[6]. C. L. Wadhwa, ―Electrical Power system,‖ New Age International Publication, Sixth Edition, 2010.
[7]. Swarm Intelligence written by James Kennedy and Russell C. Eberhart, with Yuhui Shi written, Morgan Kaufmann Publishers, 2001 Edition.
[8]. M.F. AlHajri, M.R. AlRashidi, M.E. El-Hawary, Hybrid particle swarm optimization approach for the optimal distribution generation sizing and allocation in distribution systems, in: Proc. of Canadian Conference on Electrical and Computer Engineering, Vancouver, Canada, 2007, pp. 1290– 1293.
[9]. L.Y. Wong, S.R. Abdul Rahim, M.H. Sulaiman, O. Aliman, Distributed generation installation using particle swarm optimization, in: Proc. of Inter. Power Engineering and Optimization Conf., PEOCO2010, Shah Alam, Selangor, Malaysia, 2010, pp. 159–163.
[10]. M.P. Lalitha, V.C.V. Reddy, V. Usha, Optimal DG placement for minimum real power loss in radial distribution systems using PSO, Journal of Theoretical and Applied Information Technology (2010) 107–116.
254
[12]. M.A. Kashem, D.T. Le, M. Negnevitsky, G. Ledwich, Distributed generation for minimization of power losses in distribution systems, in: IEEE Power Eng. Society General Meeting, 2006.
[13]. T. Gozel, M.H. Hocaoglu, An analytical method for the sizing and siting of distributed generators in radial systems, International Journal of Electric Power Systems Research 79 (2009) 912–918.
[14]. A. Safari, R. Jahani, H.A. Shayanfar, J. Olamaei, Optimal DG allocation in distribution network, International Journal of Electrical and Electronics Engineering 4 (8) (2010) 550–553.
[15]. J. Kennedy, R. Eberhart, Particle swarm optimization, in: Proc. IEEE Int. Conf. Neural Networks, Perth, Australia, vol. IV, 1995, pp. 1942– 1948.
[16]. Power System Analysis Toolbox, PSAT.Availableonline:http://www.power.uwaterloo. ca/~fmilano/psat.htm.
[17]. Mithulananthan N, Than Oo and Le Van Phu, ‗Distributed generator placement in power distribution system using genetic algorithm to reduce losses‘, TIJSAT, 9(3) (2004), 55-62.
[18]. El-Kattam,W., Salama, M.M.A, (2004). ―Distributed Generation Technologies: definitions and benefits,‖ Electric Power Research, 71, pp. 119-128.
[19]. F. Milano, An open source power system analysis toolbox. Power Engineering Society General Meeting, 2006. IEEE, Montreal, Que, 2006.
[20]. Hadi Sadat, ―Power system analyses,‖ TMH Publication, 2002 Edition.