_____________________________________________________________________________________________________
Investigation on Statistical Sizing Schemes for
Hybrid Energy Storage Systems
Chao-Tsung Ma
1*and Chin-Lung Hsieh
21
Department of Electrical Engineering, National United University, #2, Lien-Da, Nan-Shih Li, MiaoLi City 36063, Taiwan ROC. 2
Institute of Nuclear Energy Research, Atomic Energy Council, 1000 Wenhua Rd. Jiaan Village, Longtan District, Taoyuan City 32546, Taiwan ROC.
Authors’ contributions
This work was carried out in collaboration between both authors. Author CTM designed the study, performed the investigation on HESS planning methodologies, case analysis and wrote the first draft of the manuscript. Author CLH provided some discussions on the related studies. Both authors read and approved the final manuscript.
Article Information
DOI: 10.9734/JENRR/2018/v1i39847
Editor(s):
(1)Dr. Ismaila Badmus, Department of Mechanical Engineering, Yaba College of Technology, Yaba Lagos, Nigeria.
Reviewers:
(1)Y. U. Yuanbin, Jilin University, China. (2)Hardiansyah, Tanjungpura University, Indonesia. (3)G. Jakasania Ronak, Junagadh Agricultural University, India. Complete Peer review History:http://prh.sdiarticle3.com/review-history/26439
Received 24th June 2018 Accepted 22nd September 2018 Published 28th September 2018
ABSTRACT
This paper explores the power and capacity planning problems in hybrid energy storage systems (HESS) used in grid-connected solar/wind power systems using statistical analysis and numerical methods. A proper HESS operation and power management system allows for real-time power distribution control with the required system dynamic response and the characteristics of the internal energy storage devices. The goal of instantaneous power allocation of HESS is to effectively manage the state of charge (SOC), power level, and operating conditions of its internal energy storage devices to achieve optimal efficiency and capacity optimisation. The HESS power and capacity planning method discussed in this paper can be used in most HESS planning cases on a given set of system operating conditions. In order to present the feasibility of the proposed method, the HESS application case discussed in this paper aims to smooth the power fluctuation of wind and solar power generations and simultaneously ensure the specified dispatching power level
and quality. In this paper, HESS cases analysis and numerical comparison studies are carried out with a typical solar/wind power generation system corresponding to two different power dispatching levels.
Keywords: Hybrid energy storage systems; renewable resources; state of charge; power capacity planning.
1. INTRODUCTION
In recent years, climate change and global warming have become more apparent, which has brought warnings to human beings and led governments to think about how to actively reduce carbon and save energy in order to reduce dependency on fossil energy. Several countries have been considering the possibility of continuing the development of nuclear power generation, but there has always been doubt considering nuclear energy about safety and nuclear waste. It is also not easy to obtain consensus from all parties concerned. Developing renewable energy sources, such as solar energy, wind power, tidal energy, and geothermal energy, is currently a more feasible approach. Although renewable energy is inexhaustible and clean, these power generation technologies rely heavily on natural conditions. As a result, power fluctuations are inevitable and it is extremely difficult to dispatch and control the power flow on renewable energy. From the technical point of view, proper designed energy storage systems can alleviate the above problems in a certain degree. Taking the smoothing power fluctuation as an example, according to the instantaneous power generation and the desired dispatching power, the energy storage system can be adjusted by instantaneously controlling the amount of power flowing in and out [1]. In practice, the power variation adjusted by typical energy storage systems (ESSs) can be subdivided into high frequency and low frequency powers, which correspond to actual scenarios of high-frequency sudden surges in power demand, intermittent solar power generation, and fluctuations in wind power generation, and low-frequency daily average power consumption [2]. Considering practical applications, the exchange of high frequency power usually requires an ESS component with high power density, while low frequency power exchange requires a high energy density ESS component. However, current ESS components have not been found to have a good response to both high frequency and low frequency [3]. One solution is to integrate multiple types of energy storage
components into a hybrid energy storage system (HESS) [4].
flywheel energy storage has been discussed in [11]. The power reference of the flywheel is based on the upper and lower operating limits of the energy storage device. Probability method for determining the capacity of HESS is discussed in [12], where high frequency fluctuations are handled by supercapacitors. The determination of the battery capacity is based on 95% of the cumulative density function of energy storage power, and the remaining power will be absorbed by the supercapacitor. This paper will introduce and evaluate the power and capacity planning methods for HESS consisting of supercapacitors and batteries. The analysis scenarios are based on smoothing power fluctuations of a PV-WTG power generation system. The management of the operation in HESS is based on a simple low-pass filter to separate the power of HESS into two parts, in order to match HESS power magnitude and dynamic characteristics as much as possible. In practice, hysteresis controller can be used to select the appropriate SOC operating range for individual components in the HESS. In order to demonstrate the practicality of the proposed method, the power and energy capacity planning results of each component in HESS are obtained in each case presented, according to the specification of different working ranges. The main content of the paper is arrangement into following six sections: Section II introduces theories related to renewable energy modeling. The third section describes grid-connected PV-WTG power generation system. The fourth section is the energy management strategy. Section V describes the capacity allocation method and case analysis results with the proposed HESS. The results are discussed in Section VI. The last section is the conclusion.
2. RENEWABLE ENERGY MODELING
Since PV-WTG power generation relies on environmental and natural conditions, various probability distribution tools are often used to analyse meteorological data (wind speed, solar irradiance, temperature, etc.). Several studies have reported that the Weibull and Normal distributions are suitable for defining statistical models of wind speed and solar radiation, respectively. The following further explains the models:
2.1 Solar Irradiance Modeling
Solar radiation data for a period of time can be analysed using the normal distribution. The
probability density function (pdf) of the distribution can be found in [13,14] as follows:
2 2
(
)
2
1
( )
2
s
P s
e
(1)where μ is the mean, σ is the standard deviation, and s is the radiation.
Cumulative distribution function (cdf) can be used for power capability and capacity analysis and design of energy storage components. The cumulative distribution function is the integration of the density function. Taking the irradiance data as an example, it can be expressed as follows:
sp
t
dt
s
P
(
)
(
)
(2)2.2 Wind Speed Modeling
Weibull distribution is most commonly used to describe the random behavior of wind speed over a specific period of time [13-17]. Its probability density function (pdf) is expressed as:
)
)
(
(
)
(
)
(
k 1 kc
v
e
c
v
c
k
v
f
for c > 1 ; k > 0(3)
Its cumulative distribution function (cdf) can be expressed as follows:
)
)
(
(
1
)
(
kc
v
e
v
F
(4)v: wind speed; c: scaling factor; k: form factor. Here, we use the Rayleigh distribution of Weibull distribution [16] to calculate c and k for a specific case. We can first fix the value of c to be 8, then compare k = 1, 2, and 3. We find that k = 2 is quite suitable for describing wind speed. In many cases, when there is less knowledge of the wind data for a specific location, it is usually assumed that k = 2. For k = 2, it can be found that there is a direct relationship between c and v.
3. GRID-CONNECTED PV-WTG POWER GENERATION SYSTEM
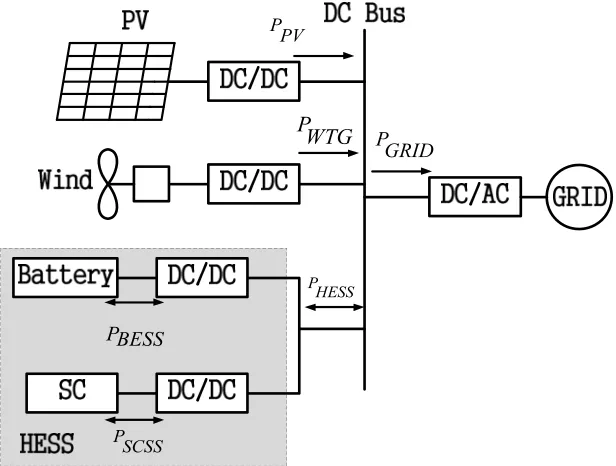
paper, including wind turbine generation (WTG), photovoltaic (PV), grid-connected mains and hybrid energy storage system (HESS), where
PPV, PWTG, PGRID and PHESS respectively represent
instantaneous power of the PV system, WTG system, grid and HESS, and PBESS and PSCESS
are the charge and discharge power of batteries and supercapacitors in PHESS.
3.1 PV Power Generation System Modeling
According to Lan et al., Nguyen et al. [18,19], mathematical model of the generated power (PPV) of a PV power generation system (not
applicable when the solar irradiance is 0) can be expressed as the following formula:
c jref
p pv refmes
PV T T K N
G G P
P [ max 0.001 ]
(5)
TC: cell’s temperature under nominal operation
(46°C); Gmes: solar irradiance; Pmax: maximum power under standard test conditions (1000 W/m2, 25°C); Gref: reference solar irradiance
(1000 W/m2); Tjref: reference temperature (25°C); Kp: output power to temperature sensitivity; Npv: number of PV panels. The meteorological data
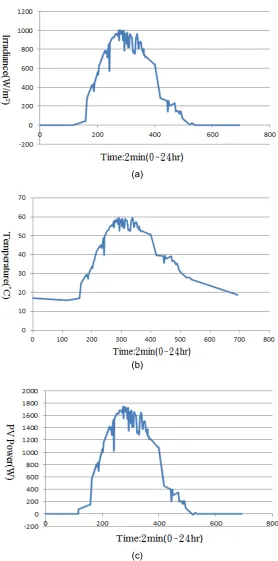
(wind speed, solar irradiance) used in this study employs a recorded 24-hour parameter (recording a set of data every 2 minutes) with a total of 693 data sets. Fig. 2 shows the environmental data of the PV system used in this study.
3.2 WTG Power Generation System Modeling
The output power of a wind turbine can be calculated by the following formula:
cout n reated n cin cin n cin rated cout cin wtv
v
v
P
v
v
v
v
v
v
v
P
v
v
v
v
P
,
0
(6)Prated: Maximum power generated by wind turbine
(2000W here); vcin: cut-in wind speed (2 m/s); vcout: cut-out wind speed (20 m/s); vn: nominal
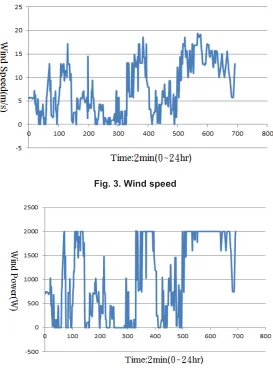
wind speed (12 m/s). Figs. 3 and 4 show wind speed and the corresponding WTG power, respectively.
(a)
(b)
(c)
Fig. 3. Wind speed
Fig. 4. WTG power
4. POWER AND CAPACITY PLANNING FOR HESS
The design of HESS can be estimated via analysing the energy and power distributions [13,14]. The power capacity of the HESS can be defined by the maximum instantaneous power of each energy storage unit; it is represented by
PCbss and PCscss for the battery and
supercapacitor, respectively. The energy capacity of the HESS can be defined by ECbss
and ECscss.
The power capacity of a battery storage system (BSS) and supercapacitor storage system (SCSS) can be expressed as:
) ( max bss
t
bss P
Pc ; max( scss)
t
scss P
Pc (7)
The capacity of BSS and SCSS can be expressed as:
} {0
t scss
scss abs P dt
Ec ;
Ec
bss
abs
{
0tP
bssdt
}
(8)5. CASE ANALYSIS AND DISCUSSION
Case 1:
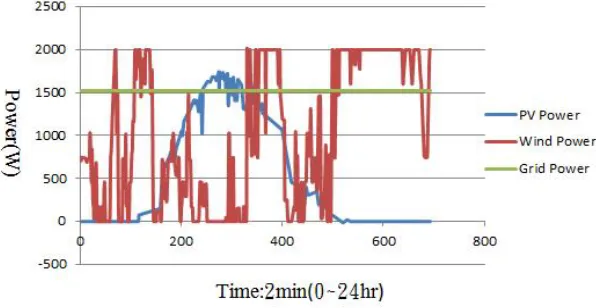
In order to understand the instantaneous charge and discharge power required by HESS, the power output of PV and WTG generation systems (PPV and PWTG) presented in Figs. 2(c) and 4 can be compared with the smooth dispatching power (PGRID in Fig. 1, 1524.504W in
this case), as shown in Fig. 5.
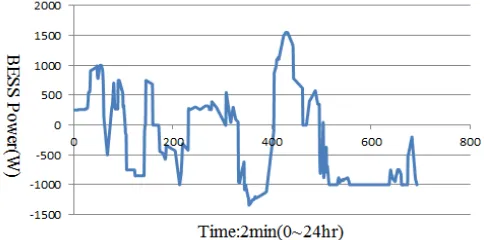
The relationship among HESS, PV-WTG system and the grid is shown in (8). In practice, the power of BESS and SCESS can be derived from the control strategy of HESS power energy management (Fig. 4). In general, BESS is mainly responsible for the lower-frequency power of the HESS due to its higher energy density, as shown in Fig. 6.
The power capacity planning of the BESS can be appropriately selected by the cumulative density
function (cdf) of the power normal distribution. Cdf is obtained by integrating the probability density function (pdf). The normal distribution
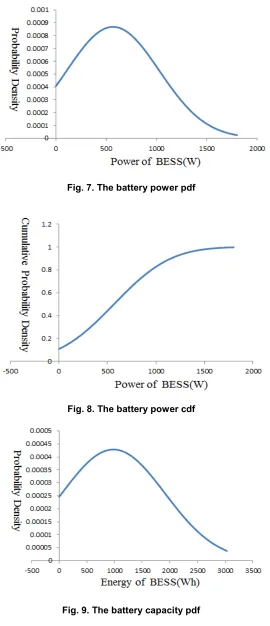
probability function of the battery power density can be calculated by (1), as shown in Fig. 7.
The cdf of the BESS can then be calculated by (2). For example, the power corresponding to 80% of the cumulative density is the system power capacity of 80% of the entire power distribution, as shown in Fig. 8.
The capacity of BESS is also calculated using the cdf of normal distribution. It is calculated in the same way as that in power’s case, but the power integral must first be converted to energy. The relationship between power and energy can then be calculated by equation (10), as shown in Fig. 9.
Fig. 5. Power comparison of the Grid, PV system and WTG system
Fig. 7. The battery power pdf
Fig. 8. The battery power cdf
The cdf of the BESS capacity is also calculated in the same manner as the cdf of the power capacity. The result obtained is shown in Fig. 10.
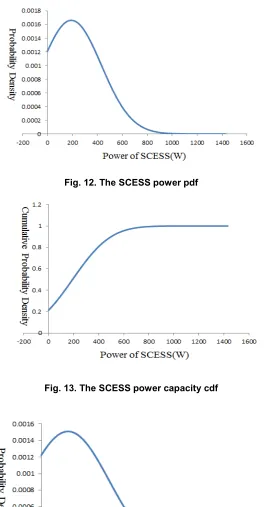
The power of SCESS is the same as BESS, which is obtained by the control strategy shown in Fig. 4. It can be seen from Fig. 11 that SCESS is responsible for the frequent fluctuation of HESS power due to its high power density, and therefore its power curve is fluctuating around zero.
The pdf of the power capacity of SCESS is shown in Fig. 12.
The cdf of the power capacity of SCESS is shown in Fig. 13.
The pdf of the capacity of SCESS is shown in Fig. 14.
The cdf of the capacity of SCESS is shown in Fig. 15.
For an easy comparison, the results of HESS capacity planning for different cdf levels in case 1 are summarised in Table 1.
Fig. 10. Battery capacity cdf
Fig. 11. The SCESS power
Table 1. Case 1 HESS power and capacity distribution
cdf 30% 50% 75% 90% 100%
328 573.75 890 1176.92 1800
65.5 194.5 354.27 503.12 1430.56 499.87 979.98 1622.31 2185.63 3032.38 33.57 172.08 356.82 523.75 1274.34
)
(W
Pcbss
) (W Pcscss
) (Wh Ecbss
Fig. 12. The SCESS power pdf
Fig. 13. The SCESS power capacity cdf
Fig. 15. The SCESS Capacity cdf
Case 2:
In this case, the system and power generation conditions of Case 2 are the same as those of Case 1, with the only difference being that the power curve of the dispatching power is changed to a three-level variation of
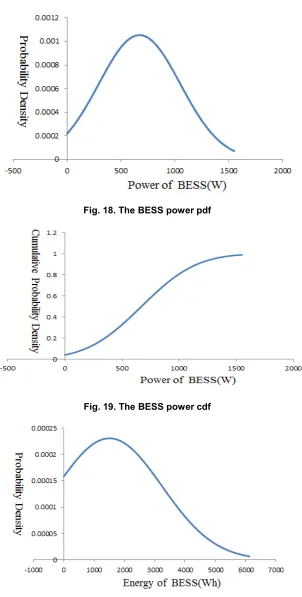
1000W-2000W-1000W. Since the method of data processing is exactly the same as that in Case 1, the processing of this case can be referred to the description of Case 1. The results are presented in Figs. 16-26. The results of HESS capacity planning for different cdf values are summarised in Table 2.
Fig. 16. Comparison of power curves of the Grid and PV-WTG systems
Fig. 18. The BESS power pdf
Fig. 19. The BESS power cdf
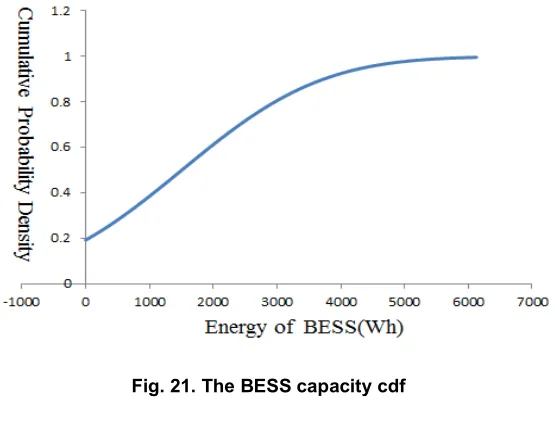
Fig. 21. The BESS capacity cdf
Fig. 22. The SCESS power
Fig. 24. The SCESS power cdf
Fig. 25. The SCESS capacity pdf
Table 2. Case 2 HESS power and capacity distribution
cdf 30% 50% 75% 90% 100%
478 672 928 1160 1550
58.74 169.22 310 436.11 1355.06 599.77 1504.62 2671.28 3738 6126.58 0.004 82.43 191.96 293.46 737.2
Tables 1 and 2 illustrate the results of five different satisfaction degree scenarios under two power dispatching conditions respectively. Taking the case of variable dispatching power (1000W-2000W-1000W, in case 2) as an example, the corresponding 90% cdf of Ecbss is
3738Wh, and 1504.62Wh for 50% cdf. Compared to 90% cdf, when a lower cdf, 50%, is chosen, the capacity can be reduced by 59%. For the 90% Pcscss cdf has a power capacity of
436.11W and 169.22W for the 50% cdf of SC. The BESS power capacity Pcbss corresponding to
90% cdf is 1160W, and the 50% cdf corresponds to 672 W. This means that proper selection of power smoothing level can effectively reduce both the energy capacity and power capacity of the HESS.
6. CONCLUSION
The widespread use of renewable energy generation depends on the proper design and control of advanced energy storage systems. The hybrid energy storage system (HESS), which combines flexible functionality and better cost features, is the key device worthy of in-depth research in this regards. This paper has successfully explored a power and capacity planning scheme for the HESS in a well known grid-connected PV-WTG power generation system using numerical methods and statistical concepts. In this paper, the investigation of power and capacity planning schemes for the HESS is carried out in two cases through systematic analysis and numerical calculations. From the numerical calculation results of the two study cases, it has been found that balancing the power, capacity specification and control performance of the HESS in practical applications can help in obtaining better system economic benefits.
ACKNOWLEDGEMENTS
This work was supported in part by the INER, Taiwan, R.O.C under contract No. NL1070422.
COMPETING INTERESTS
Authors have declared that no competing interests exist.
REFERENCES
1. Fu Q, Montoya LF, Solanki A, et al. Microgrid generation capacity design with renewables and energy storage addressing power quality and surety. IEEE Trans. Smart Grid. 2012;3(4):2019–2027. 2. Ahn SJ, Park JW, Chung IY, et al.
Power-sharing method of multiple distributed generators considering control modes and configurations of a microgrid. IEEE Trans. Power Deliv. 2010;25(3):2007–2016. 3. Chen H, Cong TN, Yang W, et al. Progress
in electrical energy storage system: A critical review. Prog. Nat. Sci. 2009;19(3): 291–312.
4. Jing W, Lai CH, Wong SHW, Wong MLD. Battery-supercapacitor hybrid energy storage system in standalone DC microgrids: A review. IET Renew. Power Gener. 2017;11(4):461-469.
5. Yuan H, Jianxiang L, Bingliang Z, Haibo L, Xu Z, Bohao S, Shenquan Y. A dynamic optimal control strategy for BESS considering wind power forecasting. IEEE International Conference on Mechatronics and Automation (ICMA). Proc. 2014;2072-2076.
6. Yang Y, Li H, Achhorn A, Jianping Z, Greenleaf M. Sizing strategy of distributed battery storage system with high penetration of photovoltaic for voltage regulation and peak load shaving. IEEE Trans Smart Grid. 2014;5(2):982-991. 7. Willis HL, Scott WG. Distributed power
generation planning and evaluation. New York, NY, USA: Marcel Dekker, Inc. 2000;141–144.
8. de la Torre S, Sanchez-Racero AJ, Aguado JA, Reyes M, Martianez O. Optimal sizing of energy storage for regenerative braking in electric railway systems. IEEE Trans Power Systems. 2014;99:1-9.
10. Guishi W, Ciobotaru M, Agelidis VG. Power smoothing of large solar PV plant using hybrid energy storage. IEEE Trans Sustainable Energy. 2014;5(3):834-842. 11. Cimuca G, Breban S, Radulescu MM,
Saudemont C, Robyns B. Design and control strategies of an induction-machine-based flywheel energy storage system associated to a variable-speed wind generator. IEEE Trans Energy Conversion. 2010;25(2):526-534.
12. Xiaoyu W, Meng Y, Muljadi E, Wenzhong G. Probabilistic approach for power capacity specification of wind energy storage systems. IEEE Trans Industry Applications. 2014;50(2):1215-1224. 13. Abbassi A, Dami MA, Jemli M. Statistical
characterization of capacity of Hybrid Energy Storage System (HESS) to assimilate the fast PV-Wind power generation fluctuations. IEEE Conferences. 2017;467–472.
14. Abbassi A, Dami MA, Jemli M. A statistical approach for hybrid energy storage system sizing based on capacity distributions in an
autonomous PV/Wind power generation system. Renewable Energy. 2017;103:81-93.
15. Kayal P, Chanda CK. Optimal mix of solar and wind distributed generations considering performance improvement of electrical distribution network. Renewable Energy. 2015;75:173-186.
16. Borowy BS, Salamah ZM. Methodology for optimally sizing the combination of a battery bank and PV array in a wind/PV hybrid system. IEEE Transactions on Energy Conversion. 1996;11(2):367-375. 17. Masters GM. Renewable and efficient
electric power systems. New York: Wiley. 2004;307–383.
18. Lan H, Wen S, Hong YY, Yu DC, Lijun Zhang. Optimal sizing of hybrid PV/diesel/battery in ship power system. Applied Energy. 2015;158:26–34.
19. Nguyen TA, Crow ML, Elmore AC. Optimum sizing of a vanadium redox battery system foe microgrid systems. IEEE Transactions on Sustainable Energy. 2015;6(3):729-737.
_________________________________________________________________________________
© 2018 Ma and Hsieh; This is an Open Access article distributed under the terms of the Creative Commons Attribution License (http://creativecommons.org/licenses/by/4.0), which permits unrestricted use, distribution, and reproduction in any medium, provided the original work is properly cited.
Peer-review history: